References
- ↑ Judge lambasts postal ballot rules as Labour 6 convicted of poll fraud – Telegraph
- ↑ BBC NEWS | UK | England | West Midlands | Judge upholds vote-rigging claims
- ↑ BusinessLive (3 May 2005). "Councillor cleared of vote fraud". Business Live. Retrieved 5 December 2020.
{{cite web}}:|last=has generic name (help) - ↑ Council, Birmingham City. "Councillors by Ward: Aston | Birmingham City Council". www.birmingham.gov.uk. Retrieved 9 May 2023.
Birmingham UK parliamentary constituencies (left) and city council wards | ||
| Edgbaston | 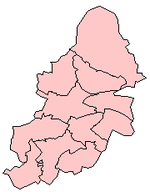 | |
| Erdington | ||
| Hall Green | ||
| Hodge Hill |
| |
| Ladywood | ||
| Northfield | ||
| Perry Barr | ||
| Selly Oak | ||
| Sutton Coldfield | ||
| Yardley | ||