The 2018 North Tyneside Metropolitan Borough Council election took place on 3 May 2018 to elect members of North Tyneside Metropolitan Borough Council in England. [1] This was held on the same day as other local elections.
All of the seats being contested were last contested in 2014, and these results are compared to the results of 2016.
Party | Candidate | Votes | % | ±% | |
---|---|---|---|---|---|
Labour | Steven Phillips | 1,719 | 69.3 | -4.6 | |
Conservative | David Inness | 453 | 18.3 | -1.3 | |
Liberal Democrats | Margaret Finlay | 310 | 12.5 | +12.5 | |
Majority | 1,266 | 51 | -3.3 | ||
Turnout | 2,482 | 30.8 | -1.2 | ||
Labour hold | Swing | -1.7 | |||
Party | Candidate | Votes | % | ±% | |
---|---|---|---|---|---|
Labour | Peter Earley | 1,952 | 65.6 | +4.9 | |
Conservative | George Partis | 789 | 26.5 | +9.2 | |
Liberal Democrats | Joan Harvey | 235 | 7.9 | +7.9 | |
Majority | 1,163 | 39.1 | -4 | ||
Turnout | 2,976 | 38.6 | -1.1 | ||
Labour hold | Swing | -2.2 | |||
Party | Candidate | Votes | % | ±% | |
---|---|---|---|---|---|
Labour | Janice Mole | 1,565 | 74.1 | +15.5 | |
Conservative | David Sarin | 547 | 25.9 | +16.2 | |
Majority | 1,018 | 48.2 | +21.4 | ||
Turnout | 2,112 | 27.4 | +0.6 | ||
Labour hold | Swing | -0.4 | |||
Party | Candidate | Votes | % | ±% | |
---|---|---|---|---|---|
Labour | Margaret Reynolds | 1,412 | 75.8 | +14.3 | |
Conservative | Susan Rodgerson | 451 | 24.2 | +13.9 | |
Majority | 961 | 51.6 | +18.2 | ||
Turnout | 1,863 | 24.2 | -1.9 | ||
Labour hold | Swing | +0.2 | |||
Party | Candidate | Votes | % | ±% | |
---|---|---|---|---|---|
Labour | Steve Cox | 1,555 | 59.7 | +8.1 | |
Conservative | Lewis Austin | 1,051 | 40.3 | +12.8 | |
Majority | 504 | 19.3 | -4.8 | ||
Turnout | 2,606 | 31.3 | -3.2 | ||
Labour hold | Swing | -2.4 | |||
Party | Candidate | Votes | % | ±% | |
---|---|---|---|---|---|
Labour | Willie Samuel | 1,626 | 46.3 | -3.6 | |
Conservative | Kenneth Barrie | 1,585 | 45.1 | +4.9 | |
Green | Nick Martin | 213 | 6.1 | +6.1 | |
UKIP | Pamela Hood | 89 | 2.5 | -7.4 | |
Majority | 41 | 1.2 | -8.6 | ||
Turnout | 3,513 | 47.6 | -2.9 | ||
Labour gain from Conservative | Swing | -4.3 | |||
Party | Candidate | Votes | % | ±% | |
---|---|---|---|---|---|
Conservative | Christopher Johnston | 246 | 12.7 | +5.8 | |
UKIP | Gary Legg | 183 | 8.7 | -11.3 | |
Labour | Maureen Madden | 1,534 | 72.7 | +2.6 | |
Liberal Democrats | June Smith | 146 | 6.9 |
Party | Candidate | Votes | % | ±% | |
---|---|---|---|---|---|
Labour | Linda Darke | 1,715 | 63.9 | -2.7 | |
Conservative | Margaret Marshall | 739 | 27.6 | +11.2 | |
Liberal Democrats | Jonathan Olsson | 228 | 8.5 | N/A |
Party | Candidate | Votes | % | ±% | |
---|---|---|---|---|---|
Liberal Democrats | Darryl Roe | 152 | 6.5 | N/A | |
Conservative | Robin Underwood | 449 | 19.3 | +1.0 | |
Labour | Joan Walker | 1722 | 74.1 | -7.6 |
Party | Candidate | Votes | % | ±% | |
---|---|---|---|---|---|
Labour | Joe Kirwin | 1,649 | 47.1 | +6.9 | |
Conservative | Les Miller | 1,621 | 46.3 | +0.2 | |
Liberal Democrats | David Nisbet | 180 | 5.1 | -1.1 | |
UKIP | Stephen Borlos | 50 | 1.4 | -6.1 | |
Majority | 28 | 0.8 | -5.8 | ||
Turnout | 3,500 | 50.1 | -0.4 | ||
Labour gain from Conservative | Swing | +3.4 | |||
Party | Candidate | Votes | % | ±% | |
---|---|---|---|---|---|
Conservative | Sean Brockbank | 1,707 | 46.5 | +7.5 | |
Labour | Ian Grayson | 1,645 | 44.8 | +4.8 | |
Green | Julia Erskine | 116 | 3.2 | -4.7 | |
Liberal Democrats | Simon Roffe | 100 | 2.7 | +2.7 | |
UKIP | Phyllis Masters | 67 | 1.8 | -11.3 | |
Renew | Alex Jacobs | 33 | 0.9 | +0.9 | |
Majority | 62 | 1.7 | +0.7 | ||
Turnout | 3,668 | 48.9 | +3.8 | ||
Conservative gain from Labour | Swing | +1.4 | |||
Party | Candidate | Votes | % | ±% | |
---|---|---|---|---|---|
Labour | Trish Brady | 996 | 45.3 | +3.1 | |
Liberal Democrats | Marian Huscroft | 972 | 44.2 | -7.8 | |
Conservative | Miriam Smith | 230 | 10.5 | +4.7 |
Party | Candidate | Votes | % | ±% | |
---|---|---|---|---|---|
Labour | Kate Osborne | 1,255 | 50.5 | +1.0 | |
Conservative | Glynis Barrie | 1,052 | 42.3 | +4.0 | |
Green | Martin Osborne | 179 | 7.2 | +7.2 |
Party | Candidate | Votes | % | ±% | |
---|---|---|---|---|---|
Labour | Charles Pickard | 1,329 | 65.6 | -0.9 | |
Conservative | Maureen Jeffrey | 343 | 16.9 | +5.6 | |
Green | Rosie Hamilton | 182 | 9 | +9 | |
UKIP | Tony Kearney | 172 | 8.5 | -13.7 | |
Majority | 986 | 48.7 | +4.3 | ||
Turnout | 2,026 | 25.3 | -0.9 | ||
Labour hold | Swing | -3.3 | |||
Party | Candidate | Votes | % | ±% | |
---|---|---|---|---|---|
Conservative | Pam McIntyre | 2,113 | 59.4 | -6.3 | |
Labour | Paul Richardson | 1,187 | 33.3 | +8.4 | |
Liberal Democrats | Janet Appleby | 173 | 4.9 | +4.9 | |
UKIP | William Jackson | 87 | 2.4 | -6.9 | |
Majority | 926 | 26 | -14.8 | ||
Turnout | 3,560 | 50.9 | -1.8 | ||
Conservative hold | Swing | -7.4 | |||
Party | Candidate | Votes | % | ±% | |
---|---|---|---|---|---|
Labour | Sarah Day | 1,641 | 42.6 | +1.8 | |
Conservative | Lewis Bartoli | 1,321 | 34.3 | -2.2 | |
Independent | Jean McLaughlin | 486 | 12.6 | -2.3 | |
Renew | Tom Bailey | 142 | 3.7 | +3.7 | |
Green | Alan Steele | 139 | 3.6 | +3.6 | |
UKIP | Henry Marshall | 59 | 1.5 | -6.3 | |
Liberal Democrats | Thomas Clarke | 58 | 1.5 | +1.5 | |
Majority | 320 | 9.1 | +4.9 | ||
Turnout | 3,846 | 46.9 | +1.2 | ||
Labour hold | Swing | +2 | |||
Party | Candidate | Votes | % | ±% | |
---|---|---|---|---|---|
Labour | Brian Burdis | 1,561 | 63 | -0.8 | |
Conservative | David Lilly | 493 | 19.9 | +3.9 | |
UKIP | Jim Davey | 157 | 6.3 | -13.9 | |
Green | John Morley | 139 | 5.6 | +5.6 | |
Independent | Andrew Pattinson | 129 | 5.2 | +5.2 | |
Majority | 1,068 | 43.1 | -0.5 | ||
Turnout | 2,479 | 27.6 | -0.2 | ||
Labour hold | Swing | -2.4 | |||
Party | Candidate | Votes | % | ±% | |
---|---|---|---|---|---|
Labour | Linda Bell | 1,337 | 58.9 | +12.6 | |
Liberal Democrats | Jonathon Proctor | 445 | 19.6 | -18.8 | |
Conservative | Liam Bones | 289 | 12.7 | +8.6 | |
Green | Martin Collins | 199 | 8.8 | +8.8 | |
Majority | 892 | 39.3 | +31.4 | ||
Turnout | 2,270 | 29.8 | -1.7 | ||
Labour hold | Swing | +15.7 | |||
Party | Candidate | Votes | % | ±% | |
---|---|---|---|---|---|
Labour | Joanne Cassidy | 1,775 | 62.4 | +8.3 | |
Conservative | Barbara Stevens | 1,068 | 37.6 | +12.5 | |
Majority | 707 | 24.9 | -4.1 | ||
Turnout | 2,843 | 36.4 | -1.1 | ||
Labour hold | Swing | -2.1 | |||
Party | Candidate | Votes | % | ±% | |
---|---|---|---|---|---|
Labour | Margaret Hall | 1,796 | 59.3 | -0.5 | |
Conservative | Frank Austin | 783 | 25.9 | -1.5 | |
Liberal Democrats | John Appleby | 224 | 7.4 | +2.7 | |
Green | Sophie Reid-McGlinn | 223 | 7.4 | +7.4 | |
Majority | 1,013 | 33.5 | +1.1 | ||
Turnout | 3,026 | 42 | +0.8 | ||
Labour hold | Swing | +0.5 | |||
Tyne and Wear is a ceremonial county in North East England. It borders Northumberland to the north and County Durham to the south, and the largest settlement is the city of Newcastle-upon-Tyne.
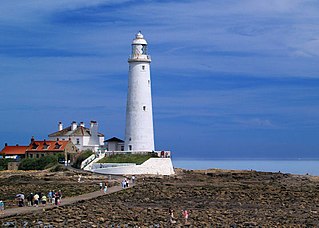
North Tyneside is a metropolitan borough in the metropolitan county of Tyne and Wear, England. It forms part of the greater Tyneside conurbation. North Tyneside Council is headquartered at Cobalt Park, Wallsend.
North Tyneside Metropolitan Borough Council elections are generally held three years out of every four, with a third of the council being elected each time. North Tyneside Borough Council, generally known as North Tyneside Council is the local authority for the metropolitan borough of North Tyneside in Tyne and Wear, England. Since 2002 the borough has been led by the directly elected Mayor of North Tyneside.
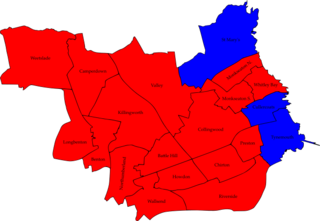
South Tyneside Council elections are generally held three years out of every four, with a third of the council being elected each time. South Tyneside Council is the local authority for the metropolitan borough of South Tyneside in Tyne and Wear, England. Since the last boundary changes in 2004, 54 councillors are elected, 3 from each of the 18 wards.
The 1998 South Tyneside Metropolitan Borough Council election took place on 7 May 1998 to elect members of South Tyneside Metropolitan Borough Council in Tyne and Wear, England. One third of the council was up for election and the Labour Party kept overall control of the council.
The 2000 South Tyneside Council Metropolitan Borough election took place on 4 May 2000 to elect members of South Tyneside Metropolitan Borough Council in Tyne and Wear, England. One third of the council was up for election and the Labour Party kept overall control of the council.
The 2002 South Tyneside Metropolitan Borough Council election took place on 2 May 2002 to elect members of South Tyneside Metropolitan Borough Council in Tyne and Wear, England. One third of the council was up for election and the Labour Party kept overall control of the council.
The 2003 South Tyneside Metropolitan Borough Council election took place on 1 May 2003 to elect members of South Tyneside Metropolitan Borough Council in Tyne and Wear, England. One third of the council was up for election and the Labour Party kept overall control of the council.
The 2004 South Tyneside Metropolitan Borough Council election took place on 10 June 2004 to elect members of South Tyneside Metropolitan Borough Council in Tyne and Wear, England. The whole council was up for election with boundary changes since the last election in 2003 reducing the number of seats by 6. The Labour Party stayed in overall control of the council.
The 2006 South Tyneside Metropolitan Borough Council election took place on 4 May 2006 to elect members of South Tyneside Metropolitan Borough Council in Tyne and Wear, England. One third of the council was up for election and the Labour Party stayed in overall control of the council.
The 2012 South Tyneside Metropolitan Borough Council election took place on 3 May 2012 to elect members of South Tyneside Metropolitan Borough Council in England. This was on the same day as other 2012 United Kingdom local elections. One third (18) of the seats were being contested, of which Labour won 17, and the Conservatives one.
The 2015 North Tyneside Metropolitan Borough Council election took place on 7 May 2015 to one third of the members of North Tyneside Metropolitan Borough Council in England. This was on the same day as other local elections and the 2015 UK General Election.
South Tyneside Council is the local authority of South Tyneside in Tyne and Wear, North East England. It is a metropolitan borough council, one of five in Tyne and Wear and one of 36 in the metropolitan counties of England. It provides the majority of local government services in South Tyneside.
The 1999 North Tyneside Metropolitan Borough Council election to the North Tyneside Metropolitan Borough Council were held in 1999 alongside other local elections.
The 2016 North Tyneside Metropolitan Borough Council election took place on 5 May 2016 to elect members of North Tyneside Metropolitan Borough Council in England. This was on the same day as other local elections.
The 2018 United Kingdom local elections were held on Thursday 3 May 2018, with local council elections taking place in all 32 London boroughs, 34 metropolitan boroughs, 67 district and borough councils and 17 unitary authorities. There were also direct elections for the mayoralties of Hackney, Lewisham, Newham, Tower Hamlets and Watford.
The 2019 North Tyneside Metropolitan Borough Council election took place on 2 May 2019 to elect members of North Tyneside Metropolitan Borough Council in England. This took place on the same day as other local elections across the UK including the first of 2019 North of Tyne mayoral election.
The 2022 North Tyneside Metropolitan Borough Council election took place on 5 May 2022. One third of councillors—20 out of 60—on North Tyneside Metropolitan Borough Council were elected. The election took place alongside other local elections across the United Kingdom.
The 2022 South Tyneside Metropolitan Borough Council election took place on 5 May 2022 to elect members of South Tyneside Council. This was on the same day as other local elections. 19 of the 54 seats were up for election, with 1 ward (Harton) electing 2 councillors.
The 2023 North Tyneside Metropolitan Borough Council elections were held on 4 May 2023 alongside other local elections in the United Kingdom. One third of the seats on the council were contested at this election. Labour retained its majority on the council.