Elections to Peterborough City Council took place on 3 May 2018. This was on the same day as other local elections across the United Kingdom.
| |||||||||||||||||||||||||||||||||||||||||||||||||||||||||||||||||||||||||||||||||||||||||||||||||||||||||||||||||||||||
18 seats (out of 60 seats) to Peterborough City Council 31 seats needed for a majority | |||||||||||||||||||||||||||||||||||||||||||||||||||||||||||||||||||||||||||||||||||||||||||||||||||||||||||||||||||||||
---|---|---|---|---|---|---|---|---|---|---|---|---|---|---|---|---|---|---|---|---|---|---|---|---|---|---|---|---|---|---|---|---|---|---|---|---|---|---|---|---|---|---|---|---|---|---|---|---|---|---|---|---|---|---|---|---|---|---|---|---|---|---|---|---|---|---|---|---|---|---|---|---|---|---|---|---|---|---|---|---|---|---|---|---|---|---|---|---|---|---|---|---|---|---|---|---|---|---|---|---|---|---|---|---|---|---|---|---|---|---|---|---|---|---|---|---|---|---|---|
| |||||||||||||||||||||||||||||||||||||||||||||||||||||||||||||||||||||||||||||||||||||||||||||||||||||||||||||||||||||||
Map showing the results of the 2018 Peterborough City Council election |
Following the 2016 election, two councillors from Gunthorpe ward left the Liberal Democrat group to sit as Independents.
Party | Seats | Gains | Losses | Net gain/loss | Seats % | Votes % | Votes | +/− | ||
---|---|---|---|---|---|---|---|---|---|---|
Conservative | 31 | 3 | 2 | 1 | 51.7 | 35.5 | 14,630 | 3.3 | ||
Labour | 14 | 2 | 3 | 1 | 23.3 | 34.1 | 14,059 | 2.1 | ||
Liberal Democrats | 6 | 0 | 0 | 10.0 | 10.7 | 4,399 | 4.1 | |||
Werrington First | 3 | 0 | 0 | 5.0 | 3.4 | 1,420 | 0.6 | |||
Independent | 2 | 0 | 0 | 3.3 | 2.2 | 914 | 0.7 | |||
Liberal | 2 | 0 | 1 | 1 | 3.3 | 1.4 | 560 | 1.4 | ||
Green | 1 | 1 | 0 | 1 | 1.7 | 4.1 | 3,164 | 3.6 | ||
UKIP | 1 | 0 | 1 | 1 | 1.7 | 10.3 | 2,068 | 5.3 | ||
Total | 60 | 41,214 | ||||||||
Conservative gain from No overall control |
Party | Candidate | Votes | % | ±% | |
---|---|---|---|---|---|
Conservative | Scott Warren | 851 | 41.8 | 11.3 | |
Labour | Jo Johnson | 824 | 40.5 | 5.8 | |
UKIP | Graham Whitehead | 188 | 9.2 | 21.1 | |
Liberal Democrats | Simon Kail | 92 | 4.5 | 3.7 | |
Green | Barry Warne | 80 | 3.9 | 7.8 | |
Majority | 27 | 1.3 | - | ||
Turnout | 2,035 | 30.8 | |||
Conservative gain from Labour | Swing | 5.3 | |||
Party | Candidate | Votes | % | ±% | |
---|---|---|---|---|---|
Labour | Mahboob Hussain | 1,794 | 52.8 | 7.5 | |
Independent | Mohammad Choudhary | 659 | 19.4 | New | |
Conservative | Louise Coles | 601 | 17.7 | 12.3 | |
Liberal Democrats | Alan Summerside | 132 | 3.9 | New | |
Green | Steve Wilson | 125 | 3.7 | 8.2 | |
UKIP | Jeff Lipscomb | 86 | 2.5 | 8.5 | |
Majority | 1,135 | 33.4 | — | ||
Turnout | 3,397 | 45.0 | |||
Labour hold | Swing | — | |||
Party | Candidate | Votes | % | ±% | |
---|---|---|---|---|---|
Labour | Dennis Jones | 954 | 49.8 | 20.9 | |
Liberal | Sandra Ringler | 560 | 29.2 | 12.6 | |
Conservative | Christopher Moon | 255 | 13.3 | 4.4 | |
UKIP | Romana Cammarata | 88 | 4.6 | 11.3 | |
Green | Carolyn English | 58 | 3.0 | 2.8 | |
Majority | 394 | 20.6 | — | ||
Turnout | 1,915 | ||||
Labour gain from Liberal | Swing | ||||
Party | Candidate | Votes | % | ±% | |
---|---|---|---|---|---|
Labour | Samantha Hemraj | 1,131 | 48.3 | 13.6 | |
Conservative | Muhammad Ikram | 892 | 38.1 | 3.8 | |
UKIP | Graham McMillan | 88 | 4.5 | 16.9 | |
Green | Stefen Clements | 58 | 3.0 | New | |
Majority | 239 | 10.2 | — | ||
Turnout | 2,342 | ||||
Labour hold | Swing | 7.8 | |||
No Liberal candidate as previous (-6.6).
Party | Candidate | Votes | % | ±% | |
---|---|---|---|---|---|
Conservative | Richard Brown | 1,252 | 54.5 | 21.8 | |
Labour | Christian Defeo | 656 | 28.6 | 9.9 | |
UKIP | Layton Mills | 214 | 9.3 | 15.8 | |
Green | Michael Alexander | 105 | 4.6 | 8.8 | |
Liberal Democrats | Callum.A.Robertson | 70 | 3.0 | New | |
Majority | 596 | 25.9 | |||
Turnout | 2,297 | ||||
Conservative hold | Swing | ||||
No Independent candidate as previous (-20.5).
Party | Candidate | Votes | % | ±% | |
---|---|---|---|---|---|
Liberal Democrats | Christian Hogg | 920 | 42.5 | 8.2 | |
Conservative | Bryan Tyler | 453 | 20.9 | 0.3 | |
Labour | Chris Skidmore | 448 | 20.7 | 9.1 | |
UKIP | Peter Reeve | 221 | 10.2 | 19.4 | |
Green | Karen Alexander | 70 | 3.2 | 8.1 | |
Independent | Peter Slinger | 53 | 2.4 | 10.0 | |
Majority | 467 | 21.6 | |||
Turnout | 2,165 | ||||
Liberal Democrats gain from Labour | Swing | 5.9 | |||
Party | Candidate | Votes | % | ±% | |
---|---|---|---|---|---|
Labour | Alan Dowson | 876 | 43.6 | 9.3 | |
Conservative | Nigel North | 864 | 43.0 | 11.8 | |
Green | David Stevenson | 268 | 13.3 | 2.6 | |
Majority | 12 | 0.6 | |||
Turnout | 2,008 | ||||
Labour hold | Swing | 1.4 | |||
No Independent (-16.7) or TUSC (-4.9) candidates as previous.
Party | Candidate | Votes | % | ±% | |
---|---|---|---|---|---|
Liberal Democrats | Andrew Bond | 1,097 | 48.7 | 16.0 | |
Conservative | Emily Fisher | 688 | 30.6 | 5.0 | |
Labour | Haggai Odep | 205 | 9.1 | 6.4 | |
Independent | Antony Lockheart | 120 | 5.3 | New | |
UKIP | Mark Boylan-Taylor | 92 | 4.1 | 15.6 | |
Green | Cherry Beeby | 50 | 2.2 | New | |
Majority | 409 | 18.1 | |||
Turnout | 2,252 | ||||
Liberal Democrats hold | Swing | 2.0 | |||
Party | Candidate | Votes | % | ±% | |
---|---|---|---|---|---|
Conservative | Marco Cereste | 529 | 52.5 | 20.2 | |
Labour | Mohammed Munir | 292 | 29.0 | 0.9 | |
Liberal Democrats | Nicola Mills | 121 | 12.0 | New | |
Green | Greg Guthrie | 66 | 6.5 | 12.5 | |
Majority | 237 | 23.5 | |||
Turnout | 1,008 | ||||
Conservative hold | Swing | ||||
Party | Candidate | Votes | % | ±% | |
---|---|---|---|---|---|
Conservative | Mohammed Farooq | 616 | 49.1 | 18.1 | |
Labour | Callie Louise Hargreaves | 306 | 24.4 | 0.3 | |
Liberal Democrats | Chris Wiggin | 289 | 23.0 | 4.0 | |
Green | Alex Bailey | 44 | 3.5 | New | |
Majority | 310 | 24.7 | |||
Turnout | 1,255 | ||||
Conservative hold | Swing | ||||
Party | Candidate | Votes | % | ±% | |
---|---|---|---|---|---|
Conservative | Shazia Bashir | 1,233 | 44.5 | 5.4 | |
Labour | Naz Bibi | 1,156 | 41.7 | 1.3 | |
UKIP | John Myles | 134 | 4.8 | 9.6 | |
Green | Nicola Day | 131 | 4.7 | 4.8 | |
Liberal Democrats | Phillip Whitley | 115 | 4.2 | 3.8 | |
Majority | 77 | 2.8 | — | ||
Turnout | 2,769 | — | |||
Conservative gain from Labour | Swing | ||||
Party | Candidate | Votes | % | ±% | |
---|---|---|---|---|---|
Conservative | Irene Walsh | 850 | 37.9 | 12.6 | |
Labour | Heather Skibsted | 730 | 32.6 | 3.9 | |
UKIP | John Okonkowski | 322 | 14.4 | 22.4 | |
Green | Alex Airey | 170 | 7.6 | 10.7 | |
Liberal Democrats | Daniel Gibbs | 170 | 7.6 | 4.1 | |
Majority | 120 | 5.3 | — | ||
Turnout | 2,242 | — | — | ||
Conservative gain from UKIP | Swing | ||||
Party | Candidate | Votes | % | ±% | |
---|---|---|---|---|---|
Green | Julie Howell | 1,413 | 50.8 | 27.8 | |
Conservative | Gavin Elsey | 1,058 | 38.0 | 9.6 | |
Labour | Alan Gasperutti | 249 | 8.9 | 9.2 | |
Liberal Democrats | Rachel Speed | 64 | 2.3 | 10.9 | |
Majority | 355 | 12.8 | — | ||
Turnout | 2,784 | ||||
Green gain from Conservative | Swing | ||||
No UKIP candidate as previous (-18.5).
Party | Candidate | Votes | % | ±% | |
---|---|---|---|---|---|
Labour | Aasiyah Joseph | 1,714 | 53.8 | 16.6 | |
Conservative | John Peach | 1,260 | 39.6 | 3.2 | |
Green | Fiona Radic | 105 | 3.3 | 6.5 | |
Liberal Democrats | Ian Hardman | 104 | 3.3 | 1.2 | |
Majority | 454 | 14.2 | — | ||
Turnout | 3,183 | — | — | ||
Labour hold | Swing | ||||
No UKIP candidate as previous (-8.7).
Party | Candidate | Votes | % | ±% | |
---|---|---|---|---|---|
Liberal Democrats | Asif Shaheed | 873 | 38.2 | 2.5 | |
Labour | Jonas Hopogap Yonga | 687 | 30.1 | 7.9 | |
Conservative | Haq Nawaz | 424 | 18.6 | 1.2 | |
UKIP | Massimo Pinto | 186 | 8.1 | 11.0 | |
Green | Joseph Wells | 114 | 5.0 | New | |
Majority | 186 | 8.1 | |||
Turnout | 2,284 | ||||
Liberal Democrats hold | Swing | ||||
Party | Candidate | Votes | % | ±% | |
---|---|---|---|---|---|
Labour | Edward Murphy | 1,285 | 45.8 | 6.5 | |
Conservative | Paul Bristow | 1,257 | 44.8 | 6.3 | |
UKIP | Mark Perry | 181 | 6.5 | 13.8 | |
Green | Goran Radic | 83 | 3.0 | New | |
Majority | 28 | 1.0 | — | ||
Turnout | 2,806 | — | — | ||
Labour hold | Swing | ||||
Party | Candidate | Votes | % | ±% | |
---|---|---|---|---|---|
Conservative | Ray Bisby | 1,080 | 59.1 | 13.6 | |
Labour | Tony Otley | 481 | 26.3 | 0.4 | |
UKIP | Lisa Ann Duffy | 92 | 5.0 | 21.2 | |
Independent | Julian Bray | 82 | 4.5 | New | |
Green | Jon Phillipson Brown | 51 | 2.8 | New | |
Liberal Democrats | Terri Haynes | 42 | 2.3 | New | |
Majority | 559 | 32.8 | |||
Turnout | 1,828 | ||||
Conservative hold | Swing | ||||
Party | Candidate | Votes | % | ±% | |
---|---|---|---|---|---|
Werrington First | Steve Lane | 1,420 | 53.2 | 10.2 | |
Conservative | Ruth Dalton | 467 | 17.5 | 2.2 | |
Liberal Democrats | Sandra Bond | 310 | 11.6 | New | |
Labour | Suzanne Marie White | 291 | 10.9 | 1.3 | |
Green | Roger Proudfoot | 102 | 3.8 | 6.4 | |
UKIP | June Kennedy | 76 | 2.9 | 16.2 | |
Majority | 953 | 35.7 | — | ||
Turnout | 2,666 | ||||
Werrington First hold | Swing | ||||
Party | Candidate | Votes | % | ±% | |
---|---|---|---|---|---|
Conservative | Gavin Elsey | 713 | 36.5 | ||
Labour | Heather Skibsted | 657 | 33.7 | ||
Liberal Democrats | Daniel Gibbs | 237 | 12.1 | ||
Green | Alex Airey | 201 | 10.3 | ||
UKIP | Graham Whitehead | 143 | 7.3 | ||
Majority | 56 | 2.8 | |||
Turnout | 1,951 | ||||
Conservative hold | Swing | ||||
The 2007 Worcester City Council election took place on 3 May 2007 to elect members of Worcester City Council in Worcestershire, England. One third of the council was up for election and the Conservative Party stayed in overall control of the council.
The 2012 police and crime commissioner elections were polls held in most police areas in England and Wales on Thursday 15 November. The direct election of police and crime commissioners (PCCs) was originally scheduled for May 2012 but was postponed in order to secure the passage of the Police Reform and Social Responsibility Act 2011 through the House of Lords. The government considers the elected commissioners to have a stronger mandate than the "unelected and invisible police authorities that they replace". The elections took place alongside by-elections for the House of Commons in Cardiff South and Penarth, Corby and Manchester Central, and a mayoral election in Bristol.
An election to Cambridgeshire County Council took place on 2 May 2013 as part of the 2013 United Kingdom local elections. 69 councillors were elected from 60 electoral divisions, which returned either one or two county councillors each by first-past-the-post voting for a four-year term of office. The electoral divisions were the same as those used at the previous election in 2009. No elections were held in Peterborough, which is a unitary authority outside the area covered by the County Council. The election saw the Conservative Party lose overall control of the council.
Elections of police and crime commissioners in England and Wales were held on 5 May 2016.
The 2016 Fareham Borough Council election took place on 5 May 2016 to elect members of Fareham Borough Council in England. This was on the same day as other local elections.
The 2017 Hampshire County Council election took place on 4 May 2017 as part of the 2017 local elections in the United Kingdom. All councillors were elected from electoral divisions by first-past-the-post voting for a four-year term of office. The electoral divisions were somewhat changed from the previous election, with some being split, merged or with boundary changes. No elections were held in Portsmouth and Southampton, which are unitary authorities and hold their elections in other years. Similarly the districts within Hampshire did also not hold elections this year.
The 2017 Surrey County Council election took place as part of the 2017 local elections in the UK. All 81 councillors were elected for single-member electoral divisions for a four-year term. The electoral system used is first-past-the-post voting.
Elections to Colchester Borough Council took place on 3 May 2018. Seventeen members of the council - one-third of the whole — were elected, one from each of the seventeen wards. It was the first standard election to take place following comprehensive boundary changes in 2016. This set of seats were last up for election in 2016, with the third-placed elected candidates being up for election in 2018.
The inaugural Cambridgeshire and Peterborough mayoral election was held on 4 May 2017 to elect the Mayor of Cambridgeshire and Peterborough. The supplementary vote system was used to elect the mayor for a four-year term of office. Subsequent elections will be held in May 2021 and every four years after.
The 2018 Calderdale Metropolitan Borough Council election took place on 3 May 2018 to elect members of Calderdale Metropolitan Borough Council in England. This was on the same day as other local elections. One councillor was elected in each ward for a four-year term so the councillors elected in 2018 last stood for election in 2014. Each ward is represented by three councillors, the election of which is staggered, so only one third of the councillors were elected in this election. Before the election there was no overall control with a minority Labour administration. Following the election Labour, having gained one councillor, was still two councillors away from a majority so it remained no overall control.
The 2018 City of Bradford Metropolitan District Council took place on 3 May 2018 to elect members of Bradford District Council in England. This was on the same day as other local elections. One councillor was elected in each ward for a four-year term so the councillors elected in 2018 last stood for election in 2014. Each ward is represented by three councillors, the election of which is staggered, so only one third of the councillors were elected in this election. Before the election there was a Labour majority and afterwards Labour had increased their majority.
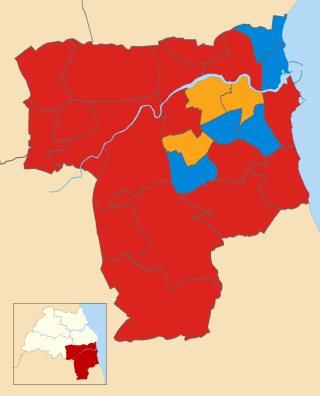
The 2018 Sunderland City Council election took place on 3 May 2018 to elect members of Sunderland City Council in England. The election took place on the same day as other local elections.
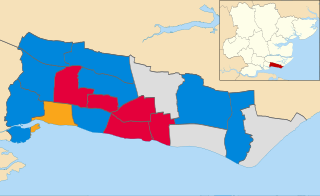
Elections to Southend-on-Sea Borough Council took place on 3 May 2018. This was on the same day as other local elections across the United Kingdom.
The 2018 Rochford District Council election took place on 3 May 2018 to elect members of Rochford District Council in England. This was on the same day as other local elections.
Elections to Southend-on-Sea Borough Council took place on 2 May 2019. This was on the same day as other local elections across the United Kingdom.
The 2019 Sunderland City Council election took place on 2 May 2019 to elect members of Sunderland City Council in England. The election took place on the same day as other local elections.
The 2018 Castle Point Borough Council election took place on 3 May 2018 to elect members of Castle Point Borough Council in England.
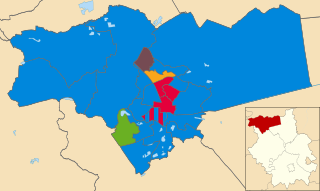
Elections to Peterborough City Council took place on 6 May 2021. 23 of the 60 seats were contested. The election was held alongside the elections for the Cambridgeshire Police and Crime Commissioner and Mayor of Cambridgeshire and Peterborough.
Elections to Peterborough City Council took place on 5 May 2022. 19 of the 60 seats were contested. The election will took place alongside other local elections across the United Kingdom.
The 2023 Peterborough City Council election took place on 4 May 2023 to elect member of Peterborough City Council in Cambridgeshire, England. There were 21 of the 60 seats on the council contested. The election took place alongside other local elections across England.