| |||||||||||||||||||||||||||||||||||||
14 out of 42 seats to Cambridge City Council 22 seats needed for a majority | |||||||||||||||||||||||||||||||||||||
---|---|---|---|---|---|---|---|---|---|---|---|---|---|---|---|---|---|---|---|---|---|---|---|---|---|---|---|---|---|---|---|---|---|---|---|---|---|
Turnout | 46.7% (4.9%) | ||||||||||||||||||||||||||||||||||||
| |||||||||||||||||||||||||||||||||||||
Winner of each seat at the 1982 Cambridge City Council election | |||||||||||||||||||||||||||||||||||||
|
The 1982 Cambridge City Council election took place on 6 May 1982 to elect members of Cambridge City Council in Cambridge, Cambridgeshire, England. [1] This was on the same day as other local elections across England.
1982 Cambridge City Council election | ||||||||||
---|---|---|---|---|---|---|---|---|---|---|
Party | This election | Full council | This election | |||||||
Seats | Net | Seats % | Other | Total | Total % | Votes | Votes % | +/− | ||
Labour | 7 | 1 | 50.0 | 13 | 20 | 47.6 | 12,286 | 33.1 | –9.7 | |
Conservative | 4 | 2 | 28.6 | 10 | 14 | 33.3 | 12,617 | 34.0 | –4.3 | |
Alliance | 3 | 2 | 21.4 | 5 | 8 | 19.0 | 12,022 | 32.4 | +14.0 | |
Independent | 0 | 1 | 0.0 | 0 | 0 | 0.0 | 148 | 0.4 | N/A | |
Workers Revolutionary | 0 | 0.0 | 0 | 0 | 0.0 | 25 | 0.1 | N/A | ||
Party | Candidate | Votes | % | ±% | |
---|---|---|---|---|---|
Labour | Carey Widdows | 1,169 | 59.2 | –12.4 | |
SDP (Alliance) | Else Meyland-Smith | 435 | 22.0 | +15.9 | |
Conservative | Sally-Anne Worland | 372 | 18.8 | –3.6 | |
Majority | 734 | 37.1 | –12.1 | ||
Turnout | 1,976 | 40.6 | +6.1 | ||
Registered electors | 4,673 | ||||
Labour hold | Swing | 14.2 | |||
Party | Candidate | Votes | % | ±% | |
---|---|---|---|---|---|
Labour | Stephen Watts | 1,058 | 39.2 | –13.4 | |
Conservative | Stephen George | 854 | 31.7 | –6.5 | |
SDP (Alliance) | Philip Laidlaw | 785 | 29.1 | +19.9 | |
Majority | 204 | 7.6 | –6.9 | ||
Turnout | 2,697 | 50.3 | +6.1 | ||
Registered electors | 5,364 | ||||
Labour hold | Swing | 3.5 | |||
Party | Candidate | Votes | % | ±% | |
---|---|---|---|---|---|
Liberal (Alliance) | Andrew Duff | 1,300 | 46.3 | +2.8 | |
Conservative | George Reid* | 1,067 | 38.0 | +1.1 | |
Labour | Richard Newbury | 440 | 15.7 | –3.9 | |
Majority | 233 | 8.3 | +1.6 | ||
Turnout | 2,807 | 48.9 | +3.7 | ||
Registered electors | 5,735 | ||||
Liberal gain from Conservative | Swing | 0.9 | |||
Party | Candidate | Votes | % | ±% | |
---|---|---|---|---|---|
Labour | Adrian Herbert | 1,123 | 38.9 | –13.7 | |
Conservative | Allen Alderson | 952 | 33.0 | –7.3 | |
SDP (Alliance) | Margaret Reiss* | 809 | 28.1 | +21.0 | |
Majority | 171 | 5.9 | –6.4 | ||
Turnout | 2,884 | 55.0 | +4.7 | ||
Registered electors | 5,248 | ||||
Labour gain from Conservative | Swing | 3.2 | |||
Party | Candidate | Votes | % | ±% | |
---|---|---|---|---|---|
Conservative | Charles Seagrave* | 1,127 | 41.3 | +1.8 | |
Labour | Eleanor Fairclough | 1,003 | 36.8 | –12.2 | |
Liberal (Alliance) | Stephen Hunter | 598 | 21.9 | +10.4 | |
Majority | 124 | 4.5 | N/A | ||
Turnout | 2,728 | 51.1 | +2.5 | ||
Registered electors | 5,337 | ||||
Conservative hold | Swing | 7.0 | |||
Party | Candidate | Votes | % | ±% | |
---|---|---|---|---|---|
Conservative | Sidney Miller* | 1,257 | 40.8 | –4.9 | |
Labour | Jonathan Hardy | 952 | 30.9 | –14.6 | |
SDP (Alliance) | Stephen Marshall | 874 | 28.3 | +19.6 | |
Majority | 305 | 9.9 | +9.7 | ||
Turnout | 3,083 | 50.5 | +5.8 | ||
Registered electors | 6,102 | ||||
Conservative hold | Swing | 4.9 | |||
Party | Candidate | Votes | % | ±% | |
---|---|---|---|---|---|
Labour | Raith Overhill | 811 | 48.0 | –22.6 | |
Liberal (Alliance) | Tristram Riley-Smith | 374 | 22.1 | +14.1 | |
Conservative | William Sale | 358 | 21.2 | –0.2 | |
Independent | Philip Geoghan* | 148 | 8.8 | N/A | |
Majority | 437 | 25.8 | –23.4 | ||
Turnout | 1,691 | 33.3 | –3.2 | ||
Registered electors | 5,084 | ||||
Labour hold | Swing | 18.4 | |||
Party | Candidate | Votes | % | ±% | |
---|---|---|---|---|---|
Liberal (Alliance) | Joye Rosenstiel | 1,092 | 47.5 | –3.3 | |
Conservative | Michael O'Hannah | 626 | 27.2 | –0.6 | |
Labour | Anthony Carter | 580 | 25.2 | +3.8 | |
Majority | 466 | 20.3 | –2.8 | ||
Turnout | 2,298 | 38.6 | +5.1 | ||
Registered electors | 5,961 | ||||
Liberal gain from Independent | Swing | 1.4 | |||
Party | Candidate | Votes | % | ±% | |
---|---|---|---|---|---|
Labour | Violet Crane | 1,028 | 36.4 | –11.5 | |
Conservative | David Bard | 937 | 33.2 | –0.4 | |
SDP (Alliance) | Terence Moore | 857 | 30.4 | +12.0 | |
Majority | 91 | 3.2 | –11.1 | ||
Turnout | 2,822 | 40.0 | +2.4 | ||
Registered electors | 7,054 | ||||
Labour hold | Swing | 5.6 | |||
Party | Candidate | Votes | % | ±% | |
---|---|---|---|---|---|
Labour | Frank Gawthrop* | 1,560 | 52.7 | –0.2 | |
SDP (Alliance) | David Pearl | 730 | 24.7 | +16.0 | |
Conservative | Matthew Butler | 671 | 22.7 | –10.4 | |
Majority | 830 | 28.0 | +8.2 | ||
Turnout | 2,691 | 51.4 | +4.9 | ||
Registered electors | 5,758 | ||||
Labour hold | Swing | 8.1 | |||
Party | Candidate | Votes | % | ±% | |
---|---|---|---|---|---|
Conservative | James Johnson* | 1,486 | 44.9 | –1.1 | |
Liberal (Alliance) | Lesbia Bradford | 1,317 | 39.8 | +5.4 | |
Labour | Richard Robinson | 507 | 15.3 | –4.3 | |
Majority | 169 | 5.1 | –6.6 | ||
Turnout | 3,310 | 56.3 | +6.2 | ||
Registered electors | 5,883 | ||||
Conservative hold | Swing | 3.3 | |||
Party | Candidate | Votes | % | ±% | |
---|---|---|---|---|---|
Labour | Terence Sweeney* | 1,189 | 45.8 | –13.5 | |
Liberal (Alliance) | Richard Folley | 1,007 | 38.8 | +25.2 | |
Conservative | Anthony Hay | 376 | 14.5 | –12.5 | |
Workers Revolutionary | Martin Booth | 25 | 1.0 | N/A | |
Majority | 182 | 7.0 | –25.3 | ||
Turnout | 2,597 | 46.4 | +10.0 | ||
Registered electors | 5,601 | ||||
Labour hold | Swing | 19.4 | |||
Party | Candidate | Votes | % | ±% | |
---|---|---|---|---|---|
Conservative | Millicent Suckling* | 1,409 | 55.6 | –0.9 | |
SDP (Alliance) | Kevin Robinson | 718 | 28.4 | +12.5 | |
Labour | Stephen Pugh | 405 | 16.0 | –11.6 | |
Majority | 691 | 27.3 | –1.7 | ||
Turnout | 2,532 | 44.1 | +5.0 | ||
Registered electors | 5,743 | ||||
Conservative hold | Swing | 6.7 | |||
Party | Candidate | Votes | % | ±% | |
---|---|---|---|---|---|
Liberal (Alliance) | Mark Hayes | 1,126 | 41.5 | +26.9 | |
Conservative | Chris Gough-Goodman* | 1,125 | 41.5 | –16.4 | |
Labour | Anil Sinha | 461 | 17.0 | –10.4 | |
Majority | 1 | 0.1 | N/A | ||
Turnout | 2,712 | 51.0 | +14.0 | ||
Registered electors | 5,314 | ||||
Liberal gain from Conservative | Swing | 21.7 | |||
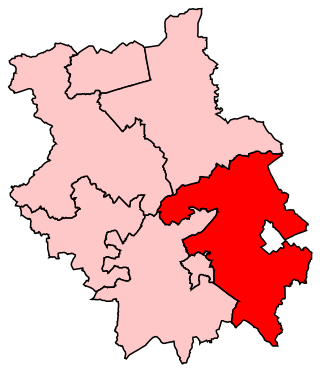
South Cambridgeshire was a constituency represented in the House of Commons of the UK Parliament since 2019 by Anthony Browne, a Conservative.
One third of Cambridge City Council is elected each year, followed by one year without election.
Cambridge City Council is the local authority for Cambridge, a non-metropolitan district with city status in Cambridgeshire, England. The council has been under Labour majority control since 2014. It meets at Cambridge Guildhall. The council is a member of the Cambridgeshire and Peterborough Combined Authority.
Elections for Cambridge City Council were held on Thursday 5 May 2011. As the council is elected by thirds, one seat in each of the wards was up for election, with the exception of Cherry Hinton ward where two seats were up for election due to the early retirement of Councillor Stuart Newbold. The vote took place alongside the 2011 United Kingdom Alternative Vote referendum and a Cambridgeshire County Council by-election for Arbury ward.
Elections for Cambridge City Council were held on Thursday 3 May 2012. One third of the council was up for election and the Liberal Democrats lost overall control of the council, to No Overall Control.
The 2014 Cambridge City Council election took place on 22 May 2014 to elect members of Cambridge City Council in England. This was on the same day as other local elections and the European Union elections.
The 1982 Westminster City Council election took place on 6 May 1982 to elect members of Westminster City Council in London, England. The whole council was up for election and the Conservative Party stayed in overall control of the council.
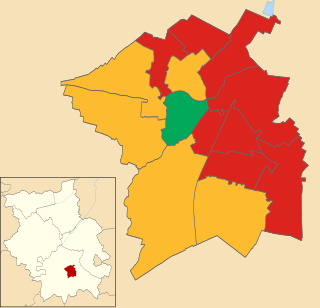
The 2015 Cambridge City Council election took place on 7 May 2015 to elect members of Cambridge City Council in England as part of the English local elections of that year coinciding with the 2015 General Election.
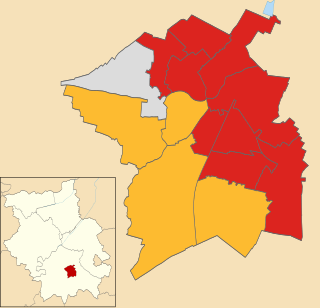
The 2016 Cambridge City Council election took place on 5 May 2016 to elect members of Cambridge City Council in England. This was on the same day as other nationwide local elections. The Labour Party grouping gained two seats from the Liberal Democrats, increasing their majority on the council from 6 to 10 seats.
Elections to Cambridge City Council were held on 6 May 2010 as part of the wider local elections across England.
The 2018 Cambridge City Council election took place on 3 May 2018 to elect members of Cambridge City Council in England. This was on the same day as other nationwide local elections.
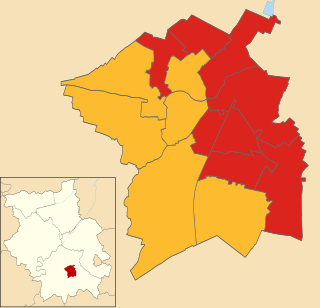
The 2019 Cambridge City Council election took place on 2 May 2019 to elect members of Cambridge City Council in England. It took place on the same day as other nationwide local elections.
The 1982 Derby City Council election took place on 6 May 1982 to elect members of Derby City Council in England. This was on the same day as other local elections. 15 of the council's 44 seats were up for election. The Labour Party retained control of the council.
The 2021 Cambridge City Council election took place on 6 May 2021 to elect members of Cambridge City Council in England. This was on the same day as other nationwide local elections.
The 1982 Gloucester City Council election took place on 5 May 1982 to elect members of Gloucester City Council in England.
The 2002 Cambridge City Council election took place on 2 May 2002 to elect members of Cambridge City Council in England. This was on the same day as other nationwide local elections.
The 2003 Cambridge City Council election took place on 1 May 2003 to elect members of Cambridge City Council in England. This was on the same day as other nationwide local elections.
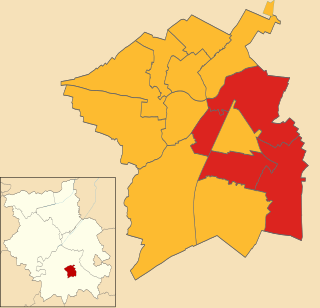
The 2007 Cambridge City Council election took place on 3 May 2007 to elect members of Cambridge City Council in England. This was on the same day as other nationwide local elections.
The 2008 Cambridge City Council election took place on 1 May 2008 to elect members of Cambridge City Council in England. This was on the same day as other nationwide local elections.