1998 Cambridge City Council election

Last updated
1998 Cambridge City Council election
Cambridgeshire Flag.svg
  1996 7 May 1998 (1998-05-07) 1999  

14 out of 42 seats to Cambridge City Council
22 seats needed for a majority
Turnout27.8% (Decrease2.svg8.1%)
 First partySecond partyThird party
  No image wide.svg No image wide.svg No image wide.svg
Party Labour Liberal Democrats Conservative
Last election21 seats, 45.0%17 seats, 35.2%4 seats, 19.8%
Seats won572
Seats after19176
Seat changeDecrease2.svg 2Increase2.svg 1Increase2.svg 2
Popular vote8,5729,3355,223
Percentage36.1%39.3%22.0%
SwingDecrease2.svg 8.9%Increase2.svg 4.1%Increase2.svg 2.2%

Cambridge UK ward map 1998.svg
Winner of each seat at the 1998 Cambridge City Council election

Council control before election


No overall control

Council control after election


No overall control

The 1998 Cambridge City Council election took place on 7 May 1998 to elect members of Cambridge City Council in Cambridge, Cambridgeshire, England. [1] This was on the same day as other local elections across England.

Contents

Prior to the election, Cllr Alan Charlesworth (Castle) left the Liberal Democrats to sit as an Independent.

Summary

Election result

1998 Cambridge City Council election
PartyThis electionFull councilThis election
SeatsNetSeats %OtherTotalTotal %VotesVotes %+/−
  Labour 5Decrease2.svg 235.7141945.28,57236.1–8.9
  Liberal Democrats 7Increase2.svg 150.0101740.59,33539.3+4.1
  Conservative 2Increase2.svg 214.34614.35,22322.0+2.2
  Green 0Steady2.svg0.0000.06162.6N/A

In addition to the gains/losses above, one Independent lost a seat but is not shown as no Independent candidates stood at this election.

Ward result

Abbey

Abbey
PartyCandidateVotes%±%
Labour Mungai Mbayah 578 65.0 –6.5
Conservative Ann Watkins16318.3+2.1
Liberal Democrats Catherine Stebbings14816.6+4.4
Majority41546.7–8.6
Turnout 88919.0–6.4
Registered electors 4,668
Labour hold Swing Decrease2.svg4.3

Arbury

Arbury
PartyCandidateVotes%±%
Labour Anthony Schofield* 676 53.2 –1.7
Conservative Mark Taylor39531.1–3.5
Liberal Democrats Rhordi James19915.7+5.1
Majority28122.1+1.8
Turnout 1,27025.2–11.6
Registered electors 5,057
Labour hold Swing Increase2.svg0.9

Castle

Castle
PartyCandidateVotes%±%
Liberal Democrats David White 1,172 60.4 +4.6
Labour Stephen Hartley36518.8–8.1
Conservative Richard Hollie29315.1–2.2
Green Marion Barber1125.8N/A
Majority80741.6–12.7
Turnout 1,94227.7–8.4
Registered electors 7,036
Liberal Democrats gain from Independent Swing Increase2.svg6.4

Cherry Hinton

Cherry Hinton
PartyCandidateVotes%±%
Conservative Graham Stuart 893 46.6 +19.0
Labour Richard Carling86245.0–10.4
Liberal Democrats Ashley Woodford1618.4–8.6
Majority311.6N/A
Turnout 1,91634.7+1.8
Registered electors 5,525
Conservative gain from Labour Swing Increase2.svg14.7

Coleridge

Coleridge
PartyCandidateVotes%±%
Labour Ruth Bagnall 873 61.7 –0.4
Conservative Eric Barrett-Payton36325.6+0.4
Liberal Democrats Richard Folley18012.7–0.1
Majority51036.0–0.9
Turnout 1,41623.8–9.5
Registered electors 5,966
Labour hold Swing Decrease2.svg0.4

East Chesterton

East Chesterton
PartyCandidateVotes%±%
Liberal Democrats Fiona Levison 971 44.2 +0.1
Labour Tricia Charlesworth90341.1–2.2
Conservative Colin Havercroft32414.7+2.0
Majority683.1+2.3
Turnout 2,19832.1–9.4
Registered electors 6,867
Liberal Democrats hold Swing Increase2.svg1.2

Kings Hedges

Kings Hedges
PartyCandidateVotes%±%
Labour Michael Talbot 613 65.1 –11.9
Conservative Christopher Howell17718.8+5.2
Liberal Democrats Tim Wesson15116.0+6.6
Majority43646.3–17.1
Turnout 94119.8–9.7
Registered electors 4,774
Labour hold Swing Decrease2.svg8.6

Market

Market
PartyCandidateVotes%±%
Liberal Democrats Joye Rosenstiel* 837 60.5 +4.6
Labour Andrew Jones28820.8–12.8
Conservative Julie-Ann Ing15411.1+0.7
Green Adam Swallow1057.6N/A
Majority54939.7+17.4
Turnout 1,38421.1–11.5
Registered electors 6,595
Liberal Democrats hold Swing Increase2.svg8.7

Newnham

Newnham
PartyCandidateVotes%±%
Liberal Democrats Christopher Larkin* 1,041 59.2 +15.1
Labour Trevor Critchlow47326.9–18.4
Conservative James Strachan24313.8+3.2
Majority56832.3+31.1
Turnout 1,75722.3–13.0
Registered electors 7,929
Liberal Democrats hold Swing Increase2.svg16.8

Petersfield

Petersfield
PartyCandidateVotes%±%
Labour Kevin Blencowe* 865 55.1 –7.3
Liberal Democrats Stephen Smith26216.7–8.4
Green Shayne Mitchell24815.8N/A
Conservative Peter Welton19612.5–0.1
Majority60338.4+1.1
Turnout 1,57121.9–11.7
Registered electors 7,181
Labour hold Swing Increase2.svg0.6

Queens Edith

Queens Edith
PartyCandidateVotes%±%
Liberal Democrats Amanda Taylor* 1,394 54.8 +17.7
Conservative Richard Williams80231.5–6.2
Labour Kira Davison34913.7–11.5
Majority59223.3N/A
Turnout 2,54541.7–8.9
Registered electors 6,107
Liberal Democrats hold Swing Increase2.svg12.0

Romsey

Romsey
PartyCandidateVotes%±%
Liberal Democrats Catherine Smart 1,027 48.8 +9.4
Labour Paul Gilchrist88742.1–13.4
Green Hamish Downer1145.4N/A
Conservative Peter Whitehead773.7–1.4
Majority1406.7N/A
Turnout 2,10533.9–1.6
Registered electors 6,107
Liberal Democrats gain from Labour Swing Increase2.svg11.4

Trumpington

Trumpington
PartyCandidateVotes%±%
Conservative Donald Douglas 910 45.0 +7.1
Liberal Democrats Michael Dixon81940.5–0.7
Labour Patrick Diamond29414.5–6.3
Majority914.5N/A
Turnout 2,02334.7–0.1
Registered electors 5,837
Conservative gain from Liberal Democrats Swing Increase2.svg3.9

West Chesterton

West Chesterton
PartyCandidateVotes%±%
Liberal Democrats Ian Nimmo-Smith* 973 51.4 –1.7
Labour Patrick Schicker54628.8–4.0
Conservative Vivian Ellis23312.3–1.7
Green Margaret Wright 1427.5N/A
Majority42722.5+2.2
Turnout 1,89431.3–7.5
Registered electors 6,064
Liberal Democrats hold Swing Increase2.svg1.2

Related Research Articles

<span class="mw-page-title-main">South Cambridgeshire</span> Non-metropolitan district in England

South Cambridgeshire is a local government district of Cambridgeshire, England, with a population of 162,119 at the 2021 census. It was formed on 1 April 1974 by the merger of Chesterton Rural District and South Cambridgeshire Rural District. It completely surrounds the city of Cambridge, which is administered separately from the district by Cambridge City Council.

<span class="mw-page-title-main">Preston City Council elections</span>

Preston City Council elections are generally held three years out of every four, with a third of the council elected each time. Preston City Council is the local authority for the non-metropolitan district of Preston in Lancashire, England. Since the last boundary changes in 2019, 48 councillors have been elected from 16 wards.

<span class="mw-page-title-main">Colchester City Council elections</span>

One third of Colchester City Council in Essex, England is elected each year, followed by one year without election. Since the last boundary changes at the 2016 election, 51 councillors have been elected from 17 wards.

<span class="mw-page-title-main">Peterborough City Council</span> Local authority in England

Peterborough City Council is the local authority for Peterborough in the East of England. It is a unitary authority, having the powers of a non-metropolitan county and district council combined. The City was incorporated as a municipal borough in 1874; from 1888, it fell within the jurisdiction of the Soke of Peterborough county council and from 1965, Huntingdon and Peterborough county council. In 1974, it was replaced by a wholly new non-metropolitan district, broadly corresponding to the Soke, in the new enlarged Cambridgeshire. In 1998, Peterborough became independent of Cambridgeshire as a unitary authority, but the city continues to form part of that county for ceremonial purposes as defined by the Lieutenancies Act 1997.

<span class="mw-page-title-main">Cambridge City Council</span> District council in the county of Cambridgeshire, England

Cambridge City Council is the local authority for the city of Cambridge, a non-metropolitan district with city status in Cambridgeshire, England.

<span class="mw-page-title-main">Cambridgeshire County Council</span> The elected administrative body governing Cambridgeshire, England

Cambridgeshire County Council is the county council of Cambridgeshire, England. The council consists of 61 councillors, representing 59 electoral divisions. The council is based at New Shire Hall in Alconbury Weald, near Huntingdon. It is part of the East of England Local Government Association and a constituent member of the Cambridgeshire and Peterborough Combined Authority.

<span class="mw-page-title-main">Nottinghamshire County Council</span> The upper-tier local authority for the non-metropolitan county of Nottinghamshire in England

Nottinghamshire County Council is the upper-tier local authority for the non-metropolitan county of Nottinghamshire in England. It consists of 66 county councillors, elected from 56 electoral divisions every four years. The most recent election was held in 2021.

<span class="mw-page-title-main">1998 City of Lincoln Council election</span>

The 1998 City of Lincoln Council election took place on 7 May 1998 to elect members of Lincoln District Council in Lincolnshire, England. One third of the council was up for election and the Labour party stayed in overall control of the Council.

The 1998 Hull City Council election took place on 7 May 1998 to elect members of Hull City Council in England. One third of the council was up for election and the Labour Party kept overall control of the council.

<span class="mw-page-title-main">1999 St Albans City and District Council election</span>

The 1999 St Albans City and District Council election took place on 6 May 1999 to elect members of St Albans City and District Council in Hertfordshire, England. The whole council was up for election with boundary changes since the last election in 1998 increasing the number of seats by 1. The Liberal Democrats lost overall control of the council to no overall control.

The 1998 Worcester City Council election took place on 7 May 1998 to elect members of Worcester City Council in Worcestershire, England. One third of the council was up for election and the Labour Party stayed in overall control of the council.

The 2000 Worcester City Council election took place on 4 May 2000 to elect members of Worcester City Council in Worcestershire, England. One third of the council was up for election and the Labour Party lost overall control of the council to no overall control.

The 1998 Carlisle City Council election took place on 7 May 1998 to elect members of Carlisle District Council in Cumbria, England. One third of the council was up for election and the Labour Party stayed in overall control of the council.

<span class="mw-page-title-main">2012 Cambridge City Council election</span>

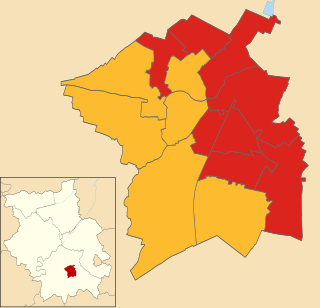
Elections for Cambridge City Council were held on Thursday 3 May 2012. One third of the council was up for election and the Liberal Democrats lost overall control of the council, to No Overall Control.

<span class="mw-page-title-main">Southend-on-Sea City Council</span> Local authority of Southend-on-Sea, Essex, England

Southend-on-Sea City Council is the local authority of the Southend-on-Sea district in Essex, England. It is a unitary authority, having the powers of a non-metropolitan county and district council combined. It is a member of the East of England Local Government Association. It is based at Southend Civic Centre in Southend-on-Sea.

The 2014 Cambridge City Council election took place on 22 May 2014 to elect members of Cambridge City Council in England. This was on the same day as other local elections and the European Union elections.

The 1973 Nottinghamshire County Council election was held on Thursday, 12 April 1973. The election resulted in the Labour Party winning an overall majority of seats on the council.

The 2019 Cambridge City Council election took place on 2 May 2019 to elect members of Cambridge City Council in England. It took place on the same day as other nationwide local elections.

<span class="mw-page-title-main">2021 Cambridgeshire County Council election</span>

The 2021 Cambridgeshire County Council election took place on 6 May 2021 as part of the 2021 local elections in the United Kingdom. All 61 councillors were elected from 59 electoral divisions, which returned either one or two county councillors each by first-past-the-post voting for a four-year term of office. The election was held alongside a full election for Cambridge City Council, the Cambridgeshire Police and Crime Commissioner, Mayor of Cambridgeshire and Peterborough and one-third of Peterborough City Council.

The 2003 Cambridge City Council election took place on 1 May 2003 to elect members of Cambridge City Council in England. This was on the same day as other nationwide local elections.

References

  1. "Cambridge City Council Election Results 1973-2012" (PDF). Colin Rallings and Michael Thrasher. The Elections Centre, Plymouth University . Retrieved 18 September 2023.