| |||||||||||||||||||||||||
All 42 seats to Cambridge City Council 22 seats needed for a majority | |||||||||||||||||||||||||
---|---|---|---|---|---|---|---|---|---|---|---|---|---|---|---|---|---|---|---|---|---|---|---|---|---|
Turnout | 42.3% | ||||||||||||||||||||||||
| |||||||||||||||||||||||||
|
The 1976 Cambridge City Council election took place on 6 May 1976 to elect members of Cambridge City Council in Cambridge, Cambridgeshire, England. [1] This was on the same day as other local elections across England.
The whole council was up for election on new ward boundaries, with fourteen 3-seat wards being contested at this election. Labour lost control of the council to the Conservatives.
1976 Cambridge City Council election | ||||||||||
---|---|---|---|---|---|---|---|---|---|---|
Party | Candidates | Seats | Gains | Losses | Net gain/loss | Seats % | Votes % | Votes | +/− | |
Conservative | 36 | 24 | N/A | N/A | 13 | 57.1 | 50.2 | 42,350 | ||
Labour | 38 | 16 | N/A | N/A | 10 | 38.1 | 39.2 | 33,020 | ||
Liberal | 15 | 2 | N/A | N/A | 3 | 4.8 | 9.1 | 7,646 | ||
Independent Liberal | 1 | 0 | N/A | N/A | 0.0 | 0.6 | 520 | |||
Ind. Labour Party | 1 | 0 | N/A | N/A | 0.0 | 0.5 | 460 | |||
Communist | 1 | 0 | N/A | N/A | 0.0 | 0.4 | 306 |
Party | Candidate | Votes | % | ||
---|---|---|---|---|---|
Labour | P. Warren | 763 | 54.3 | ||
Labour | D. Howe | 671 | 47.8 | ||
Labour | A. Molt | 627 | 44.6 | ||
Conservative | E. Jones | 530 | 37.7 | ||
Independent | P. Allen | 168 | 12.0 | ||
Turnout | 1,405 | 31.6 | |||
Registered electors | 4,446 | ||||
Labour win (new seat) | |||||
Labour win (new seat) |
Party | Candidate | Votes | % | ||
---|---|---|---|---|---|
Labour | E. Gard | 1,160 | 47.3 | ||
Labour | M. Rooney | 1,127 | 45.9 | ||
Labour | A. Pettifor | 1,118 | 45.6 | ||
Conservative | O. Green | 1,093 | 44.6 | ||
Conservative | S. Tyrrell | 1,089 | 44.4 | ||
Conservative | J. Newman | 1,084 | 44.2 | ||
Turnout | 2,453 | 45.4 | |||
Registered electors | 5,402 | ||||
Labour win (new seat) | |||||
Labour win (new seat) |
Party | Candidate | Votes | % | ||
---|---|---|---|---|---|
Conservative | N. Auker | 1,550 | 58.0 | ||
Conservative | J. Powley | 1,487 | 55.7 | ||
Conservative | G. Reid | 1,449 | 54.2 | ||
Labour | M. Mackie | 1,000 | 37.4 | ||
Labour | M. Wilson | 987 | 37.0 | ||
Labour | J. Schicker | 976 | 36.5 | ||
Turnout | 2,671 | 44.8 | |||
Registered electors | 5,962 | ||||
Conservative win (new seat) | |||||
Conservative win (new seat) |
Party | Candidate | Votes | % | ||
---|---|---|---|---|---|
Conservative | J. Phillips | 1,192 | 51.4 | ||
Conservative | J. West | 1,086 | 46.8 | ||
Conservative | G. Coteman | 1,017 | 43.8 | ||
Labour | P. Holmes | 965 | 41.6 | ||
Labour | J. Hughes | 932 | 40.2 | ||
Labour | S. Dartford | 889 | 38.3 | ||
Turnout | 2,321 | 45.7 | |||
Registered electors | 5,078 | ||||
Conservative win (new seat) | |||||
Conservative win (new seat) |
Party | Candidate | Votes | % | ||
---|---|---|---|---|---|
Conservative | D. Mackay | 1,067 | 44.3 | ||
Conservative | F. Burling | 1,044 | 43.3 | ||
Conservative | D. Anderson | 996 | 41.3 | ||
Labour | H. Percival | 905 | 37.6 | ||
Labour | J. Curley | 819 | 34.0 | ||
Labour | O. Nicol | 808 | 33.5 | ||
Liberal | A. Hill | 329 | 13.7 | ||
Liberal | L. Edkins | 288 | 12.0 | ||
Liberal | C. Townsend | 269 | 11.2 | ||
Turnout | 2,410 | 47.3 | |||
Registered electors | 5,096 | ||||
Conservative win (new seat) | |||||
Conservative win (new seat) |
Party | Candidate | Votes | % | ||
---|---|---|---|---|---|
Conservative | G. Knowles | 1,342 | 55.0 | ||
Conservative | S. Reid | 1,323 | 54.2 | ||
Conservative | S. Miller | 1,279 | 52.4 | ||
Labour | R. Overhill | 964 | 39.5 | ||
Labour | L. Freeman | 960 | 39.3 | ||
Labour | A. Carter | 904 | 37.0 | ||
Turnout | 2,441 | 39.3 | |||
Registered electors | 6,210 | ||||
Conservative win (new seat) | |||||
Conservative win (new seat) |
Party | Candidate | Votes | % | ||
---|---|---|---|---|---|
Labour | P. Cowell | 772 | 41.5 | ||
Labour | C. Kaldor | 688 | 37.0 | ||
Labour | P. Geoghan | 627 | 33.7 | ||
Conservative | D. Parmenter | 580 | 31.2 | ||
Turnout | 1,859 | 47.4 | |||
Registered electors | 3,922 | ||||
Labour win (new seat) | |||||
Labour win (new seat) |
Party | Candidate | Votes | % | ||
---|---|---|---|---|---|
Liberal | C. Rosenstiel | 839 | 35.3 | ||
Liberal | L. Hawes | 807 | 33.9 | ||
Conservative | G. Edwards | 790 | 33.2 | ||
Conservative | M. O'Hannan | 783 | 32.9 | ||
Conservative | K. Price | 776 | 32.6 | ||
Liberal | B. Greaves | 764 | 32.1 | ||
Labour | D. Bleiman | 725 | 30.5 | ||
Independent Liberal | S. Foott | 520 | 21.9 | ||
Communist | P. Berry | 306 | 12.9 | ||
Turnout | 2,379 | 38.7 | |||
Registered electors | 6,148 | ||||
Liberal win (new seat) | |||||
Conservative win (new seat) |
Party | Candidate | Votes | % | ||
---|---|---|---|---|---|
Labour | G. Lipstein | 1,306 | 43.4 | ||
Labour | R. Cohen | 1,221 | 40.6 | ||
Labour | R. Edwards | 1,218 | 40.5 | ||
Conservative | B. Cooper | 1,172 | 38.9 | ||
Conservative | J. Shaw | 1,110 | 36.9 | ||
Conservative | P. Robinson | 1,106 | 36.7 | ||
Liberal | A. Gore | 598 | 19.9 | ||
Liberal | J. Cummins | 590 | 19.6 | ||
Liberal | D. Grace | 550 | 18.3 | ||
Turnout | 3,011 | 44.8 | |||
Registered electors | 6,720 | ||||
Labour win (new seat) | |||||
Labour win (new seat) |
Party | Candidate | Votes | % | ||
---|---|---|---|---|---|
Conservative | E. Seargeant | 1,018 | 44.6 | ||
Labour | R. Thornely | 1,013 | 44.4 | ||
Conservative | E. Wheatley | 966 | 42.4 | ||
Labour | D. Mackie | 961 | 42.1 | ||
Conservative | B. Wright | 948 | 41.6 | ||
Labour | S. Trotman | 936 | 41.1 | ||
Ind. Labour Party | R. Beveridge | 460 | 20.2 | ||
Turnout | 2,280 | 37.9 | |||
Registered electors | 6,016 | ||||
Conservative win (new seat) | |||||
Labour win (new seat) | |||||
Conservative win (new seat) |
Party | Candidate | Votes | % | ||
---|---|---|---|---|---|
Conservative | E. Hodder | 1,677 | 58.9 | ||
Conservative | S. Dolby | 1,577 | 55.4 | ||
Conservative | J. Johnson | 1,568 | 55.1 | ||
Labour | P. Harper | 620 | 21.8 | ||
Labour | G. Rowling | 619 | 21.7 | ||
Labour | E. Shepherd | 615 | 21.6 | ||
Liberal | J. Fitch | 597 | 21.0 | ||
Liberal | A. Corsellis | 441 | 15.5 | ||
Liberal | S. Weeds | 380 | 13.3 | ||
Turnout | 2,847 | 46.9 | |||
Registered electors | 6,071 | ||||
Conservative win (new seat) | |||||
Conservative win (new seat) |
Party | Candidate | Votes | % | ||
---|---|---|---|---|---|
Labour | P. Wright | 971 | 47.2 | ||
Labour | R. May | 879 | 42.7 | ||
Labour | T. Sweeney | 860 | 41.8 | ||
Conservative | C. Barker | 707 | 34.4 | ||
Liberal | A. Charlesworth | 469 | 22.8 | ||
Liberal | J. Steward | 369 | 17.9 | ||
Liberal | J. Minton | 356 | 17.3 | ||
Turnout | 2,058 | 36.2 | |||
Registered electors | 5,686 | ||||
Labour win (new seat) | |||||
Labour win (new seat) |
Party | Candidate | Votes | % | ||
---|---|---|---|---|---|
Conservative | R. Wright | 1,511 | 73.4 | ||
Conservative | B. Harrison | 1,453 | 70.6 | ||
Conservative | M. Suckling | 1,447 | 70.3 | ||
Labour | S. Richer | 737 | 35.8 | ||
Turnout | 2,505 | 44.2 | |||
Registered electors | 5,667 | ||||
Conservative win (new seat) | |||||
Conservative win (new seat) |
Party | Candidate | Votes | % | ||
---|---|---|---|---|---|
Conservative | M. Garner | 1,578 | 71.2 | ||
Conservative | P. Reed | 1,494 | 67.4 | ||
Conservative | C. Gough-Goodman | 1,461 | 65.9 | ||
Labour | J. Hunt | 596 | 26.9 | ||
Labour | H. Nightingale | 562 | 25.4 | ||
Labour | A. Lehmann | 519 | 23.4 | ||
Turnout | 2,216 | 41.6 | |||
Registered electors | 5,327 | ||||
Conservative win (new seat) | |||||
Conservative win (new seat) |
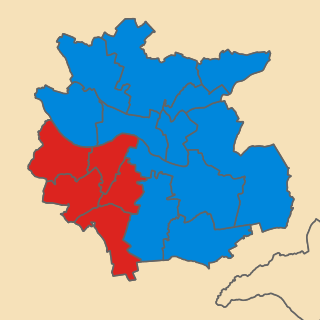
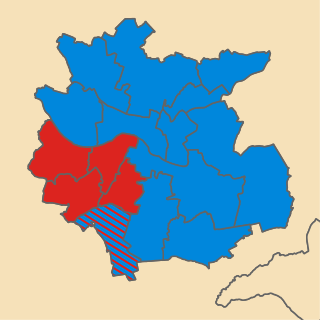
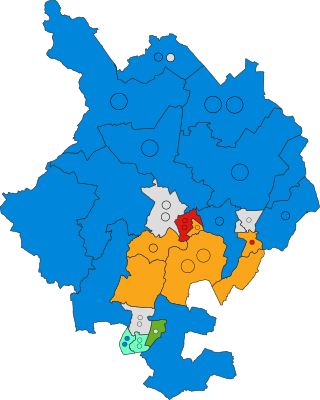
South Cambridgeshire is a constituency represented in the House of Commons of the UK Parliament since 2019 by Anthony Browne, a Conservative.
Preston City Council elections are generally held three years out of every four, with a third of the council elected each time. Preston City Council is the local authority for the non-metropolitan district of Preston in Lancashire, England. Since the last boundary changes in 2019, 48 councillors have been elected from 16 wards.
Southampton City Council elections are held three out of every four years to elect members of Southampton City Council, the local authority for the city of Southampton in Hampshire, England. Since 1 April 1997 Southampton has been a unitary authority responsible for all local government functions; prior to this it was a non-metropolitan district beneath Hampshire County Council.
Portsmouth City Council is the local authority for the unitary authority of Portsmouth in Hampshire, England. Until 1 April 1997 it was a non-metropolitan district.
One third of Cambridge City Council is elected each year, followed by one year without election.
Chelmsford City Council in Essex, England is elected every four years. Since the last boundary changes in 2003 the council has comprised 57 councillors elected from 24 wards.
Cambridge City Council is the local authority for the city of Cambridge, a non-metropolitan district with city status in Cambridgeshire, England.
Local elections were held in the United Kingdom on 6 May 1976. Elections were for one third of the seats on Metropolitan borough councils and for all seats on Non-Metropolitan district councils in England; and for all seats on the Welsh district councils.
Milton Keynes City Council is the local authority for the City of Milton Keynes, a unitary authority in Buckinghamshire, England. Until 1 April 1997 it was a non-metropolitan district.
Elections for Cambridge City Council were held on Thursday 5 May 2011. As the council is elected by thirds, one seat in each of the wards was up for election, with the exception of Cherry Hinton ward where two seats were up for election due to the early retirement of Councillor Stuart Newbold. The vote took place alongside the 2011 United Kingdom Alternative Vote referendum and a Cambridgeshire County Council by-election for Arbury ward.
Stoke-on-Trent City Council elections are held every four years. Stoke-on-Trent City Council is the local authority for the unitary authority of Stoke-on-Trent in the ceremonial county of Staffordshire, England. Since the last boundary changes in 2011, 44 councillors have been elected from 37 wards. New ward boundaries have been prepared to come into effect from the 2023 election.
Gloucester City Council is the local authority for the non-metropolitan district of Gloucester, in Gloucestershire, England.
Rochester-upon-Medway was a non-metropolitan district in Kent, England. It was abolished on 1 April 1998 and replaced by Medway.
Peterborough is a unitary authority in Cambridgeshire, England. Until 1 April 1998 it was a non-metropolitan district.
Nottingham City Council elections are held every four years. Nottingham City Council is the local authority for the unitary authority of Nottingham in Nottinghamshire, England. Until 1 April 1998 it was a non-metropolitan district. Since the last boundary changes in 2019, 55 councillors are elected from 20 wards.
The 1976 Plymouth City Council election took place on 6 May 1976 to elect members of Plymouth City Council in England. This was on the same day as other local elections. Voting took place across 22 wards, each electing 3 Councillors. The Conservative Party retained control of the Council after winning a majority of seats.
The 1976 Derby Borough Council election took place on 6 May 1976 to elect members of Derby Borough Council in England. This was on the same day as other local elections. Voting took place across 18 wards, each electing 3 Councillors. The Conservative Party gained control of the council from the Labour Party.
The 1978 Bath City Council election was held on Thursday 4 May 1978 to elect councillors to Bath City Council in England. It took place on the same day as other district council elections in the United Kingdom. One third of seats were up for election.
The 1976 Bath City Council election was held on Thursday 6 May 1976 to elect councillors to Bath City Council in England. It took place on the same day as other district council elections in the United Kingdom. The entire council was up for election. Following boundary changes the number of wards was increased by one, and the number of seats increased from 45 to 48. This was the second election to the district council, the election saw terms of councillors extended from three to four years. Subsequent elections for the council would be elected by thirds following the passing a resolution under section 7 (4) (b) of the Local Government Act 1972.
The 2022 Huntingdonshire District Council election was held on 5 May 2022 to elect members of Huntingdonshire District Council in England. This was on the same day as other local elections.