This article needs additional citations for verification .(April 2016) |
![]() | |||||||||||||||||||||
| |||||||||||||||||||||
All 84 seats to Bristol City Council 43 seats needed for a majority | |||||||||||||||||||||
---|---|---|---|---|---|---|---|---|---|---|---|---|---|---|---|---|---|---|---|---|---|
| |||||||||||||||||||||
|
The 1976 Bristol City Council election took place on 6 May 1976 to elect members of Bristol City Council in England. [1] This was on the same day as other local elections. Labour retained overall control of the council despite losing 9 seats to the Conservatives.
Party | Candidate | Votes | % | ±% | |
---|---|---|---|---|---|
Labour | V Pople | 3,031 | |||
Labour | A Crowley | 2,911 | |||
Labour | T Thomas | 2,744 | |||
Conservative | R Chubb | 1,930 | |||
Conservative | J Henley | 1,632 | |||
Conservative | V Bath | 1,558 | |||
Communist | D Pratt | 315 | |||
Majority | |||||
Labour hold | Swing | {{{swing}}} | |||
Labour hold | Swing | {{{swing}}} |
Party | Candidate | Votes | % | ±% | |
---|---|---|---|---|---|
Labour | A Hillman | 1,725 | |||
Labour | J Wood | 1,571 | |||
Labour | W Jenkins | 1,549 | |||
Conservative | C Hagen | 1,161 | |||
Conservative | L Vann | 1,113 | |||
Conservative | V Goodland | 1,107 | |||
Liberal | R Turner | 434 | |||
National Front | R Bale | 184 | |||
Majority | |||||
Labour hold | Swing | {{{swing}}} | |||
Labour hold | Swing | {{{swing}}} |
Party | Candidate | Votes | % | ±% | |
---|---|---|---|---|---|
Conservative | D Topham | 2,214 | |||
Conservative | T Clarke | 2,100 | |||
Conservative | M Withers | 2,078 | |||
Labour | E Boney | 1,012 | |||
Labour | M Shotter | 982 | |||
Labour | J Wood | 961 | |||
Liberal | K Tucker | 684 | |||
Liberal | J McMahon | 656 | |||
Majority | |||||
Conservative hold | Swing | {{{swing}}} | |||
Conservative hold | Swing | {{{swing}}} |
Party | Candidate | Votes | % | ±% | |
---|---|---|---|---|---|
Labour | L Smith | 2,364 | |||
Labour | A Munroe | 2,180 | |||
Labour | B B Richards | 2,121 | |||
Conservative | B D Richards | 1,127 | |||
Conservative | H Jones | 976 | |||
Conservative | P Paternoster | 911 | |||
Liberal | J Fletcher | 475 | |||
Liberal | P Ellis | 429 | |||
Liberal | P Bentley | 394 | |||
National Front | K Elliott | 287 | |||
Majority | |||||
Labour hold | Swing | {{{swing}}} | |||
Labour hold | Swing | {{{swing}}} |
Party | Candidate | Votes | % | ±% | |
---|---|---|---|---|---|
Labour | K Legg | 2,320 | |||
Labour | R Flinn | 2,238 | |||
Conservative | O Patterson | 2,234 | |||
Labour | H Skeates | 2,190 | |||
Conservative | O Scantlebury | 2,165 | |||
Conservative | R Frankham | 2,049 | |||
Majority | |||||
Labour hold | Swing | {{{swing}}} | |||
Conservative gain from Labour | Swing | {{{swing}}} |
Party | Candidate | Votes | % | ±% | |
---|---|---|---|---|---|
Liberal | G Ferguson | 1,353 | |||
Liberal | W Watts-Miller | 1,331 | |||
Liberal | G Beedell | 1,326 | |||
Conservative | P Muir | 1,134 | |||
Conservative | B Weedall | 1,092 | |||
Conservative | J Yarwood | 1,066 | |||
Labour | P McLaren | 750 | |||
Labour | J King | 737 | |||
Labour | L Aldridge | 705 | |||
Majority | |||||
Liberal hold | Swing | {{{swing}}} | |||
Liberal hold | Swing | {{{swing}}} |
Party | Candidate | Votes | % | ±% | |
---|---|---|---|---|---|
Conservative | J Lloyd-Kirk | 2,324 | |||
Conservative | H Lawson | 2,273 | |||
Conservative | W Blackmore | 2,242 | |||
Labour | M Hodkinson | 1,094 | |||
Labour | G Micklewright | 1,083 | |||
Labour | M Thomas | 1,033 | |||
Liberal | S Mercer | 990 | |||
Liberal | E Dunning | 973 | |||
Liberal | M Perkins | 972 | |||
Majority | |||||
Conservative hold | Swing | {{{swing}}} | |||
Conservative hold | Swing | {{{swing}}} |
Party | Candidate | Votes | % | ±% | |
---|---|---|---|---|---|
Conservative | F Apperley | 1,612 | |||
Conservative | R Trench | 1,601 | |||
Conservative | J Bosdet | 1,525 | |||
Labour | K Bassett | 1,223 | |||
Labour | T Morgan | 1,133 | |||
Labour | M Wood | 1,061 | |||
Liberal | C Bolton | 848 | |||
Liberal | J Sansom | 729 | |||
Liberal | N Rigby | 721 | |||
Majority | |||||
Conservative hold | Swing | {{{swing}}} | |||
Conservative hold | Swing | {{{swing}}} |
Party | Candidate | Votes | % | ±% | |
---|---|---|---|---|---|
Conservative | G Palmer | 4,061 | |||
Conservative | M Veale | 3,880 | |||
Conservative | G Browne | 3,869 | |||
Labour | B Begley | 962 | |||
Labour | R Ritchie | 884 | |||
Labour | J Donovan | 882 | |||
Majority | |||||
Conservative hold | Swing | {{{swing}}} | |||
Conservative hold | Swing | {{{swing}}} |
Party | Candidate | Votes | % | ±% | |
---|---|---|---|---|---|
Labour | J Jones | 1,358 | |||
Labour | G Maggs | 1,134 | |||
Labour | R Morris | 1,050 | |||
Conservative | P Haines | 495 | |||
Conservative | J Gamlin | 463 | |||
Conservative | F Wookey | 418 | |||
Communist | N Carey | 131 | |||
Majority | |||||
Labour hold | Swing | {{{swing}}} | |||
Labour hold | Swing | {{{swing}}} |
Party | Candidate | Votes | % | ±% | |
---|---|---|---|---|---|
Labour | W Williams | 1,833 | |||
Labour | E Fothergill | 1,722 | |||
Labour | B Ross | 1,652 | |||
Conservative | R Wookey | 1,455 | |||
Conservative | G Woodhouse | 1,404 | |||
Conservative | J Fletcher | 1,280 | |||
Independent Liberal | A Chalmers | 512 | |||
Independent Liberal | B Clarke | 347 | |||
Independent Liberal | J Hale | 313 | |||
National Front | J Bale | 133 | |||
Majority | |||||
Labour hold | Swing | {{{swing}}} | |||
Labour hold | Swing | {{{swing}}} |
Party | Candidate | Votes | % | ±% | |
---|---|---|---|---|---|
Labour | J Fisk | 3,350 | |||
Conservative | W Stephens | 3,339 | |||
Conservative | D Barnwell | 3,173 | |||
Conservative | C Whitmore | 3,167 | |||
Labour | G Brass | 2,764 | |||
Labour | D Large | 2,633 | |||
Liberal | W Hurford | 660 | |||
Liberal | W Paver | 634 | |||
Majority | |||||
Labour hold | Swing | {{{swing}}} | |||
Conservative gain from Labour | Swing | {{{swing}}} | |||
Conservative gain from Labour | Swing | {{{swing}}} |
Party | Candidate | Votes | % | ±% | |
---|---|---|---|---|---|
Labour | W Graves | 2,396 | |||
Labour | A Abrams | 2,219 | |||
Labour | M Houlihan | 1,924 | |||
Conservative | M Stamper | 1,046 | |||
Conservative | A Telling | 1,046 | |||
Conservative | G Bridcut | 995 | |||
Liberal | G Bentley | 276 | |||
Liberal | G Noel | 206 | |||
Liberal | V Noel | 204 | |||
Majority | |||||
Labour hold | Swing | {{{swing}}} | |||
Labour hold | Swing | {{{swing}}} |
Party | Candidate | Votes | % | ±% | |
---|---|---|---|---|---|
Labour | C Draper | 1,811 | |||
Labour | G Robertson | 1,806 | |||
Labour | F Vyvyan-Jones | 1,659 | |||
Conservative | M Bessant | 1,342 | |||
Conservative | C Baker | 1,289 | |||
Conservative | A Thomas | 1,172 | |||
National Front | F Tanner | 165 | |||
Majority | |||||
Labour hold | Swing | {{{swing}}} | |||
Labour hold | Swing | {{{swing}}} |
Party | Candidate | Votes | % | ±% | |
---|---|---|---|---|---|
Labour | C Merrett | 2,245 | |||
Conservative | B Topham | 2,224 | |||
Labour | R Edwards | 2,175 | |||
Labour | C Boney | 2,056 | |||
Conservative | P Cutcher | 2,048 | |||
Conservative | R Russell | 2,030 | |||
Liberal | P Hurford | 596 | |||
Liberal | R Moon | 502 | |||
Liberal | V Hales | 483 | |||
National Front | P Thomas | 269 | |||
Majority | |||||
Labour hold | Swing | {{{swing}}} | |||
Conservative gain from Labour | Swing | {{{swing}}} | |||
Labour hold | Swing | {{{swing}}} |
Party | Candidate | Votes | % | ±% | |
---|---|---|---|---|---|
Conservative | G Sprackling | 2,225 | |||
Conservative | E Wright | 2,051 | |||
Conservative | F Lawrence | 1,981 | |||
Labour | C Gardner | 1,102 | |||
National Front | R Dowler | 370 | |||
Majority | |||||
Conservative hold | Swing | {{{swing}}} | |||
Conservative hold | Swing | {{{swing}}} |
Party | Candidate | Votes | % | ±% | |
---|---|---|---|---|---|
Conservative | G Hebblethwaite | 1,929 | |||
Conservative | C Hebblethwaite | 1,904 | |||
Conservative | G Keeley | 1,879 | |||
Liberal | R Kirkham | 1,074 | |||
Liberal | W Legg | 973 | |||
Liberal | W Tasker | 972 | |||
Labour | A May | 683 | |||
Labour | M Mason | 671 | |||
Labour | M Reiner | 664 | |||
Majority | |||||
Conservative hold | Swing | {{{swing}}} | |||
Conservative hold | Swing | {{{swing}}} |
Party | Candidate | Votes | % | ±% | |
---|---|---|---|---|---|
Labour | H Willcox | 1,617 | |||
Labour | D Jackson | 1,485 | |||
Labour | J Comerford | 1,413 | |||
Conservative | D Stevens | 1,017 | |||
Conservative | S Walker | 962 | |||
Conservative | H Little | 921 | |||
National Front | J Dowler | 189 | |||
Liberal | J Fletcher | 178 | |||
Liberal | I Adams | 138 | |||
Liberal | A Adams | 129 | |||
Majority | |||||
Labour hold | Swing | {{{swing}}} | |||
Labour hold | Swing | {{{swing}}} |
Party | Candidate | Votes | % | ±% | |
---|---|---|---|---|---|
Conservative | F McGough | 3,047 | |||
Conservative | P Sidebottom | 2,748 | |||
Conservative | N Mearing-Smith | 2,686 | |||
Labour | J Hole | 2,523 | |||
Labour | R Bridle | 2,306 | |||
Labour | A Keefe | 2,229 | |||
Majority | |||||
Conservative gain from Labour | Swing | {{{swing}}} | |||
Conservative hold | Swing | {{{swing}}} | |||
Conservative gain from Labour | Swing | {{{swing}}} |
Party | Candidate | Votes | % | ±% | |
---|---|---|---|---|---|
Labour | H Harding | 1,302 | |||
Labour | M Young | 1,247 | |||
Labour | F Pidgeon | 1,245 | |||
Conservative | C Taylor | 1,226 | |||
Conservative | C Fox | 1,116 | |||
Conservative | M Jones | 1,104 | |||
Liberal | N Harrisson | 181 | |||
Liberal | E Ellis | 153 | |||
Liberal | A Havvock | 142 | |||
Majority | |||||
Labour hold | Swing | {{{swing}}} | |||
Labour hold | Swing | {{{swing}}} |
Party | Candidate | Votes | % | ±% | |
---|---|---|---|---|---|
Labour | L Rexworthy | 2,226 | |||
Labour | H Bloom | 2,222 | |||
Labour | D Beer | 2,188 | |||
Conservative | K Mountstephen | 2,076 | |||
Conservative | R King | 1,902 | |||
Conservative | C Woods | 1,817 | |||
Majority | |||||
Labour hold | Swing | {{{swing}}} | |||
Labour hold | Swing | {{{swing}}} |
Party | Candidate | Votes | % | ±% | |
---|---|---|---|---|---|
Labour | M Rea | 1,437 | |||
Labour | J McLaren | 1,417 | |||
Labour | I Rogers | 1,399 | |||
Conservative | C Avery | 1,108 | |||
Conservative | M Gardner | 956 | |||
Conservative | B Irwin | 881 | |||
National Front | R Pearce | 337 | |||
Majority | |||||
Labour hold | Swing | {{{swing}}} | |||
Labour hold | Swing | {{{swing}}} |
Party | Candidate | Votes | % | ±% | |
---|---|---|---|---|---|
Labour | D McLaren | 1,157 | |||
Labour | G Fowler | 1,047 | |||
Labour | P Korovilas | 1,012 | |||
Conservative | E Macdonald | 596 | |||
Conservative | K Rogers | 526 | |||
Conservative | J Seville | 483 | |||
Majority | |||||
Labour hold | Swing | {{{swing}}} | |||
Labour hold | Swing | {{{swing}}} |
Party | Candidate | Votes | % | ±% | |
---|---|---|---|---|---|
Labour | I Knight | 820 | |||
Labour | J Britton | 750 | |||
Labour | D Tedder | 741 | |||
Conservative | G Edwards | 378 | |||
Conservative | S Watton | 351 | |||
Conservative | H Edwards | 344 | |||
Majority | |||||
Labour hold | Swing | {{{swing}}} | |||
Labour hold | Swing | {{{swing}}} |
Party | Candidate | Votes | % | ±% | |
---|---|---|---|---|---|
Conservative | T Whiteley | 3,075 | |||
Conservative | P Brook | 3,055 | |||
Conservative | H Williams | 3,000 | |||
Labour | C Gingell | 1,847 | |||
Labour | M McGrath | 1,847 | |||
Labour | B Payton | 1,772 | |||
Majority | |||||
Conservative hold | Swing | {{{swing}}} | |||
Conservative hold | Swing | {{{swing}}} |
Party | Candidate | Votes | % | ±% | |
---|---|---|---|---|---|
Conservative | E Wilsdon | 3,748 | |||
Conservative | B Love | 3,582 | |||
Conservative | S Williams | 3,444 | |||
Labour | G Easton | 2,948 | |||
Labour | V Bath | 2,750 | |||
Labour | B Barker | 2,706 | |||
Liberal | H Bryant | 784 | |||
Liberal | J Edwards | 654 | |||
Liberal | M Langley | 652 | |||
Majority | |||||
Conservative gain from Labour | Swing | {{{swing}}} | |||
Conservative gain from Labour | Swing | {{{swing}}} |
Party | Candidate | Votes | % | ±% | |
---|---|---|---|---|---|
Conservative | D Poole | 6,371 | |||
Conservative | R Wall | 6,316 | |||
Conservative | C Alderson | 6,201 | |||
Liberal | L Edgell | 1,063 | |||
Liberal | G Davis | 1,016 | |||
Labour | J McLaren | 965 | |||
Liberal | M Hamilton | 918 | |||
Labour | D Evans | 917 | |||
Labour | S Andrews | 854 | |||
Majority | |||||
Conservative hold | Swing | {{{swing}}} | |||
Conservative hold | Swing | {{{swing}}} |
Party | Candidate | Votes | % | ±% | |
---|---|---|---|---|---|
Labour | C Reid | 1,086 | |||
Labour | D Poole | 1,039 | |||
Labour | G Bee | 1,008 | |||
Conservative | E Cockrell | 592 | |||
Conservative | S Simmons | 565 | |||
Conservative | W Wardle | 544 | |||
Liberal | R Hopkins | 280 | |||
Liberal | E Mottart | 278 | |||
Liberal | C Slater | 248 | |||
National Front | R Jacklin | 178 | |||
Majority | |||||
Labour hold | Swing | {{{swing}}} | |||
Labour hold | Swing | {{{swing}}} |
John Douglas Naysmith was a British Labour Co-operative politician who was the Member of Parliament (MP) for Bristol North West from 1997 until standing down at the 2010 general election.
Bristol City Council is the local authority for Bristol, a unitary authority and ceremonial county in England. Until 1 April 1996 it was a non-metropolitan district in Avon. From 2012 until 2024 it also had a directly elected mayor.
Bristol City Council is the local authority for the city of Bristol, in South West England. Bristol has had a council from medieval times, which has been reformed on numerous occasions. Since 1996 the council has been a unitary authority, being a district council which also performs the functions of a county council. Bristol has also formed its own ceremonial county since 1996. Since 2017 the council has been a member of the West of England Combined Authority.
Windmill Hill is a hill, an inner suburban neighbourhood, and an electoral ward in Bristol, England. It is located south of the River Avon, southeast of Bedminster, north of Knowle and west of Totterdown. Victoria Park occupies the eastern half of the hill.
Filwood is an electoral ward of the city of Bristol, England. It lies in the south of the city and covers the suburbs of Filwood Park and Inns Court, and a large part of Knowle West.
St George West is an electoral ward in the St George neighbourhood of Bristol, England. It is located in the outer east of the city of Bristol, covering St George Park, the upper end of Church Road, Plummers Hill and parts of Crofts End to the north, down to the River Avon to the south, and includes part of Redfield in the south-west.
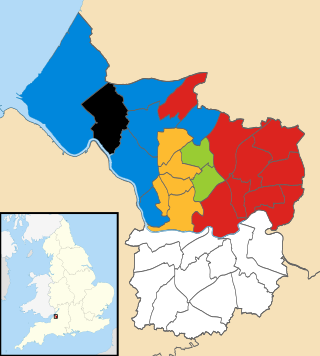
The 2010 Bristol City Council elections were held on Thursday 6 May 2010, for 23 seats, that being one third of the total number of councillors. The Liberal Democrats, who had won overall control of the council in 2009, increased their majority to six seats.
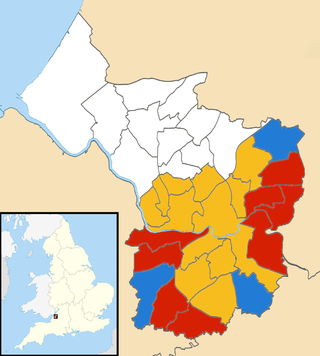
The 2011 Bristol City Council elections were held on Thursday 5 May 2011, for 24 seats, that being one third of the total number of councillors. The Liberal Democrats, who had won overall control of the council in 2009 and increased their majority in 2010, experienced a drop in support and lost 5 seats; 4 to the Labour Party and 1 to the Green Party, which gained its second ever council seat in Bristol. This meant that the Lib Dems no longer had a majority on the council. However, they continued to run the council, relying on opposition groups to vote through any proposal.
The Mayor of Bristol was the political leader of Bristol City Council. The mayor was a directly elected politician who, along with the 70 members of Bristol City Council, was responsible for the strategic government of the city of Bristol, England. The role was created after a local referendum held on 3 May 2012, which followed the passage of the Localism Act 2011. 41,032 voted for an elected mayor and 35,880 voted against, with a turnout of 24%. An election for the new post was held on 15 November 2012.
Elections for one third of Bristol City Council were held on 2 May 2013 as part of the 2013 United Kingdom local elections. No party gained overall control of the chamber, although administrative power rested with the Mayor of Bristol, who had been first elected in November 2012
The 2014 Bristol City Council election took place on 22 May 2014 to elect members of Bristol City Council in England, as part of the United Kingdom 2014 Local Elections.
The 2015 Bristol City Council election took place on 7 May 2015 to elect members of Bristol City Council in England. This was on the same day as other local elections.
The 2016 Bristol City Council election took place on Thursday 5 May 2016, alongside nationwide local elections. Following a boundary review, the number of wards in the city was reduced to 34, with each electing one, two or three Councillors. The overall number of Councillors remained 70, with all seats up for election at the same time. Elections would then be held every 4 years.
The 1973 Bristol City Council election took place on 7 June 1973 to elect members of Bristol City Council in England. This was on the same day as other local elections. Voting took place across 28 wards, each electing 3 Councillors. Following the Local Government Act 1972, this was the first election to the new non-metropolitan district council for Bristol, which came into being on 1 April the following year. Labour took control of the Council after winning a comfortable majority of seats.
The 1999 Bristol City Council election took place on 6 May 1999, on the same day as other local elections. All seats were up for election due to boundary changes, with each ward electing 2 councillors. The total number of seats on the council increased by 2 due to the creation of a new ward: Clifton East.
The 2002 Bristol City Council election took place on 2 May 2002, on the same day as other local elections. Despite suffering some losses, the Labour Party managed to retain a slim majority.
The 2003 Bristol City Council election took place on 1 May 2003, on the same day as other local elections in the UK. The Labour Party made a number of losses, mainly to the Liberal Democrats, and lost overall control of the council. Loses included Council leader Diane Bunyan, who lost her Windmill Hill seat to the Liberal Democrats. This year also saw elections contested by the new Bristolian Party, founded by the local 'scandal sheet' The Bristolian, though they failed to win any seats.
The 2006 Bristol City Council election took place on 4 May 2006, on the same day as other local elections. The Labour Party continued to lose seats, but the Liberal Democrats failed to gain enough to form an overall majority. This election saw the first election of a Green Councillor to Bristol City Council – the first time four parties had been represented since the Council’s creation.
The 2007 Bristol City Council election took place on 3 May 2007, on the same day as other local elections. The Liberal Democrats lost two seats to Labour, but remained the largest party on the Council. No party gained overall control.
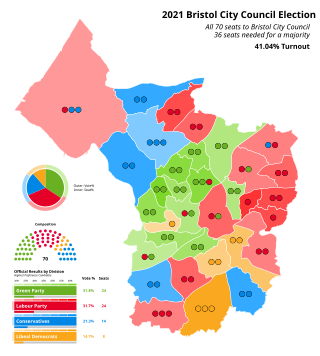
The 2021 Bristol City Council election took place on 6 May 2021 to elect members of Bristol City Council in England. It coincided with nationwide local elections. Voters in the city also voted for the mayor of Bristol, the mayor of the West of England and for Avon and Somerset's police and crime commissioner. The election was originally due to take place in May 2020, but was postponed due to the COVID-19 pandemic.