This article needs additional citations for verification . (April 2016) (Learn how and when to remove this template message) |
![]() | |||||||||||||||||
| |||||||||||||||||
All 70 seats to Bristol City Council 36 seats needed for a majority | |||||||||||||||||
---|---|---|---|---|---|---|---|---|---|---|---|---|---|---|---|---|---|
| |||||||||||||||||
![]() 1999 local election results in Bristol | |||||||||||||||||
|
The 1999 Bristol City Council election took place on 6 May 1999, on the same day as other local elections. All seats were up for election due to boundary changes, with each ward electing 2 councillors. The total number of seats on the council increased by 2 due to the creation of a new ward: Clifton East. [1]
Despite losing seats to both the Liberal Democrats and the Conservatives, the Labour Party maintained control of the council with a slim overall majority. [2]
Party | Candidate | Votes | % | ±% | |
---|---|---|---|---|---|
Labour | Helga Christine Benson | 1,311 | 22.99 | ||
Liberal Democrats | Trevor Ernest Riddlestone | 1,147 | 20.11 | ||
Liberal Democrats | Sean Clifford Emmett | 1,013 | 17.76 | ||
Labour | Robin Moss | 955 | 17.45 | ||
Green | David Mark Simpson | 764 | 13.40 | ||
Socialist Labour | Bernard Joseph Kennedy | 331 | 5.80 | ||
Conservative | Ian James Henderson | 142 | 2.49 | ||
Majority | |||||
Turnout | 2970 | 34.87 | |||
Labour hold | Swing | ||||
Liberal Democrats hold | Swing |
Party | Candidate | Votes | % | ±% | |
---|---|---|---|---|---|
Labour | Celia Mildred Lukins | 1,912 | 32.41 | ||
Labour | Patricia Roberts | 1,486 | 25.19 | ||
Conservative | Albert Edward Murphy | 1,334 | 22.61 | ||
Liberal Democrats | Paul Wakefield Lloyd | 584 | 9.90 | ||
Liberal Democrats | Sheila Catherine Mercer | 344 | 5.83 | ||
Green | Lela Helen McTernan | 239 | 4.05 | ||
Majority | |||||
Turnout | 3,285 | 36.50 | |||
Labour hold | Swing | ||||
Labour hold | Swing |
Party | Candidate | Votes | % | ±% | |
---|---|---|---|---|---|
Labour | Peter John Crispin | 1,397 | 31.11 | ||
Labour | Claire Margaret Warren | 1,184 | 26.37 | ||
Conservative | Christian Virginia Jessie Simpson | 567 | 12.63 | ||
Liberal Democrats | William Richard Guest | 552 | 12.29 | ||
Liberal Democrats | Michael James Twohig | 391 | 8.71 | ||
Green | Peter Murray Andrews | 299 | 6.66 | ||
Socialist Alternative | Wayne Coombes | 100 | 2.23 | ||
Majority | |||||
Turnout | 2,383 | 27.66 | |||
Labour hold | Swing | ||||
Labour hold | Swing |
Party | Candidate | Votes | % | ±% | |
---|---|---|---|---|---|
Liberal Democrats | David John Gordon Kitson | 1,805 | 25.09 | ||
Liberal Democrats | Beverley Arthur Knott | 1,568 | 21.80 | ||
Labour | Patricia McLaren | 1,449 | 20.14 | ||
Labour | Arthur Keefe | 1,336 | 18.57 | ||
Conservative | Richard James Manns | 353 | 4.91 | ||
Green | Ian George Coates | 349 | 4.85 | ||
Conservative | Oliver Edward Mead | 333 | 4.63 | ||
Majority | |||||
Turnout | 3,649 | 41.21 | |||
Liberal Democrats hold | Swing | ||||
Liberal Democrats gain from Labour | Swing | ||||
Party | Candidate | Votes | % | ±% | |
---|---|---|---|---|---|
Conservative | Richard Stephen Eddy | 2,295 | 32.99 | ||
Conservative | Ronald Hodges | 1,969 | 28.30 | ||
Labour | Geoffrey Alan Clarke | 1,112 | 15.98 | ||
Labour | Paul Crawford Walker | 992 | 14.26 | ||
Green | Barrie Robert Lewis | 237 | 3.41 | ||
Liberal Democrats | Jean Althea Lemin | 209 | 3.00 | ||
Liberal Democrats | David Malcolm Rothwell | 143 | 2.03 | ||
Majority | |||||
Turnout | 3,548 | 41.71 | |||
Conservative gain from Labour | Swing | ||||
Party | Candidate | Votes | % | ±% | |
---|---|---|---|---|---|
Labour | Peter Thomas James Begley | 1,552 | 30.32 | ||
Labour | William Leslie Martin | 1,364 | 26.65 | ||
Conservative | Colin Robert Bretherton | 718 | 14.03 | ||
Conservative | Craig Heeley | 608 | 11.88 | ||
Liberal Democrats | Paul Elvin | 311 | 6.08 | ||
Liberal Democrats | Yvonne Potts | 272 | 5.31 | ||
Socialist Labour | Brian Andrew Corbett | 158 | 3.09 | ||
Green | Jacqueline Allison | 135 | 2.64 | ||
Majority | |||||
Turnout | 2,631 | 30.15 | |||
Labour hold | Swing | ||||
Labour hold | Swing |
Party | Candidate | Votes | % | ±% | |
---|---|---|---|---|---|
Liberal Democrats | Jacqueline Edna Norman | 1,541 | 26.81 | ||
Liberal Democrats | Peter Henry Main | 1,537 | 26.74 | ||
Labour | Anthony Frederick Poole | 835 | 14.53 | ||
Labour | Simon Mark Geoffrey Crew | 820 | 14.27 | ||
Conservative | Robert Andrew Britton | 467 | 8.13 | ||
Conservative | Beryl McGarry | 436 | 7.59 | ||
Green | Maureen Ann Arnaiz | 111 | 1.93 | ||
Majority | |||||
Turnout | 2,915 | 36.66 | |||
Liberal Democrats hold | Swing | ||||
Liberal Democrats hold | Swing |
Party | Candidate | Votes | % | ±% | |
---|---|---|---|---|---|
Liberal Democrats | Anne Pauline White | 1,091 | 29.82 | ||
Liberal Democrats | Victor Roy Tallis | 996 | 27.22 | ||
Labour | Margaret Mary Bannerman | 438 | 11.97 | ||
Labour | Glynthea Margaret Modood | 438 | 11.97 | ||
Conservative | Ashley Peter Fox | 261 | 7.13 | ||
Conservative | James Danvers Baillieu | 238 | 6.50 | ||
Green | Thomas Ritchie Kilner | 212 | 5.79 | ||
Majority | |||||
Turnout | 1,855 | 24.65 | |||
Liberal Democrats hold | Swing | ||||
Liberal Democrats hold | Swing |
Party | Candidate | Votes | % | ±% | |
---|---|---|---|---|---|
Liberal Democrats | Barbara Janke | 1,441 | 27.56 | ||
Liberal Democrats | Brian Hugh Price | 1,287 | 24.62 | ||
Conservative | Pearl Christine Lavinia Abraham | 694 | 13.27 | ||
Conservative | Patricia Anne Tyreman | 693 | 13.26 | ||
Labour | Bhupinder Sandhu | 463 | 8.86 | ||
Labour | Alan Rogan | 396 | 7.57 | ||
Green | Gundula Audrey Hidde Dorey | 254 | 4.86 | ||
Majority | |||||
Turnout | 2,648 | 34.08 | |||
Liberal Democrats hold | Swing | ||||
Liberal Democrats hold | Swing |
Party | Candidate | Votes | % | ±% | |
---|---|---|---|---|---|
Liberal Democrats | Geoffrey Robert Jones | 886 | 22.46 | ||
Liberal Democrats | Simon Timothy Cook | 829 | 21.50 | ||
Conservative | Philip Arthur Cobbold | 666 | 17.27 | ||
Conservative | Robert Marven | 628 | 16.29 | ||
Labour | Edmund John Bramall | 350 | 9.08 | ||
Labour | Sally Elinor Mary Purves | 347 | 9.00 | ||
Green | John Mark Hills | 170 | 4.41 | ||
Majority | |||||
Turnout | 2,107 | 26.82 | |||
Liberal Democrats win (new seat) | |||||
Liberal Democrats win (new seat) |
Party | Candidate | Votes | % | ±% | |
---|---|---|---|---|---|
Liberal Democrats | Colin William Eldridge | 1,306 | 24.81 | ||
Liberal Democrats | Barrington Dodd | 1,226 | 23.29 | ||
Labour | Louise Marie Davies | 913 | 17.34 | ||
Labour | Robert David Knowles-Leak | 712 | 13.53 | ||
Conservative | Michael John Cobb | 392 | 7.45 | ||
Green | Geoff Collard | 387 | 7.35 | ||
Conservative | Harold Christopher Summers Webb | 328 | 6.23 | ||
Majority | |||||
Turnout | 2,667 | 30.37 | |||
Liberal Democrats hold | Swing | ||||
Liberal Democrats hold | Swing |
Party | Candidate | Votes | % | ±% | |
---|---|---|---|---|---|
Liberal Democrats | John Francis Kiely | 1,495 | 28.58 | ||
Liberal Democrats | Muriel Cole | 1,410 | 26.95 | ||
Labour | Fabian Guy Breckles | 916 | 17.51 | ||
Labour | David Sutton | 818 | 15.64 | ||
Green | Aidan Knapp | 244 | 4.66 | ||
Conservative | Jean Bowrey | 127 | 2.43 | ||
Socialist Labour | Kenneth Cyril Davison | 121 | 2.31 | ||
Conservative | Lee Walker | 100 | 1.91 | ||
Majority | |||||
Turnout | 2,683 | 32.49 | |||
Liberal Democrats hold | Swing | ||||
Liberal Democrats hold | Swing |
Party | Candidate | Votes | % | ±% | |
---|---|---|---|---|---|
Liberal Democrats | Paul Roberts Potts | 1,401 | 26.39 | ||
Liberal Democrats | Anthony James Wood | 1,271 | 23.94 | ||
Labour | Raymond Shute | 767 | 14.45 | ||
Labour | Mohammad Khalil Ahmed | 676 | 12.73 | ||
Conservative | Lesley Ann Alexander | 472 | 8.89 | ||
Conservative | George Edward Burton | 422 | 7.95 | ||
Green | Graham Hugh Davey | 132 | 2.49 | ||
Socialist Alternative | Mark Ian Baker | 95 | 1.79 | ||
Socialist Alternative | Nicola Janet Susan Mayger | 73 | 1.38 | ||
Majority | 2,731 | 31.34 | |||
Turnout | |||||
Liberal Democrats hold | Swing | ||||
Liberal Democrats hold | Swing |
Party | Candidate | Votes | % | ±% | |
---|---|---|---|---|---|
Labour | Kelvin John Blake | 1,146 | 27.04 | ||
Labour | George Micklewright | 1,048 | 24.73 | ||
Liberal Democrats | Ann Cooper | 887 | 20.93 | ||
Liberal Democrats | Linda Hopkins | 871 | 20.55 | ||
Conservative | Jonathan Robert Hucker | 148 | 3.49 | ||
Socialist Alternative | Christine Ann Marshall | 94 | 2.22 | ||
Socialist Alternative | Robin Victor Clapp | 44 | 1.04 | ||
Majority | |||||
Turnout | 2,192 | 27.65 | |||
Labour hold | Swing | ||||
Labour hold | Swing |
Party | Candidate | Votes | % | ±% | |
---|---|---|---|---|---|
Labour | Adrian Becker | 1,512 | 26.36 | ||
Labour | Alun Geraint Davies | 1,354 | 23.61 | ||
Conservative | Victor Claude Eaglestone | 994 | 17.33 | ||
Conservative | Isle Elisabeth Temple | 945 | 16.48 | ||
Liberal Democrats | Ronald Ivor Potts | 442 | 7.71 | ||
Liberal Democrats | Betty Doris Sheppard | 380 | 6.63 | ||
Socialist Labour | Michael Paul Langley | 108 | 1.88 | ||
Majority | |||||
Turnout | 2,948 | 35.89 | |||
Labour hold | Swing | ||||
Labour hold | Swing |
Party | Candidate | Votes | % | ±% | |
---|---|---|---|---|---|
Labour | Bernard William Chalmers | 1,292 | 31.01 | ||
Labour | Mervyn Roderick Hulin | 1,154 | 27.70 | ||
Conservative | Shirley Diane Hodges | 513 | 12.31 | ||
Conservative | Jonathan David Russell Price | 494 | 11.86 | ||
Liberal Democrats | Evelyn Mary Elworthy | 303 | 7.27 | ||
Liberal Democrats | Nicholas Lance Doddrell | 293 | 7.03 | ||
Green | Susan Patricia Ball | 117 | 2.81 | ||
Majority | |||||
Turnout | 2,120 | 26.14 | |||
Labour hold | Swing | ||||
Labour hold | Swing |
Party | Candidate | Votes | % | ±% | |
---|---|---|---|---|---|
Labour | Claire Louise Cook | 1,501 | 29.09 | ||
Labour | Richard John Pyle | 1,480 | 28.68 | ||
Conservative | Anthony James Smith | 806 | 15.62 | ||
Conservative | Matthew Christopher Stallabrass | 756 | 14.65 | ||
Liberal Democrats | Christine Napier | 312 | 6.05 | ||
Liberal Democrats | Pamela Denise Henderson | 305 | 5.91 | ||
Majority | |||||
Turnout | 2,619 | 35.49 | |||
Labour hold | Swing | ||||
Labour hold | Swing |
Party | Candidate | Votes | % | ±% | |
---|---|---|---|---|---|
Liberal Democrats | Judith Mary Webb | 1,279 | 20.33 | ||
Liberal Democrats | Mary Sykes | 1,050 | 16.69 | ||
Conservative | Richard James Carter | 1,027 | 16.33 | ||
Labour | Barry David Clark | 1,012 | 16.09 | ||
Conservative | Steven Mark Willis | 943 | 14.99 | ||
Labour | Richard Anthony Hughes | 906 | 14.40 | ||
Green | Mary Beryl Wood | 73 | 1.16 | ||
Majority | |||||
Turnout | 3,192 | 36.37 | |||
Liberal Democrats hold | Swing | ||||
Liberal Democrats gain from Labour | Swing | ||||
Party | Candidate | Votes | % | ±% | |
---|---|---|---|---|---|
Liberal Democrats | Rosalie Margaret Brown | 2,306 | 27.79 | ||
Liberal Democrats | Dennis Hunter Brown | 2,106 | 25.38 | ||
Conservative | Geoffrey Richard Gollop | 1,477 | 17.80 | ||
Conservative | John Goulandris | 1,384 | 16.68 | ||
Labour | Keith Evans | 450 | 5.42 | ||
Labour | Judith Mary Sluglett Borodkine | 396 | 4.77 | ||
Green | Keith Vivian Wiltshire | 178 | 2.15 | ||
Majority | |||||
Turnout | 4,190 | 51.42 | |||
Liberal Democrats hold | Swing | ||||
Liberal Democrats hold | Swing |
Party | Candidate | Votes | % | ±% | |
---|---|---|---|---|---|
Labour | Graham Roy Robertson | 1,369 | 26.94 | ||
Labour | Judy Patterson | 1,334 | 26.25 | ||
Conservative | Barbara Jean Moore | 663 | 13.05 | ||
Conservative | Aldred Derek Seville | 649 | 12.77 | ||
Liberal Democrats | John Patrick Hassell | 499 | 9.82 | ||
Liberal Democrats | Myer Daniel Chalmers | 459 | 9.03 | ||
Socialist Alternative | Paul Martin Moorhouse | 109 | 2.14 | ||
Majority | |||||
Turnout | 2,614 | 29.14 | |||
Labour hold | Swing | ||||
Labour hold | Swing |
Party | Candidate | Votes | % | ±% | |
---|---|---|---|---|---|
Conservative | Martin Kerry | 1,449 | 22.99 | ||
Conservative | Alan Neil Bailey | 1,386 | 21.99 | ||
Labour | Kathleen Rosalie Walker | 1,254 | 19.89 | ||
Labour | Nichola Irene Barton | 1,196 | 18.97 | ||
Liberal Democrats | Andrew James Ludlow | 450 | 7.14 | ||
Liberal Democrats | Simon Ross Young | 432 | 6.85 | ||
Green | Christopher Sykes | 137 | 2.17 | ||
Majority | |||||
Turnout | 3,188 | 36.65 | |||
Conservative hold | Swing | ||||
Conservative gain from Labour | Swing | ||||
Party | Candidate | Votes | % | ±% | |
---|---|---|---|---|---|
Labour | John Thomas Bees | 1,158 | 22.55 | ||
Labour | John Waines | 889 | 17.31 | ||
Liberal Democrats | Terence Richard Daniel Thomas | 860 | 16.74 | ||
Conservative | Richard Leslie Clifton | 754 | 14.68 | ||
Conservative | Douglas William Dowling | 724 | 14.10 | ||
Liberal Democrats | Sylvia Eileen Young | 638 | 12.42 | ||
Green | David Woodgate | 113 | 2.20 | ||
Majority | |||||
Turnout | 2,641 | 35.27 | |||
Labour hold | Swing | ||||
Labour hold | Swing |
Party | Candidate | Votes | % | ±% | |
---|---|---|---|---|---|
Labour | Jane Veronica Painter | 1,198 | 24.75 | ||
Labour | Tessa Coombes | 1,162 | 24.01 | ||
Liberal Democrats | David John Traube | 806 | 16.65 | ||
Conservative | John Philip Stephenson | 682 | 14.09 | ||
Liberal Democrats | Alexander Timothy Matthew Oliver | 547 | 11.30 | ||
Green | Glenn Royston Vowles | 352 | 7.27 | ||
Socialist Alternative | Domenico William Hill | 93 | 1.92 | ||
Majority | |||||
Turnout | 2,625 | 31.87 | |||
Labour hold | Swing | ||||
Labour hold | Swing |
Party | Candidate | Votes | % | ±% | |
---|---|---|---|---|---|
Labour | John Channon | 1,085 | 23.72 | ||
Labour | Brenda Hugill | 1,007 | 22.02 | ||
Liberal Democrats | John Richard Astley | 917 | 20.05 | ||
Liberal Democrats | Stella Jane Hender | 793 | 17.34 | ||
Conservative | Mary Rose Brewer | 187 | 4.09 | ||
Conservative | Diane Newton | 171 | 3.74 | ||
Green | Joanna Baker | 145 | 3.17 | ||
Socialist Labour | David Henry White | 138 | 3.02 | ||
Socialist Labour | Paul Francis Williams | 131 | 2.86 | ||
Majority | |||||
Turnout | 2,370 | 27.48 | |||
Labour hold | Swing | ||||
Labour hold | Swing |
Party | Candidate | Votes | % | ±% | |
---|---|---|---|---|---|
Labour | Paul Anthony Garland | 1,227 | 29.32 | ||
Labour | Arthur Massey | 1,147 | 27.41 | ||
Liberal Democrats | Joan Grace | 594 | 14.19 | ||
Conservative | Lewes William Price | 534 | 12.76 | ||
Liberal Democrats | Ian Huw Parry | 526 | 12.57 | ||
Green | Samantha Elizabeth Thompson | 157 | 3.75 | ||
Majority | |||||
Turnout | 2,235 | 28.37 | |||
Labour hold | Swing | ||||
Labour hold | Swing |
Party | Candidate | Votes | % | ±% | |
---|---|---|---|---|---|
Liberal Democrats | Sylvia Jeanne Townsend | 1,148 | 16.56 | ||
Liberal Democrats | James Charles White | 1,054 | 15.20 | ||
Labour | Shelley Margaret Lanchbury | 1,022 | 14.74 | ||
Labour | Elaine Rosemary Bennett | 1,021 | 14.72 | ||
Conservative | Alastair Peter Lindsay Watson | 977 | 14.09 | ||
Conservative | Susan Fleming | 975 | 14.06 | ||
Green | Justin Michael Quinnell | 443 | 6.39 | ||
Green | John Fraser Laird Devaney | 294 | 4.24 | ||
Majority | |||||
Turnout | 3,483 | 41.22 | |||
Liberal Democrats gain from Labour | Swing | ||||
Party | Candidate | Votes | % | ±% | |
---|---|---|---|---|---|
Labour | Jenny Smith | 1,063 | 32.42 | ||
Labour | Peter Hammond | 1,020 | 31.11 | ||
Conservative | Anthony Michael Orr | 390 | 11.89 | ||
Liberal Democrats | Carol Ann Knight | 370 | 11.28 | ||
Liberal Democrats | Martyn George Dunn | 364 | 11.10 | ||
Socialist Labour | Vincent Michael Horrigan | 72 | 2.20 | ||
Majority | |||||
Turnout | 1,766 | 23.11 | |||
Labour hold | Swing | ||||
Labour hold | Swing |
Party | Candidate | Votes | % | ±% | |
---|---|---|---|---|---|
Labour | Rosemary Elaine Brennan | 1,481 | 29.68 | ||
Labour | Andrew May | 1,433 | 28.72 | ||
Conservative | Cora Ann Stephenson | 483 | 9.68 | ||
Liberal Democrats | Jonathan Freeman | 459 | 9.20 | ||
Conservative | Ian Darsie Millard | 443 | 8.88 | ||
Green | Charles Nicholas Bolton | 340 | 6.81 | ||
Liberal Democrats | Melanie Lago Worman | 283 | 5.67 | ||
Socialist Alternative | Roger Stephen Thomas | 68 | 1.36 | ||
Majority | |||||
Turnout | 2,622 | 31.81 | |||
Labour hold | Swing | ||||
Labour hold | Swing |
Party | Candidate | Votes | % | ±% | |
---|---|---|---|---|---|
Labour | Margaret Ann Shovelton | 1,280 | 26.89 | ||
Labour | Charles Stanley Price | 1,270 | 26.68 | ||
Conservative | Jennifer Rogers | 674 | 14.16 | ||
Conservative | Rachael Sarah Frise | 665 | 13.97 | ||
Liberal Democrats | Gordon Draper | 495 | 10.40 | ||
Liberal Democrats | Tony Robert Potts | 377 | 7.92 | ||
Majority | |||||
Turnout | 2,419 | 27.50 | |||
Labour hold | Swing | ||||
Labour hold | Swing |
Party | Candidate | Votes | % | ±% | |
---|---|---|---|---|---|
Labour | John Edward Deasy | 1,296 | 30.81 | ||
Labour | Ronald Edward Stone | 1,252 | 29.76 | ||
Liberal Democrats | Michael Kenneth Peacock | 481 | 11.43 | ||
Liberal Democrats | Gordon Lennox Williams | 458 | 10.89 | ||
Conservative | Charles William Alexander | 383 | 9.10 | ||
Conservative | Paul Andrew Place | 337 | 8.01 | ||
Majority | |||||
Turnout | 2,148 | 27.18 | |||
Labour hold | Swing | ||||
Labour hold | Swing |
Party | Candidate | Votes | % | ±% | |
---|---|---|---|---|---|
Conservative | Jack Lopresti | 1,638 | 23.96 | ||
Conservative | David Henry Robert Morris | 1,608 | 23.52 | ||
Labour | Graham Frederick Tanner | 1,320 | 19.31 | ||
Labour | Jonathan Marian Wyatt | 1,244 | 18.20 | ||
Liberal Democrats | Jane Mary Collins | 490 | 7.17 | ||
Liberal Democrats | Robert Ian Johnston | 431 | 6.30 | ||
Green | Mary Elizabeth Thomson | 105 | 1.54 | ||
Majority | |||||
Turnout | 3,487 | 40.76 | |||
Conservative hold | Swing | ||||
Conservative gain from Labour | Swing | ||||
Party | Candidate | Votes | % | ±% | |
---|---|---|---|---|---|
Conservative | Christopher Dominic Marmaduke Bellairs Alderson | 1,948 | 31.18 | ||
Conservative | Peter John Abraham | 1,921 | 30.75 | ||
Liberal Democrats | Vera Susan Mackel | 698 | 11.17 | ||
Liberal Democrats | Paul Edward Smith | 669 | 10.71 | ||
Labour | Dianne Elizabeth Manning | 415 | 6.64 | ||
Labour | Beverley Watkins | 415 | 6.64 | ||
Green | William Frame McCaskie | 181 | 2.90 | ||
Majority | |||||
Turnout | 3,145 | 38.75 | |||
Conservative hold | Swing | ||||
Conservative hold | Swing |
Party | Candidate | Votes | % | ±% | |
---|---|---|---|---|---|
Conservative | David Henry Poole | 2,371 | 31.12 | ||
Conservative | Robert William Wall | 2,265 | 29.73 | ||
Liberal Democrats | Philippa Margaret Elizabeth Jones | 740 | 9.71 | ||
Labour | Dick Drew | 720 | 9.45 | ||
Liberal Democrats | Geraldine Box | 680 | 8.93 | ||
Labour | Susan Milestone | 630 | 8.27 | ||
Green | Christina Mary Stockdale | 213 | 2.80 | ||
Majority | |||||
Turnout | 3,819 | 45.49 | |||
Conservative hold | Swing | ||||
Conservative hold | Swing |
Party | Candidate | Votes | % | ±% | |
---|---|---|---|---|---|
Labour | Helen Holland | 1,340 | 34.43 | ||
Labour | David Johnson | 1,225 | 31.47 | ||
Liberal Democrats | Stephen Edward John Farthing | 473 | 12.15 | ||
Liberal Democrats | Peter Douglas Burrows | 362 | 9.30 | ||
Conservative | Derek Raymond King Frise | 349 | 8.97 | ||
Green | David Simon Coombes | 143 | 3.67 | ||
Majority | |||||
Turnout | 2,127 | 26.16 | |||
Labour hold | Swing | ||||
Labour hold | Swing |
Party | Candidate | Votes | % | ±% | |
---|---|---|---|---|---|
Labour | Diane Elizabeth Bunyan | 1,526 | 31.54 | ||
Labour | Christopher Louis Orlik | 1,273 | 26.31 | ||
Green | Maxine Louise Gilman | 460 | 9.51 | ||
Conservative | Graham David Morris | 396 | 8.19 | ||
Liberal Democrats | Josephine Cynthia Carpenter | 358 | 7.40 | ||
Conservative | Robert Rhys Morris | 343 | 7.09 | ||
Liberal Democrats | James Mictel Carpenter | 333 | 6.88 | ||
Socialist Alternative | Stephen Michael Luff | 149 | 3.08 | ||
Majority | |||||
Turnout | 2,472 | 27.98 | |||
Labour hold | Swing | ||||
Labour hold | Swing |
Bristol West is a borough constituency represented in the House of Commons of the Parliament of the United Kingdom since 2015 by Thangam Debbonaire of the Labour Party. It covers the central and western parts of Bristol.
Liverpool City Council has existed since 1880, when Liverpool was awarded city status. Prior to this date the local authority was a town council.
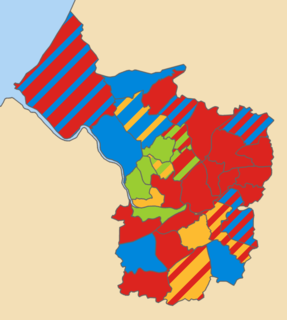
One third of Preston City Council in Lancashire, England is elected each year, followed by one year without election to allow for the Lancashire County Council elections. Preston is a non-metropolitan district forming a lower-tier of local government under Lancashire County Council.
Bath and North East Somerset Council is the local council for the district of Bath and North East Somerset in Somerset, England.
(Kingston upon) Hull City Council is the governing body for the unitary authority and city of Kingston upon Hull. It was created in 1972 as the successor to the Corporation of Hull, which was also known as Hull Corporation and founded in 1440 by Royal charter.
The city of Bristol, England, is a unitary authority, represented by four MPs representing seats wholly within the city boundaries. As well as these, Filton and Bradley Stoke covers the northern urban fringe in South Gloucestershire and the north eastern urban fringe is in the Kingswood constituency. The overall trend of both local and national representation became left of centre during the latter 20th century, but there was a shift to the right in the 2010 general election. The city has a tradition of local activism, with environmental issues and sustainable transport being prominent issues in the city.
Sunderland City Council is the local authority of the City of Sunderland in Tyne and Wear, England. It is a metropolitan district council, one of five in Tyne and Wear and one of 36 in the metropolitan counties of England, and provides the majority of local government services in Sunderland.
The 1983 Bristol City Council election took place on 5 May 1983 to elect members of Bristol City Council in England. This was on the same day as other local elections. All seats were up for election, two seats in every ward, due to the introduction of new ward boundaries. Therefore, direct comparisons with previous elections are not possible. Majority is the number of votes separating the 2nd and 3rd candidates. Alliance candidates who were Liberals are described as such. No party had an overall majority; as the largest party the Conservatives formed a minority administration.
Local elections were held in the United Kingdom on 6 May 1976. Elections were for one third of the seats on Metropolitan borough councils and for all seats on Non-Metropolitan district councils in England; and for all seats on the Welsh district councils.
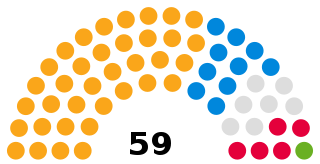
Kingston upon Hull is a unitary authority in the East Riding of Yorkshire, England. Until 1 April 1996 it was a non-metropolitan district in Humberside. A third of the Council is elected each year with no election every four years. Since the boundary changes in 2002 until 2018, 59 councillors are elected from 23 wards with each ward electing either 2 or 3 councillors. Following a review, in 2017, by the Local Government Boundary Commission this was reduced to 57 councillors from 21 wards effective from the 2018 elections.
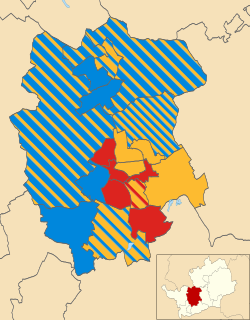
The 1999 St Albans City and District Council election took place on 6 May 1999 to elect members of St Albans City and District Council in Hertfordshire, England. The whole council was up for election with boundary changes since the last election in 1998 increasing the number of seats by 1. The Liberal Democrats lost overall control of the council to no overall control.
The 2012 United Kingdom local elections were held across England, Scotland and Wales on 3 May 2012. Elections were held in 128 English local authorities, all 32 Scottish local authorities and 21 of the 22 Welsh unitary authorities, alongside three mayoral elections including the London mayoralty and the London Assembly. Referendums were also held in 11 English cities to determine whether or not to introduce directly elected mayors.
The 2011 Bristol City Council elections were held on Thursday 5 May 2011, for 24 seats, that being one third of the total number of councillors. The Liberal Democrats, who had won overall control of the council in 2009 and increased their majority in 2010, experienced a drop in support and lost 5 seats; 4 to the Labour Party and 1 to the Green Party, which gained its second ever council seat in Bristol. This meant that the Lib Dems no longer had a majority on the council. However, they continued to run the council, relying on opposition groups to vote through any proposal.
The 2016 Bristol City Council election took place on Thursday 5 May 2016, alongside nationwide local elections. Following a boundary review, the number of wards in the City was reduced to 34, with each electing one, two or three Councillors. The overall number of Councillors remained 70, with all seats up for election at the same time. Elections would then be held every 4 years.
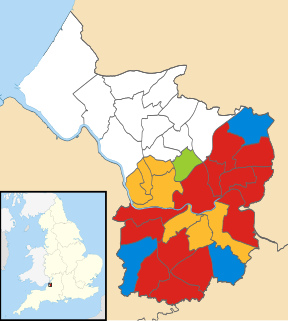
The 2016 Exeter City Council election took place on 5 May 2016, to elect members of Exeter City Council in England. Following boundary changes, the entire council was up for election, and all 13 wards were contested, each electing three councillors. The election was held concurrently with other local elections held in England on the 5 May.
The 2016 Gloucester City Council election took place on 5 May 2016 to elect members of Gloucester City Council in England. All seats are up for election at the same time due to boundary changes. This was on the same day as other local elections. The council also changed from electing a third of the council to electing the entire council. They were originally planned for 7 May 2020, but postponed until 6 May 2021 due to the COVID-19 pandemic.
The City of Glasgow is divided into a number of wards. These electoral districts, as they are also known, are used to elect councillors to Glasgow City Council. The council, composed of the elected members from each ward, provides local government services to the City of Glasgow.
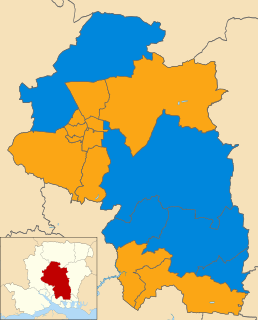
Elections to Winchester City Council took place on Thursday 2 May 2019, alongside other local elections across the country. The Conservatives party held a narrow majority of one at the last election, with the seats contested in this election being last contested in 2016 election. The Conservatives defended 10 seats, whilst the Liberal Democrats defended 4. Town and parish councils in the city boundary were also up for election.
The 2021 Bristol City Council election took place on 6 May 2021 to elect members of Bristol City Council in England. It coincided with nationwide local elections. Voters in the city also voted for the mayor of Bristol, the mayor of West of England and for Avon and Somerset's police and crime commissioner. The election was originally due to take place in May 2020, but was postponed due to the COVID-19 pandemic.