| |||||||||||||||||||||||||||||||||||||||||||||||||||||||||||||||||
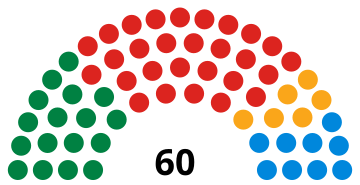
All 60 seats to the National Assembly for Wales 31 seats needed for a majority | |||||||||||||||||||||||||||||||||||||||||||||||||||||||||||||||||
---|---|---|---|---|---|---|---|---|---|---|---|---|---|---|---|---|---|---|---|---|---|---|---|---|---|---|---|---|---|---|---|---|---|---|---|---|---|---|---|---|---|---|---|---|---|---|---|---|---|---|---|---|---|---|---|---|---|---|---|---|---|---|---|---|---|
Turnout | 46.3% | ||||||||||||||||||||||||||||||||||||||||||||||||||||||||||||||||
| |||||||||||||||||||||||||||||||||||||||||||||||||||||||||||||||||
|
This article is part of a series within the Politics of the United Kingdom on the |
Politics of Wales |
---|
The 1999 National Assembly for Wales election was held on Thursday 6 May 1999 to elect 60 members to the Senedd, at the time called the National Assembly for Wales (Welsh Parliament; Welsh : Cynulliad Cenedlaethol Cymru). It was the first devolved general election held in Wales after the successful 1997 Welsh devolution referendum. The election was held alongside the Scottish Parliament election (also the first of its kind) and English local elections.
Although Welsh Labour were the biggest party, they did not gain enough seats to form a majority government and instead entered into coalition with the Liberal Democrats. The election was marked by the historically high level of support for Plaid Cymru, who won their highest share of the vote in any Wales-wide election and remains their highest number of seats in a Senedd election to date. The party won considerable support in traditionally safe Labour areas such as the South Wales Valleys, winning Rhondda and Islwyn and narrowly failing to win a number of other seats.
The overall turnout of voters was 46.3%. [1] This would remain the highest ever turnout for a devolved election in Wales until the 2021 Senedd election, which saw 46.6 of voters cast their ballot. [2]
Parties | Additional member system | Total seats | ||||||||||||||
---|---|---|---|---|---|---|---|---|---|---|---|---|---|---|---|---|
Constituency | Region | |||||||||||||||
Votes | % | +/− | Seats | +/− | Votes | % | +/− | Seats | +/− | Total | +/− | % | ||||
Labour | 384,671 | 37.6 | N/A | 27 | N/A | 361,657 | 35.4 | N/A | 1 | N/A | 28 | N/A | 46.7 | |||
Plaid Cymru | 290,572 | 28.4 | N/A | 9 | N/A | 312,048 | 30.5 | N/A | 8 | N/A | 17 | N/A | 28.3 | |||
Conservative | 162,133 | 15.8 | N/A | 1 | N/A | 168,206 | 16.5 | N/A | 8 | N/A | 9 | N/A | 15.0 | |||
Liberal Democrats | 137,857 | 13.5 | N/A | 3 | N/A | 128,008 | 12.5 | N/A | 3 | N/A | 6 | N/A | 10.0 | |||
Green | 1,002 | 0.1 | N/A | 0 | N/A | 25,858 | 2.5 | N/A | 0 | N/A | 0 | N/A | 0 | |||
Socialist Labour | - | - | - | - | - | 10,720 | 1.0 | N/A | 0 | N/A | 0 | N/A | 0 | |||
Natural Law | - | - | - | - | - | 3,861 | 0.4 | N/A | 0 | N/A | 0 | N/A | 0 | |||
United Socialist | 3,967 | 0.4 | N/A | 0 | N/A | 3,590 | 0.4 | N/A | 0 | N/A | 0 | N/A | 0 | |||
Communist | 609 | 0.1 | N/A | 0 | N/A | 1,366 | 0.1 | N/A | 0 | N/A | 0 | N/A | 0 | |||
Independent | 30,554 | 3.0 | N/A | 0 | N/A | - | - | - | - | - | 0 | N/A | 0 | |||
Independent Labour | 4,134 | 0.4 | N/A | 0 | N/A | - | - | - | - | - | 0 | N/A | 0 | |||
Others | 7,736 | 0.8 | N/A | 0 | N/A | 4,673 | 0.5 | N/A | 0 | N/A | 0 | N/A | 0 | |||
Total | 1,023,225 | 40 | 1,019,987 | 20 | 60 |
Constituency | Elected member | Result | |
---|---|---|---|
Carmarthen East and Dinefwr | Rhodri Glyn Thomas | Plaid Cymru win | |
Carmarthen West and South Pembrokeshire | Christine Gwyther | Labour win | |
Ceredigion | Elin Jones | Plaid Cymru win | |
Llanelli | Helen Mary Jones | Plaid Cymru win | |
Meirionnydd Nant Conwy | Dafydd Elis-Thomas | Plaid Cymru win | |
Montgomeryshire | Mick Bates | Liberal Democrats win | |
Preseli Pembrokeshire | Richard Edwards | Labour win | |
Brecon and Radnorshire | Kirsty Williams | Liberal Democrats win |
Party | Elected candidates | Seats | +/− | Votes | % | +/−% | |
---|---|---|---|---|---|---|---|
Plaid Cymru | Cynog Dafis | 1 | N/A | 84,554 | 38.55% | N/A | |
Labour | Alun Michael | 1 | N/A | 53,842 | 24.55% | N/A | |
Conservative | Nick Bourne Edward Glyn Davies | 2 | N/A | 36,622 | 16.70% | N/A | |
Liberal Democrats | 0 | N/A | 31,683 | 14.44% | N/A | ||
Green | 0 | N/A | 7,718 | 3.52% | N/A | ||
Socialist Labour | 0 | N/A | 3,019 | 1.38% | N/A | ||
Independent | 0 | N/A | 1,214 | 0.55% | N/A | ||
Natural Law | 0 | N/A | 705 | 0.32% | N/A |
Constituency | Elected member | Result | |
---|---|---|---|
Alyn and Deeside | Tom Middlehurst | Labour win | |
Caernarfon | Dafydd Wigley | Plaid Cymru win | |
Clwyd South | Karen Sinclair | Labour win | |
Clwyd West | Alun Pugh | Labour win | |
Conwy | Gareth Jones | Plaid Cymru win | |
Delyn | Alison Halford | Labour win | |
Vale of Clwyd | Margaret Ann Jones | Labour win | |
Wrexham | John Marek | Labour win | |
Ynys Môn | Ieuan Wyn Jones | Plaid Cymru win |
Party | Elected candidates | Seats | +/− | Votes | % | +/−% | |
---|---|---|---|---|---|---|---|
Labour | 0 | N/A | 73,673 | 34.19% | N/A | ||
Plaid Cymru | Janet Ryder | 1 | N/A | 69,518 | 32.26% | N/A | |
Conservative | Rod Richards Peter Rogers | 2 | N/A | 41,700 | 19.35% | N/A | |
Liberal Democrats | Christine Humphreys | 1 | N/A | 22,130 | 10.27% | N/A | |
Green | 0 | N/A | 4,667 | 2.17% | N/A | ||
Rhuddlan Debt Protest Campaign | 0 | N/A | 1,353 | 0.63% | N/A | ||
Natural Law | 0 | N/A | 917 | 0.43% | N/A | ||
Socialist Alliance | 0 | N/A | 828 | 0.38% | N/A | ||
Communist | 0 | N/A | 714 | 0.33% | N/A |
Constituency | Elected member | Result | |
---|---|---|---|
Cardiff South and Penarth | Lorraine Barrett | Labour win | |
Cardiff West | Rhodri Morgan | Labour win | |
Cynon Valley | Christine Chapman | Labour win | |
Pontypridd | Jane Davidson | Labour win | |
Rhondda | Geraint Rhys Davies | Plaid Cymru win | |
Vale of Glamorgan | Jane Hutt | Labour win | |
Cardiff Central | Jennifer Elizabeth Randerson | Liberal Democrats win | |
Cardiff North | Sue Essex | Labour win |
Party | Elected candidates | Seats | +/− | Votes | % | +/−% | |
---|---|---|---|---|---|---|---|
Labour | 0 | N/A | 79,564 | 36.92% | N/A | ||
Plaid Cymru | Pauline Jarman Owen John Thomas | 2 | N/A | 58,080 | 26.95% | N/A | |
Conservative | Jonathan Morgan David Melding | 2 | N/A | 34,944 | 16.22% | N/A | |
Liberal Democrats | 0 | N/A | 30,911 | 14.35% | N/A | ||
Green | 0 | N/A | 5,336 | 2.48% | N/A | ||
Socialist Labour | 0 | N/A | 2,822 | 1.31% | N/A | ||
Independent | 0 | N/A | 1,524 | 0.71% | N/A | ||
Natural Law | 0 | N/A | 665 | 0.31% | N/A | ||
Communist | 0 | N/A | 652 | 0.30% | N/A | ||
Socialist Alliance | 0 | N/A | 602 | 0.28% | N/A | ||
Independent | 0 | N/A | 378 | 0.18% | N/A |
Constituency | Elected member | Result | |
---|---|---|---|
Islwyn | Brian Hancock | Plaid Cymru win | |
Merthyr Tydfil and Rhymney | Huw Lewis | Labour win | |
Monmouth | David Davies | Conservative win | |
Blaenau Gwent | Peter Law | Labour win | |
Newport East | John Griffiths | Labour win | |
Newport West | Rosemary Butler | Labour win | |
Torfaen | Lynne Neagle | Labour win | |
Caerphilly | Ron Davies | Labour win |
Party | Elected candidates | Seats | +/− | Votes | % | +/−% | |
---|---|---|---|---|---|---|---|
Labour | 0 | N/A | 83,953 | 41.82% | N/A | ||
Plaid Cymru | Jocelyn Davies Professor Philip James Stradling Williams | 2 | N/A | 49,139 | 24.48% | N/A | |
Conservative | William Graham | 1 | N/A | 33,947 | 16.91% | N/A | |
Liberal Democrats | Michael James German | 1 | N/A | 24,757 | 12.33% | N/A | |
Socialist Labour | 0 | N/A | 4,879 | 2.43% | N/A | ||
Green | 0 | N/A | 4,055 | 2.02% | N/A |
Constituency | Elected member | Result | |
---|---|---|---|
Aberavon | Brian Gibbons | Labour win | |
Gower | Edwina Hart | Labour win | |
Neath | Gwenda Thomas | Labour win | |
Ogmore | Janice Gregory | Labour win | |
Swansea East | Val Feld | Labour win | |
Swansea West | Andrew Davies | Labour win | |
Bridgend | Carwyn Jones | Labour win |
Party | Elected candidates | Seats | +/− | Votes | % | +/−% | |
---|---|---|---|---|---|---|---|
Labour | 0 | N/A | 70,625 | 42.25% | N/A | ||
Plaid Cymru | Janet Marion Davies Dr David Rees Lloyd | 2 | N/A | 50,757 | 30.37% | N/A | |
Conservative | Alun Cairns | 1 | N/A | 20,993 | 12.56% | N/A | |
Liberal Democrats | Peter Black | 1 | N/A | 18.527 | 11.09% | N/A | |
Green | 0 | N/A | 4,082 | 2.44% | N/A | ||
Socialist Alliance | 0 | N/A | 1,257 | 0.75% | N/A | ||
Natural Law | 0 | N/A | 676 | 0.40% | N/A | ||
People's Representative Party | 0 | N/A | 204 | 0.12% | N/A |
Plaid Cymru is a centre-left to left-wing, Welsh nationalist political party in Wales, committed to Welsh independence from the United Kingdom. It campaigns on a platform of social democracy and civic nationalism. The party is a strong supporter of the European Union and is a member of the European Free Alliance (EFA). The party holds 4 of 32 Welsh seats in the UK Parliament, 12 of 60 seats in the Senedd, and 202 of 1,231 principal local authority councillors. Plaid was formed in 1925 under the name Plaid Genedlaethol Cymru and Gwynfor Evans won the first Westminster seat for the party at the 1966 Carmarthen by-election.
The Senedd, officially known as the Welsh Parliament in English and Senedd Cymru in Welsh, is the devolved, unicameral legislature of Wales. A democratically elected body, it makes laws for Wales, agrees to certain taxes, and scrutinises the Welsh Government. It is a bilingual institution, with both Welsh and English being the official languages of its business. From its creation in May 1999 until May 2020, the Senedd was officially known as the National Assembly for Wales and was often simply called the Welsh Assembly.
The 2003 National Assembly for Wales election was the second general election to the National Assembly for Wales. It was held on 1 May 2003. The election was characterised by a resurgence for the Labour Party, whilst Plaid Cymru saw a reduction in support and the number of Assembly Members they returned. Having won thirty seats, one short of a majority, Labour chose to govern in minority without a coalition partner.
The Wales Green Party is a semi-autonomous political party within the Green Party of England and Wales (GPEW). It covers Wales, and is the only regional party with semi-autonomous status within the GPEW. The Wales Green Party puts up candidates for council, Senedd, and UK Parliament seats.
Politics in Wales forms a distinctive polity in the wider politics of the United Kingdom, with Wales as one of the four constituent countries of the United Kingdom (UK).
Welsh Labour, formerly known as the Labour Party in Wales, is an autonomous section of the United Kingdom Labour Party in Wales and the largest party in modern Welsh politics. Welsh Labour and its forebears have won a plurality of the Welsh vote at every UK general election since 1922, every Assembly and Senedd election since 1999, and all elections to the European Parliament in the period 1979–2004 and in 2014. Welsh Labour holds 27 of the 32 Welsh seats in the UK Parliament, 30 of the 60 seats in the Welsh Senedd and 576 of the 1,264 councillors in principal local authorities including overall control of 10 of the 22 principal local authorities.
There are four types of elections in Wales: elections to the House of Commons of the United Kingdom, elections to the devolved Senedd, local elections to community councils and the 22 principal areas, and the police and crime commissioner elections. In addition there are by-elections for each aforementioned election. Elections are held on Election Day, which is conventionally a Thursday. Three of these four types of elections are held after fixed periods; the exception is UK general elections, the timing of which is at the discretion of the prime minister of the United Kingdom. Senedd elections may be postponed to avoid elections to the UK parliament and Senedd coinciding with each other.
Cardiff Central is a constituency of the Senedd. It elects one Member of the Senedd by the first past the post method of election. Also, however, it is one of eight constituencies in the South Wales Central electoral region, which elects four additional members, in addition to eight constituency members, to produce a degree of proportional representation for the region as a whole.
Welsh independence is the political movement advocating for Wales to become a sovereign state, independent from the United Kingdom.
The Welsh Conservatives, also known as the Welsh Conservative Party, is the branch of the United Kingdom Conservative Party that operates in Wales. At Westminster elections, it is the second-most popular political party in Wales by vote share, having obtained the second-largest share of the vote at every general election since 1931. In Senedd elections, the Conservatives are currently the second-most supported party but have at times been third. As of 2024, they hold none of the 32 Welsh seats in the Parliament of the United Kingdom, and 16 of the 60 seats in the Senedd.
The 2011 National Assembly for Wales election was an election for the National Assembly. The poll was held on 5 May 2011 and decided the incumbency for all the Assembly's seats. It was the fourth election for seats in the National Assembly for Wales, and the second election taken under the rules of the Government of Wales Act 2006.
Politics of Cardiff refers to the political representation of the city of Cardiff, capital of Wales. Cardiff is represented politically at a local, Wales and United Kingdom level and previously at the European level.
The 2007 National Assembly for Wales election was held on Thursday 3 May 2007 to elect members to the National Assembly for Wales. It was the third general election. On the same day local elections in England and Scotland, as well as the Scottish Parliament election took place. This election was preceded by the previous Assembly election in 2003.
The 2016 National Assembly for Wales election was held on Thursday 5 May 2016, to elect members (AMs) of the National Assembly for Wales, now known as the Senedd. It was the fifth election for the National Assembly, the third election taken under the rules of the Government of Wales Act 2006 and the first since the Wales Act 2014.
Unionism in Wales is the political view that supports a political union between Wales and the other countries of the United Kingdom. As well as the current state of the UK, unionism may also include support for Federalism in the United Kingdom and a United Kingdom Confederation.
This is a list of Assembly Memberselected to the fifth National Assembly for Wales at the 2016 election. In May 2020, the representatives were renamed to Members of the Seneddin the fifth Senedd, they would be known as the fifth Senedd for the remainder of their term. From the 2021 election members would be elected under this new title of Senedd. There are a total of 60 members elected, 40 were elected from first past the post constituencies with a further 20 members being returned from five regions, each electing four AMs through mixed member proportional representation. In between elections, members of the legislature may not necessarily be of the same party or the same candidate elected in 2016.
The 2021 Senedd election took place on Thursday 6 May 2021 to elect 60 members to the Senedd. It was the sixth devolved general election since the Senedd was established in 1999. The election was held alongside the Scottish Parliament election, English local elections, London Assembly and mayoral election and the Hartlepool by-election.
In the Senedd, the Leader of the Opposition is the leader of the Official Opposition, the largest political party that is not in the Welsh Government. The Leader of the Opposition leads and appoints members of the Shadow Cabinet and as such is sometimes styled as the Shadow First Minister of Wales.
In the run-up to the 2021 Senedd election, various organisations carried out opinion polling to gauge voting intentions. Results of such polls are displayed in this list. Most of the pollsters listed are members of the British Polling Council (BPC) and abide by its disclosure rules.