| |||||||||||||||||||||||||||||||||||||
81 seats to the European Parliament | |||||||||||||||||||||||||||||||||||||
---|---|---|---|---|---|---|---|---|---|---|---|---|---|---|---|---|---|---|---|---|---|---|---|---|---|---|---|---|---|---|---|---|---|---|---|---|---|
Turnout | 32.6% (0.2%) | ||||||||||||||||||||||||||||||||||||
| |||||||||||||||||||||||||||||||||||||
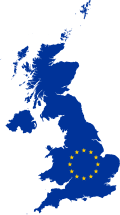
Colours denote the winning party, as shown in the main table of results. | |||||||||||||||||||||||||||||||||||||
Part of a series of articles on |
UK membership of the European Union (1973–2020) |
---|
The 1984 European Parliament election was the second European election to be held in the United Kingdom. It was held on 14 June. The electoral system was First Past the Post in England, Scotland and Wales and Single transferable vote in Northern Ireland. The turnout was again the lowest in Europe. In England, Scotland and Wales, the Liberal Party and Social Democratic Party were in alliance, collecting 2,591,635 votes but not a single seat.
The election represented a small recovery for Labour, under Michael Foot's replacement Neil Kinnock, taking 15 seats from the Conservatives. In the general election of 1983, they had only had a vote share of 2% more than the SDP–Liberal Alliance (although they had nearly 10 times more MP's elected) and 15% less than the Conservatives. This was the last European election in the UK in which the governing party won a majority of seats.
A by-election to the British Parliament also took place on the same day in the Portsmouth South constituency - the Alliance gained the seat from the Conservatives.
Source: UK Parliament briefing
Party | Votes won | % of vote | Loss/Gain | Seats | % of seats | Loss/Gain | |
---|---|---|---|---|---|---|---|
Conservative | 5,426,866 | 38.8 | 9.6 | 45 | 55.6 | 15 | |
Labour | 4,865,224 | 34.8 | 3.1 | 32 | 39.5 | 15 | |
Alliance | 2,591,659 | 18.5 | 5.9 | 0 | |||
SNP | 230,594 | 1.6 | 0.2 | 1 | 1.2 | ||
DUP | 230,251 | 1.6 | 0.4 | 1 | 1.2 | ||
SDLP | 151,399 | 1.1 | 1 | 1.2 | |||
UUP | 147,169 | 1.1 | 0.1 | 1 | 1.2 | ||
Plaid Cymru | 103,031 | 0.8 | 0.1 | 0 | |||
Sinn Féin | 91,476 | 0.7 | New | 0 | |||
Ecology | 73,025 | 0.5 | 0.4 | 0 | |||
Alliance | 34,046 | 0.2 | 0 | ||||
UPUP | 20,092 | 0.1 | New | 0 | |||
Independent | 11,073 | 0.1 | 0.1 | 0 | |||
Workers' Party | 8,712 | 0.1 | 0 | ||||
Independent Ecology | 3,330 | 0.0 | New | 0 | |||
Ind. Conservative | 3,249 | 0.0 | 0 | ||||
Ind. Liberal | 2,981 | 0.0 | New | 0 | |||
Wessex Regionalist | 2,365 | 0.0 | New | 0 | |||
Cornish Nationalist | 1,892 | 0.0 | New | 0 | |||
Federal Republican Party | 1,494 | 0.0 | New | 0 |
Source: UK Parliament briefing
Party | Votes won | % of vote | Loss/Gain | Seats | % of seats | Loss/Gain | |
---|---|---|---|---|---|---|---|
Conservative | 5,426,866 | 40.8 | 9.8 | 45 | 57.7 | 15 | |
Labour | 4,865,224 | 36.5 | 3.5 | 32 | 41.0 | 15 | |
Alliance | 2,591,659 | 19.5 | 6.3 | 0 | |||
SNP | 230,594 | 1.7 | 0.2 | 1 | 1.3 | ||
Plaid Cymru | 103,031 | 0.8 | 0.1 | 0 | |||
Ecology | 70,853 | 0.5 | 0.4 | 0 | |||
Independent | 11,073 | 0.1 | 0.1 | 0 | |||
Independent Ecology | 3,330 | 0.0 | New | 0 | |||
Ind. Conservative | 3,249 | 0.0 | 0 | ||||
Ind. Liberal | 2,981 | 0.0 | New | 0 | |||
Wessex Regionalist | 2,365 | 0.0 | New | 0 | |||
Cornish Nationalist | 1,892 | 0.0 | New | 0 | |||
Federal Republican Party | 1,494 | 0.0 | New | 0 |
Total votes cast – 13,312,898. All parties listed.
Source: Northern Ireland Social and Political Archive
Party | Candidate | FPv% | Count | ||||
---|---|---|---|---|---|---|---|
1 | 2 | 3 | 4 | ||||
DUP | Ian Paisley | 33.6 | 230,251 | ||||
UUP | John Taylor | 21.5 | 147,169 | 185,714 | |||
SDLP | John Hume | 22.1 | 151,399 | 151,664 | 156,310 | 183,256 | |
Sinn Féin | Danny Morrison | 13.3 | 91,476 | 91,525 | 92,644 | 93,079 | |
Alliance | David Cook | 5.0 | 34,046 | 34,892 | 37,401 | ||
UPUP | James Kilfedder | 2.9 | 20,092 | 38,293 | 38,854 | ||
Workers' Party | Seamus Lynch | 1.3 | 8,712 | 8,813 | |||
Ecology | Colin McGuigan | 0.3 | 2,172 | 2,236 | |||
Electorate: 1,065,363 Valid: 685,317 Spoilt: 11,654 Quota: 171,330 Turnout: 696,994 |
The 2001 United Kingdom general election was held on Thursday 7 June 2001, four years after the previous election on 1 May 1997, to elect 659 members to the House of Commons. The governing Labour Party led by the prime minister Tony Blair was re-elected to serve a second term in government with another landslide victory with a 165-seat majority, returning 412 members of Parliament versus 418 from the previous election, a net loss of six seats, although with a significantly lower turnout than before—59.4%, compared to 71.6% at the previous election.
The United Kingdom is a constitutional monarchy which, by legislation and convention, operates as a unitary parliamentary democracy. A hereditary monarch, currently King Charles III, serves as head of state while the Prime Minister of the United Kingdom, currently Sir Keir Starmer since 2024, serves as the elected head of government.
The 1979 European Parliament election, was the first European election to be held in the United Kingdom after the European Communities (EC) decided to directly elect representatives to the European Parliament. It was held on 7 June. Elections were also held in eight other EC states. European elections were incorporated into UK law by the European Assembly Elections Act 1978. Out of the 410 members of the European Parliament, 81 were elected from the UK. The electoral system was First past the post in England, Scotland and Wales and Single Transferable Vote in Northern Ireland.
The 1989 European Parliament election, was the third European election to be held in the United Kingdom. It was held on 15 June. The electoral system was First-past-the-post voting in England, Scotland and Wales and Single transferable vote in Northern Ireland. The turnout was again the lowest in Europe.
The 1994 European Parliament election was the fourth European election to be held in the United Kingdom. It was held on Thursday 9 June, though, as usual, the ballots were not counted until the evening of Sunday 12 June. The electoral system was, for the final European election, first past the post in England, Scotland and Wales and single transferable vote in Northern Ireland. This was the first election with 87 MEPs, the European Parliamentary Elections Act 1993 having increased the number of seats for the UK from 81. For the first time, the UK did not have the lowest turnout in Europe. Turnout was lower in the Netherlands and Portugal.
The 1999 European Parliament election was the United Kingdom's part of the European Parliament election 1999. It was held on 10 June 1999. Following the European Parliamentary Elections Act 1999, it was the first European election to be held in the United Kingdom where the whole country used a system of proportional representation. In total, 87 Members of the European Parliament were elected from the United Kingdom across twelve new regional constituencies.
The 2004 European Parliament election was the United Kingdom's part of the wider 2004 European Parliament election which was held between 10 and 13 June 2004 in the 25 member states of the European Union. The United Kingdom's part of this election was held on Thursday 10 June 2004. The election also coincided with the 2004 local elections and the London Assembly and mayoral elections. In total, 78 Members of the European Parliament were elected from the United Kingdom using proportional representation.
Unionism in Scotland is a political movement which favours the continuation of the political union between Scotland and the other countries of the United Kingdom, and hence is opposed to Scottish independence. Scotland is one of four countries of the United Kingdom which has its own devolved government and Scottish Parliament, as well as representation in the UK Parliament. There are many strands of political Unionism in Scotland, some of which have ties to Unionism and Loyalism in Northern Ireland. The two main political parties in the UK — the Conservatives and Labour — both support Scotland remaining part of the UK.
The 2005 United Kingdom general election was held on Thursday 5 May 2005, to elect 646 members to the House of Commons. The governing Labour Party led by the prime minister Tony Blair won its third consecutive victory, with Blair becoming the second Labour leader after Harold Wilson to form three majority governments. However, its majority fell to 66 seats; the majority it won four years earlier had been of 167 seats. The UK media interpreted the results as an indicator of a breakdown in trust in the government, and especially in Blair.
The 2010 United Kingdom general election was held on Thursday 6 May 2010, to elect Members of Parliament to the House of Commons. The election took place in 650 constituencies across the United Kingdom under the first-past-the-post system. The election resulted in a large swing to the opposition Conservative Party led by David Cameron similar to that seen in 1979, the last time a Conservative opposition had ousted a Labour government. The governing Labour Party led by the prime minister Gordon Brown lost the 66-seat majority it had previously enjoyed, but no party achieved the 326 seats needed for a majority. The Conservatives won the most votes and seats, but still fell 20 seats short. This resulted in a hung parliament where no party was able to command a majority in the House of Commons. This was only the second general election since the Second World War to return a hung parliament, the first being the February 1974 election. This election marked the start of Conservative government for the next 14 years.
This is an overview of United Kingdom general election results since 1922. The 1922 election was the first election in the new United Kingdom of Great Britain and Northern Ireland, after the creation of the Irish Free State removed Southern Ireland from the UK.
The 2009 European Parliament election was the United Kingdom's component of the 2009 European Parliament election, the voting for which was held on Thursday 4 June 2009. The election was held concurrently with the 2009 local elections in England. In total, 72 Members of the European Parliament were elected from the United Kingdom using proportional representation.
The 1984 European Parliament election was the first since the inaugural election of 1979 and the 1981 enlargement of the European Community to include Greece. It was also the last before the accession of Spain and Portugal in 1986.
There are five types of elections in the United Kingdom: elections to the House of Commons of the United Kingdom, elections to devolved parliaments and assemblies, local elections, mayoral elections, and Police and Crime Commissioner elections. Within each of those categories, there may also be by-elections. Elections are held on Election Day, which is conventionally a Thursday, and under the provisions of the Dissolution and Calling of Parliament Act 2022 the timing of general elections can be held at the discretion of the prime minister during any five-year period. All other types of elections are held after fixed periods, though early elections to the devolved assemblies and parliaments can occur in certain situations. The five electoral systems used are: the single member plurality system (first-past-the-post), the multi-member plurality, the single transferable vote, the additional member system, and the supplementary vote.
The 2014 European Parliament election was the United Kingdom's component of the 2014 European Parliament election, held on Thursday 22 May 2014, coinciding with the 2014 local elections in England and Northern Ireland. In total, 73 Members of the European Parliament were elected from the United Kingdom using proportional representation. England, Scotland and Wales use a closed-list party list system of PR, while Northern Ireland used the single transferable vote (STV).
The 2015 United Kingdom general election was held on Thursday, 7 May 2015 to elect 650 members of Parliament (MPs) to the House of Commons. The Conservative Party, led by prime minister David Cameron, won a unexpected majority victory of ten seats; they had been leading a coalition government with the Liberal Democrats. It was the last general election to be held before the UK voted to leave the European Union (EU) in June 2016.
The 2019 European Parliament election was the United Kingdom's component of the 2019 European Parliament election. It was held on Thursday 23 May 2019 and the results announced on Sunday 26 and Monday 27 May 2019, after all the other EU countries had voted. This was the United Kingdom's final participation in a European Parliament election before leaving the European Union on 31 January 2020; it was also the last election to be held under the provisions of the European Parliamentary Elections Act 2002 before its repeal under the European Union (Withdrawal) Act 2018, and was the first European election in the United Kingdom since 1999 to be held on a day that did not coincide with any local elections. This was the first of two national elections held in the United Kingdom in 2019; the 2019 general election occurred six-and-a-half months later in December 2019.
3,303 candidates stood in the United Kingdom general election of 2017, which was held on 8 June 2017. The deadline for parties and individuals to file candidate nomination papers to the acting returning officer was 16:00 on 11 May 2017.
This is an annotated list of notable records from United Kingdom elections to the European Parliament, which were held from 1979 through 2019.
The 2019 United Kingdom general election was held on 12 December 2019 to elect all 650 members of the House of Commons, including the 40 Welsh seats.