1985 United Kingdom local elections

Last updated

1985 United Kingdom local elections
Flag of the United Kingdom.svg
  1984 2 May 1985 (England & Wales)
15 May 1985 (Northern Ireland)
1986  

All 39 non-metropolitan counties, 1 sui generis authority,
all 26 Northern Irish districts and all 8 Welsh counties
 Majority partyMinority partyThird party
 
Margaret Thatcher (1983).jpg
Start campagne voor Europese verkiezingen van PvdA (Rotterdam) Neal Kinnoch , k, Bestanddeelnr 932-9811.jpg
DavidSteel1987 cropped.jpg
David Owen-1.jpg
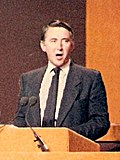
Leader Margaret Thatcher Neil Kinnock David Steel
and David Owen
Party Conservative Labour Alliance
Percentage32%39%26%
Councillors10,1918,7462,633
Councillors +/-Decrease2.svg 202Decrease2.svg 124Increase2.svg 302

United Kingdom local elections, 1985.svg
Colours denote the winning party, as shown in the main table of results.

Local elections were held in the United Kingdom in 1985. [1] [2] [3] [4] The projected share of the vote was Labour 39%, Conservative 32%, Liberal-SDP Alliance 26%. Labour had the largest share of the vote in local council elections for the first time since 1981.

Contents

Both Conservatives and Labour lost some seats to the Liberal-SDP Alliance, who were rebuilding under the leadership of David Owen and enjoying strong showings (including a brief lead) in the opinion polls.

The overall results were as follows;

Conservative losses: 202
Number of Conservative councillors: 10,191

Labour losses: 124
Number of Labour councillors: 8,746

Liberal-SDP Alliance gains: 302
Number of Liberal-SDP Alliance councillors: 2,633

Summary of results

Alan Clark, writing in his diary for 11 May 1985, shortly after the election, stated: "Some stupid prick has done a 'projection' in one of the heavies showing that the SDP will have a massive overall majority in the House of Commons.." [5]

England

Non-metropolitan county councils

CouncilPrevious controlResultDetails
Avon Labour No overall control gain Details
Bedfordshire No overall control No overall control hold Details
Berkshire No overall control Conservative gain Details
Buckinghamshire Conservative Conservative hold Details
Cambridgeshire Conservative No overall control gain Details
Cheshire No overall control No overall control hold Details
Cleveland Labour Labour hold Details
Cornwall Independent No overall control gain Details
Cumbria Labour No overall control gain Details
Derbyshire Labour Labour hold Details
Devon Conservative No overall control gain Details
Dorset Conservative Conservative hold Details
Durham Labour Labour hold Details
East Sussex Conservative No overall control gain Details
Essex Conservative No overall control gain Details
Gloucestershire No overall control No overall control hold Details
Hampshire Conservative No overall control gain Details
Hereford and Worcester Conservative Conservative hold Details
Hertfordshire Conservative No overall control gain Details
Humberside Labour No overall control gain Details
Isle of Wight Alliance Alliance hold Details
Kent Conservative Conservative hold Details
Lancashire Labour No overall control gain Details
Leicestershire No overall control No overall control hold Details
Lincolnshire Conservative Conservative hold Details
Norfolk Conservative Conservative hold Details
North Yorkshire Conservative No overall control gain Details
Northamptonshire No overall control No overall control hold Details
Northumberland Labour No overall control gain Details
Nottinghamshire Labour Labour hold Details
Oxfordshire Conservative No overall control gain Details
Shropshire No overall control No overall control hold Details
Somerset Conservative No overall control gain Details
Staffordshire Labour Labour hold Details
Suffolk Conservative Conservative hold Details
Surrey Conservative Conservative hold Details
Warwickshire No overall control No overall control hold Details
West Sussex Conservative Conservative hold Details
Wiltshire Conservative No overall control gain Details

‡ New electoral division boundaries

Sui generis

CouncilPrevious controlResultDetails
Isles of Scilly Details

Northern Ireland

CouncilPrevious controlResultDetails
Antrim No overall control No overall control Details
Ards No overall control No overall control Details
Armagh No overall control Ulster Unionist Details
Ballymena DUP DUP Details
Ballymoney No overall control No overall control Details
Banbridge Ulster Unionist Ulster Unionist Details
Belfast No overall control No overall control Details
Carrickfergus No overall control No overall control Details
Castlereagh No overall control No overall control Details
Coleraine No overall control No overall control Details
Cookstown No overall control No overall control Details
Craigavon No overall control No overall control Details
Derry SDLP No overall control Details
Down No overall control No overall control Details
Dungannon No overall control No overall control Details
Fermanagh No overall control No overall control Details
Larne No overall control No overall control Details
Limavady No overall control No overall control Details
Lisburn No overall control No overall control Details
Magherafelt No overall control No overall control Details
Moyle No overall control No overall control Details
Newry and Mourne SDLP No overall control Details
Newtownabbey No overall control No overall control Details
North Down No overall control No overall control Details
Omagh No overall control No overall control Details
Strabane No overall control No overall control Details

Wales

County councils

CouncilPrevious controlResultDetails
Clwyd No overall control No overall control hold Details
Dyfed No overall control No overall control hold Details
Gwent Labour Labour hold Details
Gwynedd Independent Independent hold Details
Mid Glamorgan Labour Labour hold Details
Powys Independent Independent hold Details
South Glamorgan Labour Labour hold Details
West Glamorgan Labour Labour hold Details

Related Research Articles

<span class="mw-page-title-main">1993 United Kingdom local elections</span>

Local elections were held in the United Kingdom in 1993. The results showed a decline for the governing Conservative Party with the third placed party, the Liberal Democrats, gaining most seats.

<span class="mw-page-title-main">1990 United Kingdom local elections</span>

Local elections were held in the United Kingdom on 3 May 1990. They were the last local elections held before the resignation of Prime Minister Margaret Thatcher in November 1990.

<span class="mw-page-title-main">1974 United Kingdom local elections</span>

Local elections were held in the United Kingdom in 1974, during the life of the minority Labour government of Harold Wilson. Elections were held in all the boroughs of London.

<span class="mw-page-title-main">1977 United Kingdom local elections</span>

Local elections were held in the United Kingdom in 1977. The results were a major mid-term setback for the Labour government, and the Conservatives, the main opposition, comprehensively regained control of the Greater London Council with 64 seats against Labour's 28. Elections were also held in the county councils and in Northern Ireland.

<span class="mw-page-title-main">1979 United Kingdom local elections</span>

Local elections were held in the United Kingdom on 3 May 1979. The results provided some source of comfort to the Labour Party, who recovered some lost ground from local election reversals in previous years, despite losing the general election to the Conservative Party on the same day. The Liberals also gained councillors and a council.

<span class="mw-page-title-main">1980 United Kingdom local elections</span>

Local elections were held in the United Kingdom in 1980. These were the first annual local elections for the new Conservative Prime Minister Margaret Thatcher. Though the Conservatives in government lost seats, the projected share of the vote was close: Labour Party 42%, Conservative Party 40%, Liberal Party 13%. Labour were still being led by the former prime minister James Callaghan, who resigned later in the year to be succeeded by Michael Foot.

<span class="mw-page-title-main">1981 United Kingdom local elections</span>

Local elections were held in the United Kingdom in May 1981. The results were a mid-term setback for the Conservative government, which lost 1,193 seats, leaving them with 10,545 councillors. The projected share of the vote was more respectable for the government, however: Labour 41%, Conservatives 38%, Liberals 17%. This was in spite of opinion polls showing a much wider Labour lead over the Conservatives. These were the first elections to be contested by Labour under the leadership of Michael Foot, who had succeeded James Callaghan in late 1980.

<span class="mw-page-title-main">1982 United Kingdom local elections</span>

Local elections were held in the United Kingdom in 1982. The elections coincided with rising popularity of the Conservative government and Prime Minister Margaret Thatcher, which was mostly attributed to the Falklands War. The projected share of the vote was Conservatives 40%, Labour 29%, Liberal-SDP Alliance 27%.

<span class="mw-page-title-main">1983 United Kingdom local elections</span>

Local elections were held in the United Kingdom in 1983. The results were a success for Conservative Prime Minister Margaret Thatcher, who soon afterwards called a general election in which the Conservatives won a landslide victory. The projected share of the vote was Conservative 39%, Labour Party 36%, Liberal-SDP Alliance 20%.

<span class="mw-page-title-main">1984 United Kingdom local elections</span>

Local elections were held in the United Kingdom in 1984. There was a slight reversal in the Conservative government's fortunes, but the party remained ahead. The projected share of the vote was Conservatives 38%, Labour 37%, Liberal-SDP Alliance 21%.

<span class="mw-page-title-main">1986 United Kingdom local elections</span>

Local elections were held in the United Kingdom in 1986. There was a 3% reduction in the number of councillors, owing to the abolition of the Greater London Council and the Metropolitan County Councils.

<span class="mw-page-title-main">1987 United Kingdom local elections</span>

Local elections were held in the United Kingdom in 1987. The projected share of the vote was Conservatives 38%, Labour 32%, Liberal-SDP Alliance 27%. It was the first time since 1983 that the Conservatives had enjoyed the largest share of the vote in local council elections.

<span class="mw-page-title-main">1988 United Kingdom local elections</span>

Local elections were held in the United Kingdom in 1988. The Conservative government held its ground and remained ahead in the projected popular vote.

<span class="mw-page-title-main">1984 Bolton Metropolitan Borough Council election</span>

The 1984 Bolton Metropolitan Borough Council election took place on 3 May 1984 to elect members of Bolton Metropolitan Borough Council in Greater Manchester, England. One third of the council was up for election and the Labour Party kept overall control of the council

The 1992 York City Council election was held in May 1992 to elect members of York City Council in North Yorkshire, England. Fifteen seats, previously contested in 1988, were up for election: eleven were won by the Labour Party, three by the Conservative Party and one by the Liberal Democrats. The Labour Party retained overall control of the council; the composition of the council after the election was: Labour Party 34 seats, Conservative Party seven seats and Liberal Democrats four seats.

<span class="mw-page-title-main">2007 North Warwickshire Borough Council election</span>

On 3 May 2007, an election was held to elect councillors to the North Warwickshire Borough Council on the same day as other local elections in the UK. It resulted in the Conservative Party gaining control of the council. The previous election resulted in no overall control with the Labour Party having the highest number of seats at 16.

<span class="mw-page-title-main">2003 North Warwickshire Borough Council election</span>

On 1 May 2003, an election was held to elect councillors to the North Warwickshire Borough Council on the same day as other local elections in the UK. It was the first election to take place under the new ward boundaries, with one extra seat from the previous 34 seats added. All 35 seats were up for election and the result was no overall control with the Labour Party having the most seats at 16. The previous election had resulted in the council being controlled by Labour.

<span class="mw-page-title-main">1999 North Warwickshire Borough Council election</span>

On 6 May 1999, an election was held to elect councillors to the North Warwickshire Borough Council on the same day as other local elections in the UK. It resulted in the Labour Party keeping control of the council. All 34 seats were up for election in all wards.

The 1983 Cheltenham Borough Council election took place on 5 May 1983 to elect members of Cheltenham Borough Council in Gloucestershire, England. The whole council was up for election on new boundaries. The Conservatives fell one seat short of a majority, meaning the council stayed in no overall control.

The 1984 Cheltenham Council election took place on 3 May 1984 to elect members of Cheltenham Borough Council in Gloucestershire, England. One third of the council was up for election. The SDP–Liberal Alliance became the largest party, but the council stayed in no overall control.

References

  1. Rallings, Colin; Thrasher, Michael. Local Elections Handbook 1985, Volume 1. The Elections Centre. Retrieved 3 May 2016.
  2. Rallings, Colin; Thrasher, Michael. Local Elections Handbook 1985, Volume 2. The Elections Centre. Retrieved 3 May 2016.
  3. Rallings, Colin; Thrasher, Michael. Local Elections Handbook 1985, Volume 3. The Elections Centre. Retrieved 3 May 2016.
  4. "Council compositions". The Elections Centre. Retrieved 3 May 2016.
  5. Diaries, Alan Clark Phoenix 1994, pp 112