| |||||||||||||||||||||||||||||||||||||||||||||||||||||
All 23 seats to Fermanagh District Council 12 seats needed for a majority | |||||||||||||||||||||||||||||||||||||||||||||||||||||
---|---|---|---|---|---|---|---|---|---|---|---|---|---|---|---|---|---|---|---|---|---|---|---|---|---|---|---|---|---|---|---|---|---|---|---|---|---|---|---|---|---|---|---|---|---|---|---|---|---|---|---|---|---|
|
Elections to Fermanagh District Council were held on 15 May 1985 on the same day as the other Northern Irish local government elections. The election used four district electoral areas to elect a total of 23 councillors.
Party | Seats | Gains | Losses | Net gain/loss | Seats % | Votes % | Votes | +/− | |
---|---|---|---|---|---|---|---|---|---|
Ulster Unionist | 8 | 0 | 0 | ![]() | 34.8 | 33.0 | 10,294 | ![]() | |
Sinn Féin | 8 | 8 | 0 | ![]() | 17.4 | 25.2 | 7,855 | New | |
SDLP | 4 | 0 | 0 | ![]() | 21.7 | 16.8 | 5,263 | ![]() | |
DUP | 2 | 0 | 0 | ![]() | 8.7 | 13.0 | 4,069 | ![]() | |
Irish Independence | 1 | 0 | 3 | ![]() | 4.3 | 6.8 | 2,130 | ![]() | |
Alliance | 0 | 0 | 0 | ![]() | 0.0 | 1.8 | 552 | ![]() | |
Independent Nationalist | 0 | 0 | 1 | ![]() | 0.0 | 1.5 | 465 | ![]() | |
Workers' Party | 0 | 0 | 0 | ![]() | 0.0 | 1.3 | 405 | New | |
Independent Socialist | 0 | 0 | 0 | ![]() | 0.0 | 0.4 | 113 | ![]() | |
Independent | 0 | 0 | 0 | ![]() | 0.0 | 0.2 | 74 | ![]() |
Note: "Votes" are the first preference votes.
Ward | % | Cllrs | % | Cllrs | % | Cllrs | % | Cllrs | % | Cllrs | % | Cllrs | Total Cllrs |
---|---|---|---|---|---|---|---|---|---|---|---|---|---|
UUP | Sinn Féin | SDLP | DUP | IIP | Others | ||||||||
Enniskillen | 36.7 | 3 | 17.9 | 2 | 15.1 | 1 | 16.4 | 1 | 4.7 | 0 | 9.2 | 0 | 7 |
Erne East | 31.6 | 2 | 37.4 | 3 | 17.3 | 1 | 9.4 | 0 | 2.9 | 0 | 1.4 | 0 | 6 |
Erne North | 35.9 | 2 | 11.9 | 1 | 22.9 | 1 | 21.7 | 1 | 4.7 | 0 | 2.9 | 0 | 5 |
Erne West | 27.3 | 1 | 31.9 | 2 | 13.4 | 1 | 5.5 | 0 | 15.6 | 1 | 6.3 | 0 | 5 |
Total | 33.0 | 8 | 25.2 | 8 | 16.8 | 4 | 13.0 | 2 | 6.8 | 1 | 5.2 | 0 | 23 |
1985: 3 x UUP, 2 x Sinn Féin, 1 x DUP, 1 x SDLP
Party | Candidate | FPv% | Count | ||||||||||||||
---|---|---|---|---|---|---|---|---|---|---|---|---|---|---|---|---|---|
1 | 2 | 3 | 4 | 5 | 6 | 7 | 8 | 9 | 10 | 11 | 12 | 13 | 14 | ||||
Ulster Unionist | Raymond Ferguson * | 12.67% | 1,169 | ||||||||||||||
Ulster Unionist | Samuel Foster * | 11.72% | 1,082 | 1,082 | 1,082 | 1,082 | 1,082 | 1,143 | 1,149.51 | 1,153.52 | 1,416.52 | ||||||
Sinn Féin | Pat Cox | 9.59% | 885 | 900 | 915 | 936 | 1,096 | 1,099 | 1,099 | 1,107 | 1,108 | 1,108 | 1,159 | ||||
DUP | Roy Coulter* | 9.73% | 898 | 898 | 898 | 898 | 899 | 909 | 909.26 | 910.26 | 973.56 | 989.56 | 991.57 | 1,512.57 | |||
Ulster Unionist | William Hetherington* | 7.56% | 698 | 700 | 700 | 702 | 702 | 720 | 720.95 | 722.95 | 863.72 | 1,076.72 | 1,088.75 | 1,205.75 | |||
SDLP | James Lunny* | 3.88% | 358 | 359 | 379 | 468 | 504 | 531 | 531.02 | 733.02 | 734.02 | 736.02 | 907.02 | 908.16 | 928.16 | 934.16 | |
Sinn Féin | Tommy Maguire | 8.32% | 768 | 776 | 804 | 808 | 842 | 842 | 842 | 845 | 845 | 845 | 923 | 923 | 924 | 924 | |
SDLP | James Donnelly | 4.45% | 411 | 413 | 419 | 468 | 507 | 537 | 537 | 768 | 771 | 774 | 867.02 | 868.09 | 891.09 | 899.09 | |
DUP | Ivan Foster | 6.63% | 612 | 612 | 612 | 612 | 612 | 622 | 623.08 | 623.08 | 657.44 | 663.44 | 668.45 | ||||
Workers' Party | Davy Kettyles | 4.39% | 405 | 429 | 446 | 448 | 467 | 538 | 538.1 | 578.12 | 581.12 | 584.12 | |||||
Ulster Unionist | Norman Brown* | 4.79% | 442 | 443 | 443 | 443 | 443 | 522 | 524.63 | 525.63 | |||||||
SDLP | Eileen Flanagan | 3.92% | 362 | 363 | 369 | 445 | 471 | 510 | 516.04 | ||||||||
Alliance | William Barbour | 3.95% | 365 | 370 | 371 | 372 | 376 | ||||||||||
Irish Independence | Anthony Cox* | 2.54% | 234 | 237 | 340 | 357 | |||||||||||
SDLP | Seamus Rogers | 2.88% | 266 | 266 | 266 | ||||||||||||
Irish Independence | Patrick O'Reilly* | 2.17% | 200 | 204 | |||||||||||||
Independent | Floyd Maguire | 0.80% | 74 | ||||||||||||||
Electorate: 11,942 Valid: 9,229 (77.28%) Spoilt: 130 Quota: 1,154 Turnout: 9,359 (78.37%) |
1985: 3 x Sinn Féin, 2 x UUP, 1 x SDLP
Party | Candidate | FPv% | Count | ||||||||||||
---|---|---|---|---|---|---|---|---|---|---|---|---|---|---|---|
1 | 2 | 3 | 4 | 5 | 6 | 7 | 8 | 9 | 10 | 11 | 12 | ||||
Ulster Unionist | Cecil Noble* | 15.51% | 1,279 | ||||||||||||
SDLP | Fergus McQuillan* | 8.11% | 669 | 669.14 | 682.14 | 683.14 | 733.14 | 885.14 | 1,374.14 | ||||||
Ulster Unionist | Albert Liddle | 8.24% | 680 | 732.57 | 733.64 | 744.06 | 744.06 | 746.06 | 747.06 | 748.06 | 1,374.06 | ||||
Sinn Féin | Plunket O'Neill | 12.11% | 999 | 999 | 1,014 | 1,014 | 1,060 | 1,070 | 1,079 | 1,103 | 1,106 | 1,106.37 | 1,554.37 | ||
Sinn Féin | Thomas Murray | 9.02% | 744 | 744 | 745 | 745 | 760 | 760 | 817 | 887 | 888 | 888.37 | 1,013.74 | 1,168.54 | |
Sinn Féin | Vincent McCaffrey | 8.23% | 679 | 679 | 683 | 683 | 721 | 725 | 765 | 810 | 813 | 813.74 | 832.88 | 1,151.58 | |
DUP | William Mitchell | 7.04% | 581 | 588.21 | 588.21 | 756.42 | 756.42 | 756.42 | 756.42 | 758.42 | 808.57 | 1,000.6 | 1,001.97 | 1,001.97 | |
Sinn Féin | John McCusker* | 8.05% | 664 | 664.14 | 671.14 | 671.14 | 697.14 | 703.14 | 717.14 | 755.14 | 756.14 | 757.25 | |||
Ulster Unionist | Thomas Johnston | 7.82% | 645 | 672.51 | 673.58 | 689.07 | 689.07 | 691.07 | 696.07 | 705.07 | |||||
SDLP | James Goodwin | 5.97% | 492 | 492 | 503 | 504 | 519 | 651 | |||||||
SDLP | John Reihill | 3.20% | 264 | 264.07 | 294.07 | 294.07 | 329.07 | ||||||||
Irish Independence | John McMahon* | 2.92% | 241 | 241 | 264 | 264 | |||||||||
DUP | Caroline Madill | 2.40% | 198 | 199.12 | 199.12 | ||||||||||
Independent Socialist | Seamus Mullan | 1.37% | 113 | 113.14 | |||||||||||
Electorate: 9,572 Valid: 8,248 (86.17%) Spoilt: 130 Quota: 1,179 Turnout: 8,378 (87.53%) |
1985: 2 x UUP, 1 x SDLP, 1 x DUP, 1 x Sinn Féin
Party | Candidate | FPv% | Count | |||||||
---|---|---|---|---|---|---|---|---|---|---|
1 | 2 | 3 | 4 | 5 | 6 | 7 | ||||
Ulster Unionist | Caldwell McClaughry* | 20.33% | 1,291 | |||||||
DUP | Bert Johnston* | 17.14% | 1,088 | |||||||
Ulster Unionist | Simon Loane | 15.56% | 988 | 1,198.78 | ||||||
Sinn Féin | Stephen Maguire | 11.91% | 756 | 756 | 756.26 | 758.26 | 897.26 | 947.39 | 947.65 | |
SDLP | John O'Kane* | 10.32% | 655 | 655.54 | 656.19 | 707.02 | 720.02 | 906.46 | 937.39 | |
SDLP | Tommy Gallagher | 6.44% | 409 | 409 | 409.13 | 426.7 | 550.7 | 703.88 | 729.14 | |
DUP | Victor Milligan | 4.52% | 287 | 301.4 | 418.66 | 474.64 | 475.64 | 479.21 | ||
SDLP | Dodie Maguire | 6.13% | 389 | 389.72 | 390.5 | 416.25 | 436.25 | |||
Irish Independence | Patrick Keown | 4.71% | 299 | 299.18 | 299.31 | 306.31 | ||||
Alliance | John Haslett | 2.95% | 187 | 191.32 | 211.86 | |||||
Electorate: 7,711 Valid: 6,349 (82.34%) Spoilt: 67 Quota: 1,059 Turnout: 6,416 (83.21%) |
1985: 2 x Sinn Féin, 1 x UUP, 1 x IIP, 1 x SDLP
Party | Candidate | FPv% | Count | ||||||||
---|---|---|---|---|---|---|---|---|---|---|---|
1 | 2 | 3 | 4 | 5 | 6 | 7 | 8 | ||||
Ulster Unionist | Wilson Elliott* | 17.05% | 1,261 | ||||||||
Irish Independence | Patrick McCaffrey* | 15.63% | 1,156 | 1,167 | 1,202 | 1,203 | 1,305 | ||||
Sinn Féin | Paul Corrigan | 9.68% | 716 | 720 | 868 | 868 | 881 | 884.68 | 1,511.68 | ||
SDLP | Gerry Gallagher* | 11.17% | 826 | 937 | 973 | 977 | 1,123 | 1,167.16 | 1,202.16 | 1,216.73 | |
Sinn Féin | Patrick McBrien | 7.20% | 532 | 536 | 659 | 660 | 844 | 867 | 932.92 | 1,193.77 | |
Ulster Unionist | Derrick Nixon | 10.27% | 759 | 759 | 759 | 1,143 | 1,151 | 1,151 | 1,154 | 1,154 | |
Sinn Féin | Patrick Reilly | 10.24% | 757 | 758 | 765 | 765 | 767 | 767.92 | |||
Independent Nationalist | Patrick Flanagan* | 6.29% | 465 | 486 | 489 | 491 | |||||
DUP | Diannah Gott | 5.48% | 405 | 407 | 407 | ||||||
Sinn Féin | Thomas Keaney | 4.80% | 355 | 356 | |||||||
SDLP | Patrick McGovern | 2.19% | 162 | ||||||||
Electorate: 8,343 Valid: 7,394 (88.63%) Spoilt: 141 Quota: 1,233 Turnout: 7,535 (90.32%) |
The first election to Fermanagh and Omagh District Council, part of the Northern Ireland local elections on 22 May 2014, returned 40 members to the newly-formed council via Single Transferable Vote.
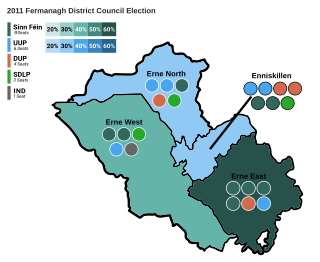
Elections to Fermanagh District Council were held on 5 May 2011 on the same day as the other Northern Irish local government elections. The election used four district electoral areas to elect a total of 23 councillors.
Elections to Fermanagh District Council were held on 5 May 2005 on the same day as the other Northern Irish local government elections. The election used four district electoral areas to elect a total of 23 councillors.
Elections took place for Fermanagh and Omagh District Council on 2 May 2019, part of that year's local elections. 40 Councillors were elected via STV.
Elections to Limavady Borough Council were held on 17 May 1989 on the same day as the other Northern Irish local government elections. The election used three district electoral areas to elect a total of 15 councillors.
Elections to Newry and Mourne District Council were held on 17 May 1989 on the same day as the other Northern Irish local government elections. The election used five district electoral areas to elect a total of 30 councillors.
Elections to Magherafelt District Council were held on 17 May 1989, on the same day as the other Northern Irish local government elections. The election used three district electoral areas to elect a total of 15 councillors.
Elections to Dungannon District Council were held on 17 May 1989 on the same day as the other Northern Irish local government elections. The election used four district electoral areas to elect a total of 22 councillors.
Elections to Strabane District Council were held on 17 May 1989 on the same day as the other Northern Irish local government elections. The election used three district electoral areas to elect a total of 15 councillors.
Elections to Omagh District Council were held on 17 May 1989 on the same day as the other Northern Irish local government elections. The election used three district electoral areas to elect a total of 21 councillors.
Elections to Fermanagh District Council were held on 7 June 2001 on the same day as the other Northern Irish local government elections. The election used four district electoral areas to elect a total of 23 councillors.
Elections to Fermanagh District Council were held on 21 May 1997 on the same day as the other Northern Irish local government elections. The election used four district electoral areas to elect a total of 23 councillors.
Elections to Fermanagh District Council were held on 19 May 1993 on the same day as the other Northern Irish local government elections. The election used four district electoral areas to elect a total of 23 councillors.
Elections to Fermanagh District Council were held on 17 May 1989 on the same day as the other Northern Irish local government elections. The election used four district electoral areas to elect a total of 23 councillors.
Omagh is one of the seven district electoral areas (DEA) in Fermanagh and Omagh, Northern Ireland. The district elects six members to Fermanagh and Omagh District Council and contains the wards of Camowen, Coolnagard, Dergmoney, Gortrush, Killyclogher and Strule. Omagh forms part of the West Tyrone constituencies for the Northern Ireland Assembly and UK Parliament.
West Tyrone is one of the seven district electoral areas (DEA) in Fermanagh and Omagh, Northern Ireland. The district elects six members to Fermanagh and Omagh District Council and contains the wards of Dromore, Drumquin, Fairy Water Fintona, Newtownsaville and Trillick. Omagh forms part of the West Tyrone constituencies for the Northern Ireland Assembly and UK Parliament.
Mid Tyrone is one of the seven district electoral areas (DEA) in Fermanagh and Omagh, Northern Ireland. The district elects six members to Fermanagh and Omagh District Council and contains the wards of Beragh, Drumnakilly, Gortin, Owenkillew, Sixmilecross and Termon. Omagh forms part of the West Tyrone constituencies for the Northern Ireland Assembly and UK Parliament.
Enniskillen is one of the seven district electoral areas (DEA) in Fermanagh and Omagh, Northern Ireland. The district elects six members to Fermanagh and Omagh District Council and contains the wards of Castlecoole, Erne, Lisbellaw, Lisnarrick, Portora and Rossory. Enniskillen forms part of the Fermanagh and South Tyrone constituencies for the Northern Ireland Assembly and UK Parliament.
Erne North is one of the seven district electoral areas (DEA) in Fermanagh and Omagh, Northern Ireland. The district elects five members to Fermanagh and Omagh District Council and contains the wards of Ballinamallard, Belleek and Boa, Ederney and Kesh, Irvinestown and Tempo. Erne North forms part of the Fermanagh and South Tyrone constituencies for the Northern Ireland Assembly and UK Parliament.
Erne East is one of the seven district electoral areas (DEA) in Fermanagh and Omagh, Northern Ireland. The district elects six members to Fermanagh and Omagh District Council and contains the wards of Brookeborough, Donagh, Lisnaskea, Maguiresbridge, Newtownbutler and Rosslea. Erne East forms part of the Fermanagh and South Tyrone constituencies for the Northern Ireland Assembly and UK Parliament.