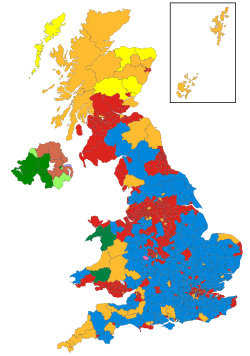
2005 United Kingdom general election

Last updated

2005 United Kingdom general election
Flag of the United Kingdom.svg
  2001 5 May 2005 2010  

All 646 seats to the House of Commons
324 seats needed for a majority
Opinion polls
Registered44,245,939
Turnout61.4% (Increase2.svg2.0%)
 First partySecond partyThird party
  Tony Blair WEF (cropped).jpg Michael Howard (cropped).jpg Charles Kennedy MP (cropped).jpg
Leader Tony Blair Michael Howard Charles Kennedy
Party Labour Conservative Liberal Democrats
Leader since 21 July 1994 6 November 2003 9 August 1999
Leader's seat Sedgefield Folkestone
and Hythe
Ross, Skye
and Lochaber
Last election412 seats, 40.7%166 seats, 31.7%52 seats, 18.3%
Seats before40316551
Seats won35519862
Seat changeDecrease2.svg 48*Increase2.svg 33*Increase2.svg 11*
Popular vote9,552,4368,784,9155,985,454
Percentage35.2%32.4%22.0%
SwingDecrease2.svg 5.5 pp Increase2.svg 0.7 pp Increase2.svg 3.7 pp

2005UKElectionMap.svg
Colours denote the winning party, as shown in the main table of results.

* Indicates boundary change – so this is a notional figure

Contents

Figure does not include the Speaker, Michael Martin

House of Commons 2005 Election.svg
Composition of the House of Commons after the election

Prime Minister before election

Tony Blair
Labour

Prime Minister after election

Tony Blair
Labour

The 2005 United Kingdom general election was held on Thursday 5 May 2005, to elect 646 members to the House of Commons. The governing Labour Party, led by Tony Blair, won its third consecutive victory, with Blair becoming the second Labour leader after Harold Wilson to form three majority governments. However, its majority fell to 66 seats; the majority it won four years earlier had been of 167 seats. This was the first time the Labour Party had won a third consecutive election, and as of 2024 remains the party's most recent general election victory.

The Labour campaign emphasised a strong economy; however, Blair had suffered a decline in popularity, which was exacerbated by the decision to send British troops to invade Iraq in 2003. Despite this, Labour mostly retained its leads over the Conservatives in opinion polls on economic competence and leadership, and Conservative leaders Iain Duncan Smith (2001–2003) and Michael Howard (2003–2005) struggled to capitalise on Blair's unpopularity, with the party consistently trailing behind Labour in the polls throughout the 2001–2005 parliament. [1]

The Conservatives campaigned on policies such as immigration limits, improving poorly managed hospitals, and reducing high crime rates. The Liberal Democrats, led by Charles Kennedy, took a strong stance against the Iraq War, particularly due to the absence of a second UN resolution, [2] This anti-war position resonated with disenchanted Labour voters, [3] leading to the Liberal Democrats achieving their largest share of seats in the party's history.

Tony Blair was returned as Prime Minister, with Labour having 355 MPs, but with a popular vote share of 35.2%, the smallest of any majority government in UK electoral history. In terms of votes Labour was only narrowly ahead of the Conservatives, but the party still held a comfortable lead in terms of seats. The Conservatives returned 198 MPs, with 32 more seats than they had won at the previous general election, and won the popular vote in England, while still ending up with 91 fewer MPs in England than Labour. The Liberal Democrats saw their share of the popular vote increase by 3.7%, and won the most seats of any third party since 1923, with 62 MPs. Anti-war activist and former Labour MP George Galloway was elected as the MP for Bethnal Green and Bow under the Respect – The Unity Coalition banner, unseating Oona King; Richard Taylor was re-elected for Kidderminster Health Concern in Wyre Forest; and independent candidate Peter Law was elected in Blaenau Gwent. [4]

This is the most recent general election in which the winning political party won a majority of the seats that were contested in each of the constituent countries of Great Britain (i.e. England, Scotland and Wales) at the same time.

In Northern Ireland, the Ulster Unionist Party (UUP), the more moderate of the main unionist parties, which had dominated Northern Irish politics since the 1920s, was reduced from six MPs to one, with party leader David Trimble himself being unseated. The more hardline Democratic Unionist Party became the largest Northern Irish party, with nine MPs elected.

Apart from Trimble, notable MPs leaving the House of Commons at this election included former SDLP leader John Hume, former Cabinet ministers Estelle Morris, Paul Boateng, Chris Smith, Gillian Shephard, Virginia Bottomley and Michael Portillo, the Father of the House of Commons Tam Dalyell, Tony Banks and Sir Teddy Taylor, while Stephen Twigg (see Portillo moment ) lost the Enfield Southgate constituency back to the Conservatives. A notable MP who joined the House of Commons at this election was future Labour leader Ed Miliband.

Following the election, Michael Howard conceded defeat, resigned as Conservative leader and was succeeded by future prime minister David Cameron. Blair resigned as both prime minister and leader of the Labour Party in June 2007, and was replaced by then–Chancellor of the Exchequer Gordon Brown. The election results were broadcast live on the BBC and presented by Peter Snow, David Dimbleby, Tony King, Jeremy Paxman, and Andrew Marr.

Overview

The governing Labour Party, led by Tony Blair, was looking to secure a third consecutive term in office and to retain a large majority. The Conservative Party was seeking to regain seats lost to both Labour and the Liberal Democrats since the 1992 general election, and move from being the Official Opposition into government. The Liberal Democrats hoped to make gains from both main parties, but especially the Conservative Party, with a "decapitation" strategy targeting members of the Shadow Cabinet. The Lib Dems had also wished to become the governing party, or to make enough gains to become the Official Opposition, but more realistically hoped to play a major part in a parliament led by a minority Labour or Conservative government. In Northern Ireland the Democratic Unionist Party sought to make further gains from the Ulster Unionist Party in unionist politics, and Sinn Féin hoped to overtake the Social Democratic and Labour Party in nationalist politics. (Sinn Féin MPs do not take their seats in the House of Commons—they follow a policy of abstentionism.) The pro-independence Scottish National Party and Plaid Cymru (Party of Wales) stood candidates in every constituency in Scotland and Wales respectively.

Many seats were contested by other parties, including several parties without incumbents in the House of Commons. Parties that were not represented at Westminster, but had seats in the devolved assemblies and/or the European Parliament, included the Alliance Party of Northern Ireland, the UK Independence Party, the Green Party of England and Wales, the Scottish Green Party, and the Scottish Socialist Party. The Health Concern party also stood again. A full list of parties which declared their intention to run can be found on the list of parties contesting the 2005 general election.

All parties campaigned using such tools as party manifestos, party political broadcasts and touring the country in what are commonly referred to as battle buses.

Local elections in parts of England and in Northern Ireland were held on the same day. The polls were open for fifteen hours, from 07:00 to 22:00 BST (UTC+1). The election came just over three weeks after the dissolution of Parliament on 11 April by Queen Elizabeth II, at the request of the Prime Minister, Tony Blair.

Campaign

Following the death of Pope John Paul II on 2 April, it was announced that the calling of the election would be delayed until 5 April. [5]

Thanks to eight years of sustained economic growth Labour could point to a strong economy, with greater investment in public services such as education and health. This was overshadowed, however, by the issue of the controversial 2003 invasion of Iraq, which met widespread public criticism at the time, and would dog Blair throughout the campaign. The Chancellor, Gordon Brown, played a prominent role in the election campaign, frequently appearing with Blair and ensuring that the economy would remain the central focus of Labour's message.

Recently elected Conservative leader Michael Howard brought a great level of experience and stability to a party that had ousted its former leader Iain Duncan Smith [6] just 18 months prior. The Conservative campaign was managed by Australian strategist Lynton Crosby. [7] The campaign focused on more traditional conservative issues like immigration, which created some controversy with the slogan "It's not racist to impose limits on immigration". [8] They also criticised Labour's "dirty" hospitals and high crime levels, under the umbrella of the slogan "Are you thinking what we're thinking?" [9]

However, Labour counter-attacked, by emphasising Howard's role in the unpopular Major Government of 1992–1997, airing a party election broadcast attacking Howard, showing a montage of scenes from Howard's tenure as Home Secretary, including prison riots and home repossessions. It also launched a billboard campaign showing Howard, and the Conservative Party's four previous leaders (Iain Duncan Smith, William Hague, John Major and Margaret Thatcher), with the caption "Britain's working, don't let the Tories wreck it again." [10]

For the Liberal Democrats, this was the second and final election campaign fought by leader Charles Kennedy, who strongly opposed the Iraq War and personally offered a more down-to-earth approach to voters, which proved popular. There were some questions, however, over Kennedy's abilities when, at the Liberal Democrat manifesto launch, he was asked about local income tax, but appeared confused on the figures. [11] Both the Liberal Democrats and the Conservatives were keen to tackle Labour's introduction of tuition fees, which both opposition parties opposed and promised to abolish. [12]

Ballot

Unofficial tellers, wearing party rosettes, sit outside polling stations collecting voter registration numbers PollingStation UK 2005.jpg
Unofficial tellers, wearing party rosettes, sit outside polling stations collecting voter registration numbers

At the close of voting (2200 BST) the ballot boxes were sealed and returned to the counting centres, where counting proceeded under the supervision of the returning officer who was obliged to declare the result as soon as it was known. As previously, there was serious competition amongst constituencies to be first to declare. Sunderland South repeated its performance in the last three elections and declared Labour incumbent Chris Mullin re-elected as MP with a majority of 11,059 at approximately 2245 BST (failing by two minutes to beat its previous best, but making it eligible for entry into the Guinness Book of World Records as longest consecutive delivery of first results). The vote itself represented a swing (in a safe Labour seat, in a safe Labour region) of about 4% to the Conservatives and 4.5% to the Liberal Democrats, somewhat below the prediction of BBC/ITV exit polls published shortly after 2200 BST.

Sunderland North was the next to declare, followed by Houghton and Washington East, both of whose Labour MPs retained their seats but with reductions in the incumbent majorities of up to 9%. The first Scottish seat to declare was Rutherglen and Hamilton West  — another safe Labour seat, also a Labour hold, but with the majority reduced by 4%. The first seat to change hands was Putney, where Labour's majority of 2,771 fell to a strong Conservative challenge, with a total swing of about 5,000 (6.2%). This was also the first seat to be declared for the Conservatives. The first Liberal Democrat seat to be declared was North East Fife, the constituency of Lib Dem deputy leader Sir Menzies Campbell which he had held since 1987.

The constituency of Crawley in West Sussex had the slimmest majority of any seat, with Labour's Laura Moffatt holding off the Conservatives' Henry Smith by 37 votes after three recounts.

Polling

Following problems with exit polls in previous British elections, the BBC and ITV agreed for the first time to pool their respective data, using results from Mori and NOP. More than 20,000 people were interviewed for the poll at 120 polling stations across the country. The predictions were very accurate—initial projections saw Labour returned to power with a majority of 66 (down from 160), [13] and the final result (including South Staffordshire, where the election was postponed due to the death of a candidate) was indeed a Labour majority of 66.

The projected shares of the vote in Great Britain were Labour 35% (down 6% on 2001), Conservatives 33% (up 1%), Liberal Democrats 22% (up 4%) and other parties 8% (up 1%). [13] The Conservatives were expected to make the biggest gains, however — 44 seats according to the exit poll — with the Liberal Democrats expected to take as few as two. While the Lib Dems' vote share predicted by the exit poll was accurate (22.6% compared to the actual 22.0%), they did better in some Lib Dem-Labour marginals than predicted on the basis of the national share of the vote, and achieved a net gain of 11 seats.

2001 notional result

There were major boundary changes in Scotland, where the number of seats was reduced from 72 to 59. As a result of this each party lost some seats, and this notional election result below is based on the 2001 election results if they had been fought on these new 2005 boundaries.

2001 UK general election
PartySeatsGainsLossesNet gain/lossSeats %Votes %Votes+/−
  Labour 40328-662.3840.710,724,953
  Conservative 16598+125.5431.78,357,615
  Liberal Democrats 5182+67.8918.34,814,321
  SNP 4-10.621.8464,314
  Other parties 233.577.5

Results

Party Labour Party Conservative and
Unionist Party
Liberal Democrats UK Independence Party Scottish National Party Greens
(GPEW+SGP+GPNI)
Democratic
Unionist Party
Leader Tony Blair Michael Howard Charles Kennedy Roger Knapman Alex Salmond Caroline Lucas (GPEW) Ian Paisley
Tony Blair.jpg Michael Howard (cropped).jpg Charles Kennedy MP (cropped).jpg Roger Knapman.jpg Alex Salmond, First Minister of Scotland (cropped).jpg Caroline Lucas Smile.jpg DrIanPaisley.jpg
Votes9,552,436 (35.2%)8,784,915 (32.4%)5,985,454 (22.0%)605,973 (2.2%)412,267 (1.5%)257,758 (1.0%)241,856 (0.9%)
Seats355 (55.2%)198 (30.7%)62 (9.6%)0 (0.0%)6 (0.9%)0 (0.0%)9 (1.4%)
Result by countries and English regions 2005 UK general election, countries and regions.svg
Result by countries and English regions
Votes cast by age group: Con, Lab, LD, other parties (green) and those not voting (grey). Uk general election 2005 by age.png
Votes cast by age group: Con, Lab, LD, other parties (green) and those not voting (grey).

At 04:28 BST, it was announced that Labour had won Corby, giving them 324 seats in the House of Commons out of those then declared and an overall majority, Labour's total reaching 355 seats out of the 646 House of Commons seats. Labour received 35.3% of the popular vote, equating to approximately 22% of the electorate on a 61.3% turnout, up from 59.4% turnout in 2001.

As expected, voter disenchantment led to an increase of support for many opposition parties, and caused many eligible to vote, not to turn out. Labour achieved a third successive term in office for the first time in their history, though with reduction of the Labour majority from 167 to 67 (as it was before the declaration of South Staffordshire). As it became clear that Labour had won an overall majority, Michael Howard, the leader of the Conservative Party, announced his intention to retire from frontline politics. The final seat to declare was the delayed poll in South Staffordshire, at just after 1 a.m. on Friday 24 June.

The election was followed by further criticism of the UK electoral system. Calls for reform came particularly from Lib Dem supporters, citing that they received only just over 10% of the overall seats with 22.1% of the popular vote. The only parties to win a substantially higher percentage of seats than they achieved in votes were Labour, the Democratic Unionist Party, Sinn Féin, and Health Concern, which ran only one candidate. The results of the election give a Gallagher index of dis-proportionality of 16.76.

Seats won in the election (outer ring) against number of votes (inner ring) Results of the UK General Election, 2005.svg
Seats won in the election (outer ring) against number of votes (inner ring)

The Labour Government claimed that being returned to office for a third term for the first time ever showed the public approval of Labour's governance and the continued unpopularity of the Conservatives. Nevertheless, Labour's vote declined to 35.3%, the lowest share of the popular vote to have formed a majority government in the history of the UK House of Commons. In many areas the collapse in the Labour vote resulted in a host of seats changing hands. Labour also failed to gain any new seats, almost unique in any election since 1945. As well as losing seats to the Tories and the Liberal Democrats, Labour also lost Blaenau Gwent, its safest seat in Wales, [14] to Independent Peter Law, and Bethnal Green and Bow to Respect candidate George Galloway.

The Conservatives claimed that their increased number of seats showed disenchantment with the Labour government and was a precursor of a Conservative breakthrough at the next election. Following three consecutive elections of declining representation and then in 2001 a net gain of just one seat, 2005 was the first general election since their famous 1983 landslide victory where the number of Conservative seats increased appreciably, although the Conservatives' vote share increased only slightly and this election did mark the third successive general election in which the Conservatives polled below 35%. In some areas the Conservative vote actually fell. The Conservatives claimed to have won the general election in England, since they received more votes than Labour although Labour still won a majority of seats. [15]

The Liberal Democrats claimed that their continued gradual increase in seats and percentage vote showed they were in a position to make further gains from both parties. They pointed in particular to the fact that they were now in second place in roughly one hundred and ninety constituencies and that having had net losses to Labour in the 1992 general election and having not taken a single seat off Labour in 1997, they had held their gains off Labour from the 2001 general election and had actually made further gains from them. The Liberal Democrats also managed to take three seats from the Conservatives, one notable victory being that of Tim Farron over Tim Collins in Westmorland and Lonsdale, through the use of a "decapitation strategy", which targeted senior Tories. [16]

The Liberal Democrats increased their percentage of the vote by 3.7%, the Conservatives by 0.6%, and Labour's dropped by 5.4%.

The UK media interpreted the results as an indicator of a breakdown in trust in the government, and especially in Prime Minister Tony Blair.

Meanwhile, the Scottish National Party improved its position in Scotland, regaining the Western Isles and Dundee East from Labour, having lost both seats in 1987. [17] In Wales Plaid Cymru failed to gain any seats and lost Ceredigion to the Liberal Democrats. In Northern Ireland the Ulster Unionists were all but wiped out, only keeping North Down, with leader David Trimble losing his seat in Upper Bann. For the first time the DUP became the biggest party in Northern Ireland.

It was the first general election since 1929 in which no party received more than ten million votes. It was the most "three-cornered" election since 1923, though the Liberal Democrats failed to match the higher national votes of the SDP–Liberal Alliance in the 1980s either in absolute or percentage terms. The total combined vote for Labour, the Conservatives and the Liberal Democrats proved to be the lowest main three-party vote since 1922.

2005 UK parliament.svg
e    d  Summary of the results of the 5 May 2005 United Kingdom general election to the House of Commons of the United Kingdom
Political party
Leader
Candidates
Elected
Seats gained
Seats lost
Net change
in seats
% of seats
Number of votes
% of votes
Change in %
of vote
Votes per
seat won
Labour Tony Blair 627355047–4755.29,552,43635.2–5.526,908
Conservative Michael Howard 630198363+3330.78,784,91532.4+0.744,368
Liberal Democrats Charles Kennedy 62662165+119.65,985,45422.0+3.896,540
UKIP Roger Knapman 49600000.0605,9732.2+0.8N/A
SNP Alex Salmond 59620+20.9412,2671.5–0.268,711
Green Caroline Lucas and Keith Taylor 18200000.0257,7581.0+0.4N/A
DUP Ian Paisley 18940+41.4241,8560.9+0.226,873
BNP Nick Griffin 11900000.0192,7450.7+0.5N/A
Plaid Cymru Ieuan Wyn Jones 4030 1 –10.5174,8380.6–0.158,279
Sinn Féin Gerry Adams 185 1 0+10.8174,5300.6–0.134,906
Ulster Unionist David Trimble 18 1 05–50.2127,4140.5–0.3127,414
SDLP Mark Durkan 183 1 1 00.5125,6260.5–0.141,875
Independent N/A180 1 1 0+10.2122,4160.5+0.1122,416
Respect Linda Smith26 1 1 0+10.268,0940.3N/A68,094
Scottish Socialist Colin Fox 5800000.043,5140.2–0.1N/A
Veritas Robert Kilroy-Silk 6500000.040,6070.1N/AN/A
Alliance David Ford 1200000.028,2910.10.0N/A
Scottish Green Shiona Baird and Robin Harper 1900000.025,7600.1+0.1N/A
Socialist Labour Arthur Scargill 4900000.020,1670.10.0N/A
Liberal Michael Meadowcroft 1400000.019,0680.10.0N/A
Health Concern Richard Taylor 1 1 0000.218,7390.10.018,739
Speaker N/A 1 1 0000.215,1530.10.015,153
English Democrat Robin Tilbrook 2400000.015,1490.1N/AN/A
Socialist Alternative Peter Taaffe 1700000.09,3980.0N/AN/A
National Front Tom Holmes 1300000.08,0790.0N/AN/A
Legalise Cannabis Alun Buffry2100000.06,9500.00.0N/A
Monster Raving Loony Howling Laud Hope 1900000.06,3110.00.0N/A
Community Action Peter Franzen300000.05,9840.0N/AN/A
Christian Vote George Hargreaves 1000000.04,0040.0N/AN/A
Mebyon Kernow Dick Cole 400000.03,5520.00.0N/A
Forward Wales John Marek 600000.03,4610.0N/AN/A
CPA Alan Craig 900000.03,2910.0N/AN/A
Rainbow Dream Ticket Rainbow George Weiss 2300000.02,4630.0N/AN/A
Community Group Martin Williams 1 00000.02,3650.0N/AN/A
Ashfield Independents Roy Adkins 1 00000.02,2920.0N/AN/A
Alliance for Green SocialismMike Davies500000.01,9780.0N/AN/A
Residents Association of LondonMalvin Brown200000.01,8500.0N/AN/A
Workers' Party Seán Garland 600000.01,6690.00.0N/A
Socialist Environmental Goretti Horgan 1 00000.01,6490.0N/AN/A
Scottish Unionist Daniel Houston 1 00000.01,2660.00.0N/A
Workers Revolutionary Sheila Torrance1000000.01,2410.00.0N/A
New England Michael Tibby 1 00000.01,2240.0N/AN/A
Communist Robert Griffiths 600000.01,1240.00.0N/A
Community Group 1 00000.01,1180.0N/AN/A
Peace and Progress Chris Cooper300000.01,0360.0N/AN/A
Scottish Senior Citizens John Swinburne 200000.01,0170.0N/AN/A
Your PartyDaniel Thompson200000.01,0060.0N/AN/A
SOS! NorthamptonYvonne Dale200000.09320.0N/AN/A
Ind. Working Class None 1 00000.08920.0N/AN/A
Democratic Labour Brian Powell 1 00000.07700.0N/AN/A
British Public PartyKashif Rana 1 00000.07630.0N/AN/A
Free Scotland PartyBrian Nugent300000.07430.0N/AN/A
Pensioners Party Scotland George Rodger 1 00000.07160.0N/AN/A
Publican PartyKit Fraser and Don Lawson 1 00000.06780.0N/AN/A
English Independence PartyAndrew Constantine 1 00000.06540.0N/AN/A
Socialist Unity None200000.05810.0N/AN/A
Local Community PartyJack Crossfield 1 00000.05700.0N/AN/A
Clause 28David Braid300000.05160.0N/AN/A
UK Community Issues PartyMichael Osman300000.05020.0N/AN/A
Total646Turnout27,148,51061.442,026

[18]

Popular vote

   Labour (35.2%)
   Conservative (32.4%)
   Liberal Democrats (22.0%)
   UKIP (2.2%)
   SNP (1.5%)
   Greens (1%)
   DUP (0.9%)
   BNP (0.9%)
   Sinn Féin (0.9%)
   Plaid Cymru (0.9%)

The figure of 355 seats for Labour does not include the Speaker Michael Martin. See also the list of parties standing in Northern Ireland.

Government's new majority66
Popular vote
Labour
35.2%
Conservative
32.4%
Liberal Democrat
22.1%
UK Independence
2.2%
Scottish National
1.5%
Green
1.0%
Others
5.7%

[ citation needed ]

Parliamentary seats
Labour
55.1%
Conservative
30.7%
Liberal Democrat
9.6%
Democratic Unionist
1.4%
Scottish National
0.9%
Sinn Féin
0.8%
Others
1.6%

[19]

Seats changing hands

MPs who lost their seats

PartyNameConstituencyOffice held whilst in powerYear electedDefeated byParty
Labour Stephen Twigg Enfield Southgate Minister of State for Schools 1997 David Burrowes Conservative Party
Melanie Johnson Welwyn Hatfield Minister of State for Public Health 1997 Grant Shapps Conservative Party
Chris Leslie Shipley Parliamentary Under-Secretary of State in the Department for Constitutional Affairs 1997 Philip Davies Conservative Party
Ivan Henderson Harwich Parliamentary Private Secretary at the Home Office 1997 Douglas Carswell Conservative Party
David Stewart Inverness East, Nairn and Lochaber (contested Inverness, Nairn, Badenoch and Strathspey)Parliamentary Private Secretary to the Secretary of State for Scotland 1997 Danny Alexander Liberal Democrats
Peter Bradley The Wrekin Parliamentary Private Secretary to the Minister of State for Rural Affairs 1997 Mark Pritchard Conservative Party
Keith Bradley Manchester Withington Treasurer of the Household 1987 John Leech Liberal Democrats
Barbara Roche Hornsey and Wood Green Minister of State for Asylum and Immigration 1992 Lynne Featherstone Liberal Democrats
Calum MacDonald Na h-Eileanan an Iar Minister for Gaelic 1987 Angus MacNeil Scottish National Party
Roger Casale Wimbledon 1997 Stephen Hammond Conservative Party
Paul Stinchcombe Wellingborough 1997 Peter Bone Conservative Party
Kerry Pollard St Albans 1997 Anne Main Conservative Party
Tony Clarke Northampton South 1997 Brian Binley Conservative Party
Helen Clark Peterborough 1997 Stewart Jackson Conservative Party
Tony Colman Putney 1997 Justine Greening Conservative Party
Lorna Fitzsimons Rochdale 1997 Paul Rowen Liberal Democrats
Andy King Rugby and Kenilworth 1997 Jeremy Wright Conservative Party
Lawrie Quinn Scarborough and Whitby 1997 Robert Goodwill Conservative Party
Brian White North East Milton Keynes 1997 Mark Lancaster Conservative Party
Huw Edwards Monmouth 1997 David Davies Conservative Party
Phil Sawford Kettering 1997 Philip Hollobone Conservative Party
Linda Perham Ilford North 1997 Lee Scott Conservative Party
John Cryer Hornchurch 1997 James Brokenshire Conservative Party
Tony McWalter Hemel Hempstead 1997 Mike Penning Conservative Party
Candy Atherton Falmouth and Camborne 1997 Julia Goldsworthy Liberal Democrats
Nigel Beard Bexleyheath and Crayford 1997 David Evennett Conservative Party
Oona King Bethnal Green & Bow 1997 George Galloway Respect Party
Valerie Davey Bristol West 1997 Stephen Williams Liberal Democrats
Anne Campbell Cambridge 1992 David Howarth Liberal Democrats
Jon Owen Jones Cardiff Central 1992 Jenny Willott Liberal Democrats
Gareth Thomas Clwyd West 1997 David Jones Conservative Party
Geraint Davies Croydon Central 1997 Andrew Pelling Conservative Party
John Lyons Strathkelvin and Bearsden (contested East Dunbartonshire)2001 Jo Swinson Liberal Democrats
Iain Luke Dundee East 2001 Stewart Hosie Scottish National Party
Chris Pond Gravesham Parliamentary Under-Secretary of State for Work and Pensions 1997 Adam Holloway Conservative Party
Liberal Democrats Brian Cotter Weston-super-Mare Small Business Spokesperson1997 John Penrose Conservative Party
Sue Doughty Guildford 2001 Anne Milton Conservative Party
Matthew Green Ludlow 2001 Philip Dunne Conservative Party
David Rendel Newbury 1993 Richard Benyon Conservative Party
Conservative Tim Collins Westmorland & Lonsdale Shadow Secretary of State for Education and Skills1997 Tim Farron Liberal Democrats
Peter Duncan Galloway and Upper Nithsdale (contested Dumfries & Galloway)Shadow Secretary of State for Scotland2001 Russell Brown Labour Party
Adrian Flook Taunton 2001 Jeremy Browne Liberal Democrats
John Taylor Solihull 1983 Lorely Burt Liberal Democrats
Ulster Unionist Party David Trimble Upper Bann Parliamentary Leader of the Ulster Unionists 1990 David Simpson Democratic Unionist Party
Roy Beggs East Antrim 1983 Sammy Wilson Democratic Unionist Party
David Burnside South Antrim 2001 William McCrea Democratic Unionist Party
Plaid Cymru Simon Thomas Ceredigion 2000 Mark Williams Liberal Democrats
Scottish National Party Annabelle Ewing Perth (contested Ochil and South Perthshire)2001 Gordon Banks Labour Party

Seats which changed allegiance

Labour to Conservative (31)

Labour to Liberal Democrat (11)

Liberal Democrat to Conservative (5)

Conservative to Liberal Democrat (3)

Labour to SNP (2)

UUP to DUP (2)

Labour to Independent (1)

Liberal Democrat to Labour (1)

PC to Liberal Democrat (1)

UUP to SDLP (1)

Labour to Respect (1)

SDLP to Sinn Fein (1)

The disproportionality of the House of Commons in the 2005 election was 16.89 according to the Gallagher Index, mainly between Labour and the Liberal Democrats. 2005 UK General Election Gallagher Index.png
The disproportionality of the House of Commons in the 2005 election was 16.89 according to the Gallagher Index, mainly between Labour and the Liberal Democrats.

Post-election events

Formation of government

Following the election, Labour remained in power with Tony Blair remaining as Prime Minister. The morning after the election, Blair travelled to Buckingham Palace to inform The Queen of the election result and to receive permission to form a government, consequently beginning his third term as prime minister. Blair reshuffled his Cabinet and junior ministers over the following weekend, with formal announcements made on 9 May 2005. The most senior positions of Chancellor, Home Secretary and Foreign Secretary remained the same (Gordon Brown, Charles Clarke and Jack Straw respectively), but a few new faces were added. Most notably, David Blunkett returned to cabinet as the Work and Pensions Secretary, although he was forced to resign again due to another scandal before the end of the year that spawned a national press and opposition campaign for his dismissal. Patricia Hewitt became the new Health Secretary, Tessa Jowell remained as Culture Secretary, whilst Alan Johnson was promoted to Trade and Industry Secretary. Meanwhile, Ruth Kelly retained the Education job and Margaret Beckett stayed put at Environment.

The new Parliament met on 11 May for the election of the Speaker of the House of Commons.

New party leaders

On 6 May, Michael Howard announced he would be standing down as leader of the Conservative Party, but not before a review of the leadership rules. The formal leadership election began in October, and was ultimately won by David Cameron. On 7 May, David Trimble resigned as leader of the Ulster Unionist Party; Sir Reg Empey was elected as his successor at an Ulster Unionist Council meeting on 24 June.

End of the term

Blair's successor as Prime Minister, Gordon Brown (who came to office on 27 June 2007), visited Buckingham Palace on 6 April 2010 and asked the Queen to dissolve Parliament on 12 April. The next election was held on 6 May 2010. [20]

Further reading

See also

Related Research Articles

<span class="mw-page-title-main">2001 United Kingdom general election</span>

The 2001 United Kingdom general election was held on Thursday 7 June 2001, four years after the previous election on 1 May 1997, to elect 659 members to the House of Commons. The governing Labour Party was re-elected to serve a second term in government with another landslide victory with a 167 majority, returning 412 members of Parliament versus 418 from the 1997 general election, a net loss of six seats, though with a significantly lower turnout than before—59.4%, compared to 71.6% at the previous election. The number of votes Labour received fell by nearly three million. Tony Blair went on to become the only Labour Prime Minister to serve two consecutive full terms in office. As Labour retained almost all of their seats won in the 1997 landslide victory, the media dubbed the 2001 election "the quiet landslide".

<span class="mw-page-title-main">Politics of the United Kingdom</span> Political system of the United Kingdom of Great Britain and Northern Ireland

The politics of the United Kingdom functions within a constitutional monarchy where executive power is delegated by legislation and social conventions to a unitary parliamentary democracy. From this a hereditary monarch, currently King Charles III, serves as head of state while the Prime Minister of the United Kingdom, currently Rishi Sunak since 2022, serves as the elected head of government.

<span class="mw-page-title-main">1997 United Kingdom general election</span>

The 1997 United Kingdom general election was held on Thursday, 1 May 1997. The governing Conservative Party led by Prime Minister John Major was defeated in a landslide by the Labour Party led by Tony Blair, achieving a 179-seat majority.

<span class="mw-page-title-main">1983 United Kingdom general election</span> British 1983 election

The 1983 United Kingdom general election was held on Thursday 9 June 1983. It gave the Conservative Party under the leadership of Margaret Thatcher the most decisive election victory since that of the Labour Party in 1945, with a majority of 144 seats and the first of two consecutive landslide victories.

<span class="mw-page-title-main">1987 United Kingdom general election</span>

The 1987 United Kingdom general election was held on Thursday 11 June 1987, to elect 650 members to the House of Commons. The election was the third consecutive general election victory for the Conservative Party, who won a majority of 102 seats and second landslide under the leadership of Margaret Thatcher, who became the first Prime Minister since the Earl of Liverpool in 1820 to lead a party into three successive electoral victories.

<span class="mw-page-title-main">February 1974 United Kingdom general election</span>

The February 1974 United Kingdom general election was held on Thursday 28 February 1974. The Labour Party, led by Leader of the Opposition and former Prime Minister Harold Wilson, gained 14 seats but was seventeen short of an overall majority. The Conservative Party, led by incumbent Prime Minister Edward Heath, lost 28 seats. That resulted in a hung parliament, the first since 1929. Heath sought a coalition with the Liberals, but the two parties failed to come to an agreement and so Wilson became Prime Minister for a second time, his first with a minority government. Wilson called another early election in September, which was held in October and resulted in a Labour majority. The February election was also the first general election to be held with the United Kingdom as a member state of the European Communities (EC), which was widely known as the "Common Market".

<span class="mw-page-title-main">October 1974 United Kingdom general election</span>

The October 1974 United Kingdom general election took place on Thursday 10 October 1974 to elect 635 members of the British House of Commons. It was the second general election held that year; the first year that two general elections were held in the same year since 1910; and the first time that two general elections were held less than a year apart from each other since the 1923 and 1924 elections, which took place 10 months apart. The election resulted in the Labour Party, led by Prime Minister Harold Wilson, winning a bare majority of three seats. That enabled the remainder of the Labour government to take place, but it saw a gradual loss of its majority.

<span class="mw-page-title-main">1950 United Kingdom general election</span>

The 1950 United Kingdom general election was the first ever to be held after a full term of Labour government. The election was held on Thursday 23 February 1950, and was the first held following the abolition of plural voting and university constituencies. The government's 1945 lead over the Conservative Party shrank dramatically, and Labour was returned to power but with an overall majority reduced from 146 to just 5. There was a 2.8% national swing towards the Conservatives, who gained 90 seats. Labour called another general election in 1951, which the Conservative Party won.

<span class="mw-page-title-main">1959 United Kingdom general election</span> 8 October 1959

The 1959 United Kingdom general election was held on Thursday, 8 October 1959. It marked a third consecutive victory for the ruling Conservative Party, now led by Prime Minister Harold Macmillan. For the second time in a row, the Conservatives increased their overall majority in Parliament, this time to a landslide majority of 100 seats, having gained 20 seats for a return of 365. The Labour Party, led by Hugh Gaitskell, lost 19 seats and returned 258. The Liberal Party, led by Jo Grimond, again returned only six MPs to the House of Commons, but managed to increase its overall share of the vote to 5.9%, compared to just 2.7% four years earlier.

<span class="mw-page-title-main">2004 European Parliament election in the United Kingdom</span> Election

The 2004 European Parliament election was the United Kingdom's part of the wider 2004 European Parliament election which was held between 10 and 13 June 2004 in the 25 member states of the European Union. The United Kingdom's part of this election was held on Thursday 10 June 2004. The election also coincided with the 2004 local elections and the London Assembly and mayoral elections. In total, 78 Members of the European Parliament were elected from the United Kingdom using proportional representation.

<span class="mw-page-title-main">2010 United Kingdom general election</span> General election held in the United Kingdom

The 2010 United Kingdom general election was held on Thursday 6 May 2010, with 45,597,461 registered voters entitled to vote to elect members to the House of Commons. The election took place in 650 constituencies across the United Kingdom under the first-past-the-post system.

<span class="mw-page-title-main">Scottish Conservatives</span> Part of the British Conservative Party

The Scottish Conservative & Unionist Party is part of the UK Conservative Party active in Scotland. It is a centre right party. The party holds 7 out of the 59 Scottish seats in the House of Commons and 31 of the 129 seats in the Scottish Parliament. It has 209 local councillors of 1,227.

This is an overview of United Kingdom general election results since 1922. The 1922 election was the first election in the new United Kingdom of Great Britain and Northern Ireland, after the creation of the Irish Free State removed Southern Ireland from the UK.

This is the results breakdown of the 2005 general election.

<span class="mw-page-title-main">2014 European Parliament election in the United Kingdom</span> Election

The 2014 European Parliament election was the United Kingdom's component of the 2014 European Parliament election, held on Thursday 22 May 2014, coinciding with the 2014 local elections in England and Northern Ireland. In total, 73 Members of the European Parliament were elected from the United Kingdom using proportional representation. England, Scotland and Wales use a closed-list party list system of PR, while Northern Ireland used the single transferable vote (STV).

<span class="mw-page-title-main">2015 United Kingdom general election</span>

The 2015 United Kingdom general election was held on Thursday 7 May 2015 to elect 650 Members of Parliament to the House of Commons. It was the only general election held under the rules of the Fixed-term Parliaments Act 2011 and was the last general election to be held before the United Kingdom would vote to end its membership of the European Union (EU). Local elections took place in most areas of England on the same day.

<span class="mw-page-title-main">2019 United Kingdom general election</span> Election to the United Kingdom House of Commons

The 2019 United Kingdom general election was held on Thursday 12 December 2019 with 47,074,800 registered voters entitled to vote to elect members of the House of Commons. The Conservative Party won a landslide victory with a majority of 80 seats, a net gain of 48, on 43.6% of the popular vote, the highest percentage for any party since the 1979 general election.

<span class="mw-page-title-main">Candidates in the 2017 United Kingdom general election</span>

3,303 candidates stood in the United Kingdom general election of 2017, which was held on 8 June 2017. The deadline for parties and individuals to file candidate nomination papers to the acting returning officer was 16:00 on 11 May 2017.

References

  1. "2001-2005 Polls". UK Polling Report. Archived from the original on 14 November 2021. Retrieved 14 November 2021.
  2. "Blair is not the only one with Iraq amnesia – the Lib Dems were NOT anti-invasion, just anti-that-kind-of-invasion". UK: Left Foot Forward. 17 June 2014. Retrieved 26 March 2015.
  3. Cowling, David (7 May 2005). "Who deserted Labour?". BBC News . Retrieved 14 November 2021.
  4. "The 2005 General Election: Worst Election Ever". www.electoral-reform.org.uk. Retrieved 1 April 2023.
  5. "Blair delays election call" . The Daily Telegraph. London. 3 April 2005. Archived from the original on 11 January 2022.
  6. "Tory leader ousted". BBC News. 29 October 2003. Retrieved 6 June 2022.
  7. Ha, Tu Thanh (11 September 2015). "Who is Lynton Crosby, the 'master of dark arts' now behind Harper's campaign?". The Globe and Mail. Retrieved 10 November 2021.
  8. "Tory election poster sparks complaints of racism from students and teachers". The Independent. London. 7 February 2005. Archived from the original on 1 May 2022.
  9. "Manifesto UK 2005" (PDF). www.webcitation.org. Archived from the original (PDF) on 16 June 2007.
  10. Toynbee, Polly (5 May 2004). "Polly Toynbee: Humiliation could make Blair a Labour leader". The Guardian . ISSN   0261-3077 . Retrieved 29 March 2020.
  11. "Kennedy struggles to explain flagship policy". The Guardian. 15 April 2005. Retrieved 6 June 2022.
  12. "2005: Historic third term for Labour". BBC News. 20 September 2007. Retrieved 6 June 2022.
  13. 1 2 Plunkett, John (6 May 2005). "Broadcasters hail success of joint poll". The Guardian. London. Retrieved 21 July 2009.
  14. "Labour loses safest seat in Wales". BBC News. 6 May 2005.
  15. McSmith, Andy (4 July 2006). "The Big Question: What is the West Lothian question, and can it be resolved satisfactorily?". The Independent. London. Archived from the original on 11 December 2008.
  16. Carlin, Brendan; Sapsted, David (4 May 2005). "Defiant Kennedy takes 'decapitation' strategy into Tory heartland" . The Daily Telegraph. London. Archived from the original on 11 January 2022.
  17. "SNP secures Western Isles victory". BBC News. 6 May 2005.
  18. Election 2005: constituencies, candidates and results Archived 9 December 2008 at the Wayback Machine . The Electoral Commission. March 2006
  19. "2005 UK General election results, manifestos, PMs biography". UK Political Info. 13 April 2005. Retrieved 9 March 2011.
  20. Gordon Brown calls 6 May general election – BBC News, 6 April 2010

Manifestos

Main parties
Smaller parties which won seats
Other parties