Last updated • 6 min readFrom Wikipedia, The Free Encyclopedia
Parliamentary constituency in the United Kingdom, 1885 onwards
This article is about the British constituency in Surrey, England. For the Canadian provincial electoral district for the Legislative Assembly of British Columbia of a similar name, see Surrey-Guildford.
The seat covers Guildford itself and a more rural area within the Surrey Hills AONB. The seat voted Remain in the 2016 EU referendum, and has wealthier and healthier residents than the national average.[2]
History
From the first Commons in the Model Parliament of 1295 Guildford was a parliamentary borough sending two members to Parliament until 1868[3][n 3] and one until 1885. In the latter years of sending two members a bloc vote system of elections was used. Until 1885 the electorate in the town of Guildford elected the member(s) of parliament,[4] which expanded in 1885 into a county division under the Redistribution of Seats Act 1885.
Early political history
The seat elected between 1868 and 2001 Conservatives. Exceptions in this period took place when the two-then-three main British parties' policies were beginning to coalesce. The first was a continuation of the centuries-old representation of Guildford by influential members of the Earl of Onslow's family, including a single member winning three widely spaced elections, before being defeated by a further member of the same family in its minor Sussex and British Indian branch, then the majority of the seat's voters were again swayed toward the Liberal landslide of the 1906 general election.
Modern political history
Successive elections in 2001 and 2005 saw marginal majorities of under 2% of the vote - in favour of a Liberal Democrat and then a Conservative. The 2015 result brought the incumbent MP a Conservative majority of more than 41%, up from 14% in 2010. The seat swung substantially to the Liberal Democrats in 2019, and the Lib Dems then took the seat back from the Conservatives in 2024 with a majority of over 8,000.
Boundaries
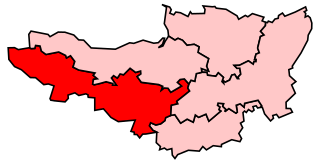
Context of 1906.
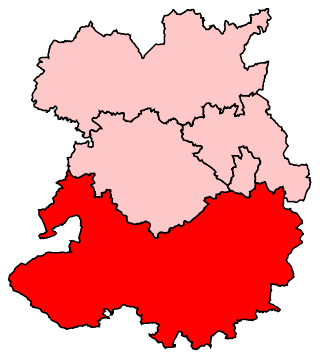
Context of 1923
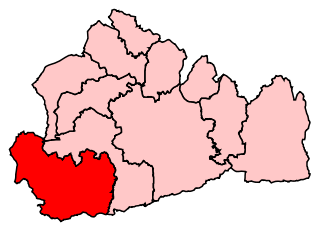
Map of boundaries 2010-2024
1885–1918: The Boroughs of Guildford and Godalming, the Sessional Division of Farnham, and part of the Sessional Division of Guildford.
1918–1950: The Boroughs of Guildford and Godalming, the Urban District of Haslemere,[a] the Rural District of Hambledon,[a] and the Rural District of Guildford[b] except the civil parish of Pirbright.
1 2 Was part of Sessional Division of Farnham, the remainder of which formed, with Woking and most of modern Surrey Heath a new seat, named Farnham
↑ This meant rural gains from Chertsey e.g. Send, Ripley, E. & W. Clandon and E. & W. Horsley
1950–1983: The Borough of Guildford, in the Rural District of Guildford the parishes of Artington, Compton, Puttenham, Shackleford, Shalford, Wanborough, and Worplesdon, and in the Rural District of Hambledon the parishes of Alfold, Bramley, Busbridge, Cranleigh, Dunsfold, Ewhurst, Hambledon, Hascombe, and Wonersh.
1983–1997: The Borough of Guildford wards of Christchurch, Friary and St Nicolas, Holy Trinity, Merrow and Burpham, Onslow, Pilgrims, Shalford, Stoke, Stoughton, Tongham, Westborough, and Worplesdon, and the District of Waverley wards of Blackheath and Wonersh, Bramley, Cranleigh East, Cranleigh West, Ewhurst, and Shamley Green.
1997–2010: As above less Tongham ward.
2010–2024: The Borough of Guildford wards of Burpham, Christchurch, Friary and St Nicolas, Holy Trinity, Merrow, Onslow, Pilgrims, Shalford, Stoke, Stoughton, Westborough, and Worplesdon, and the Borough of Waverley wards of Alfold, Blackheath and Wonersh, Cranleigh East, Cranleigh Rural and Ellens Green, Cranleigh West, Ewhurst, and Shamley Green and Cranleigh North.
2024–present: The Borough of Guildford wards of Bellfields & Slyfield, Burpham, Castle, Clandon & Horsley, Effingham, Merrow, Onslow, Send & Lovelace, St Nicolas, Stoke, Stoughton North, Stoughton South, Westborough, and Worplesdon
Electorate reduced to bring it within the permitted range by transferring the parts in the Borough of Waverley, including Cranleigh to the newly created constituency of Godalming and Ash (except the small Ewhurst ward, which went to Dorking and Horley). To compensate, Clandon, Horsley, Effingham, Send and Lovelace in Guildford borough were added from the former Mole Valley seat.[5]
This constituency underwent boundary changes between the 1992 and 1997 general elections and thus change in share of vote is based on a notional calculation.
Boundaries were redrawn in time for the 1950 general election. From 1918 to 1950 the three parts of western Surrey are set out at the 1918 results below. The next change saw an additional seat duty carved out, to be Woking. As a result, Guildford, now oversized, shrank considerably in area and population. To the south the areas of Godalming, Elstead, Thursley, Whitley, Haslemere and Chiddingford were added to the Farnham seat. To the east Send, Ripley, Wisley, Ockham, St Martha, Albury, Shere, Clandon and Horsley were added to Dorking.[39]
These boundaries centred on the town of Guildford plus an area southwards towards Cranleigh, became, with small changes in later reviews, form the basic shape for Guildford until present.
From 1885 to 1918 the west part of Surrey had been represented by two seats - in the north the seat of Chertsey, in the south that of Guildford. Boundaries were redrawn for proper apportionment in time for the 1918 general election such that the same area saw three seats - Farnham in the west, Chertsey in the north east and Guildford in the south east.
As a result, the seat lost the areas of Ash, Normandy, Seale, Frensham and Farnham, towards its west, but to the east gained the areas of Merrow, Send, Ripley, Ockham, Wisley, Clandon and Horsley from Chertsey.[43]
Constituency boundaries were redrawn in time for the 1885 general election. From 1868 to 1885 the west part of Surrey had been represented by two constituencies, one known as Guildford (which consisted of the town centre of Guildford and little else) and one constituency known as Surrey Western, which comprised the rest of that part of the county of Surrey. The Guildford constituency was both geographically and in size of electorate significantly smaller than the Surrey Western constituency. The 1885 to 1918 constituency boundaries saw the area of west Surrey divided into two constituencies more equal in size of population and land area. The north part of west Surrey was given the constituency name Chertsey, the south part Guildford.[48]
Constituency boundaries were redrawn in time for the 1868 election.
Prior to the 1868 general election, the constituency of Guildford was represented by two Members of Parliament. That was reduced to one from 1868 onwards.
The 1868 to 1885 constituency known as Guildford was geographically limited to an area around the current centre of Guildford town. This is in marked contrast to the various post-1885 versions of the constituency known as Guildford all of which have had a much greater geographical area. The 1868 constituency was, at its maximum, little over one mile east to west, and just over one mile north to south.[51] (Most of the area which is in the modern constituency of Guildford would in 1868 have been part of the Surrey Western Constituency, rather than the Guildford Constituency.)
The 17 December 1866 by-election was caused by Bovill resigning as an MP following his appointment to judicial office, namely Chief Justice of the Court of Common Pleas.
The 11 July 1866 by-election resulted from the need of Bovill to seek re-election upon his appointment as Solicitor General for England and Wales. Long withdrew from the contest before polling.[53]
Party designations for many candidates during the 1830s, 1840s and 1850s can be problematic as party ties were not as strong as those that developed, in Britain, in the late 19th century. Therefore, for the 1830s to 1850s election results, listed below, the term Liberal includes Whigs and Radicals; and the term Conservative includes Tories and Peelites, unless otherwise specified.
↑ At the 1806 general election, two Tories were returned: Onslow and Sumner. However, a petition was lodged, and on 16 March 1807 Sumner's election was overturned in favour of the 3rd-placed candidate, the Whig Chapple Norton
↑ Due to ward changes somewhat notional (Con-Lib Dem) swing and (Con-Lab) was higher: -9.45
↑ Notional Con to SDP swing, most of this swing was Lab and Lib to SDP, shown by the single party swing of -2.2%
↑ Again mostly an opposite sign swing caused by a larger other two-party swing. Here: Lib to Lab
↑ Theoretical Con-Lab swing but wiped out by gains from an additional opponent party, a Liberal
Related Research Articles
South West Surrey was a constituency in the House of Commons of the UK Parliament. Since its 1983 creation, South West Surrey has been represented only by members of the Conservative Party. From 2005, the seat's MP was Jeremy Hunt, who served as chancellor of the Exchequer until 2024, and the former Culture Secretary, Health Secretary and Foreign Secretary.
Taunton was a constituency represented in the House of Commons of the Parliament of the United Kingdom and its predecessors from 1295 to 2010, taking its name from the town of Taunton in Somerset. Until 1918, it was a parliamentary borough, electing two Member of Parliaments (MPs) between 1295 and 1885 and one from 1885 to 1918; the name was then transferred to a county constituency, electing one MP.
Spelthorne is a constituency in Surrey, represented in the House of Commons of the UK Parliament since 2024 by Lincoln Jopp, a Conservative. Its previous MP Kwasi Kwarteng did not stand for re-election in the 2024 United Kingdom general election.
Runnymede and Weybridge is a constituency in Surrey represented in the House of Commons of the UK Parliament since 2019 by Ben Spencer, a Conservative.
East Surrey is a constituency represented in the House of Commons of the UK Parliament since 2019 by Claire Coutinho, a Conservative who formerly served as Secretary of State for Energy Security and Net Zero. The seat covers an affluent area in the English county of Surrey.
Burnley is a constituency centred on the town of Burnley in Lancashire which has been represented since 2024 by Oliver Ryan, of the Labour Party.
Stockport is a constituency represented in the House of Commons of the UK Parliament since 2019 by Navendu Mishra of the Labour Party.
Darlington is the parliamentary constituency for the eponymous market town in County Durham in the North East of England. It is currently represented in the House of Commons of the UK Parliament by Lola McEvoy of the Labour Party, who was first elected in 2024.
Dewsbury was a constituency created in 1868 and abolished in 2024.
Leeds West was a borough constituency covering the western part of the city of Leeds, West Yorkshire which is represented in the House of Commons of the Parliament of the United Kingdom. It elected one Member of Parliament (MP) by the first-past-the-post system of election. With the exception of the Parliament of 1983–87, the seat was held by Labour since 1945.
Leeds East is a constituency represented in the House of Commons of the UK Parliament since 2015 by Richard Burgon of the Labour Party until his suspension and whip withdrawn on 23 July 2024, as a result of voting to scrap the two child benefit cap. He now sits as an Independent MP until the whip is re-established.
Leominster was a parliamentary constituency represented until 1707 in the House of Commons of England, then until 1801 in that of Great Britain, and finally until 2010, when it disappeared in boundary changes, in the Parliament of the United Kingdom.
Ludlow was a constituency in Shropshire represented in the House of Commons of the UK Parliament.
Stafford is a constituency represented in the House of Commons of the UK Parliament since 2024 by Leigh Ingham from the Labour Party.
Woking is a constituency represented in the House of Commons of the UK Parliament since 2024 by Will Forster, a Liberal Democrat. Since it was first created for the 1950 general election, it had only ever returned Conservative Party candidates until it elected a Liberal Democrat for the first time in 2024.
Mole Valley is a former constituency in Surrey represented in the House of Commons of the UK Parliament since 1997 by Sir Paul Beresford, a Conservative, until it was abolished in 2024, primarily replaced by Dorking and Horley.
Reigate is a constituency in Surrey represented in the House of Commons of the UK Parliament since 2024 by Rebecca Paul, of the Conservative Party.
Esher was a borough constituency represented in the House of Commons of the Parliament of the United Kingdom. It elected one Member of Parliament (MP) by the first past the post system of election. In the general elections during its 47-year lifetime it was won by three Conservatives successively. In area it shrank in 1974, then regrew in 1983 taking in four sparsely inhabited wards which proved to be temporary, as omitted from the successor seat, Esher and Walton.
West Surrey was a parliamentary constituency in the county of Surrey, which returned two Members of Parliament (MPs) to the House of Commons of the Parliament of the United Kingdom, elected by the bloc vote system.
Godalming and Ash is a constituency represented in the House of Commons of the UK Parliament that was first contested at the 2024 general election. It was created as a result of the 2023 Periodic Review of Westminster constituencies.
↑ "Town Talk". Usk Observer, Raglan Herald, and Monmouthshire Central Advertiser. 30 October 1858. p.2. Retrieved 13 May 2018– via British Newspaper Archive.
This page is based on this Wikipedia article Text is available under the CC BY-SA 4.0 license; additional terms may apply. Images, videos and audio are available under their respective licenses.