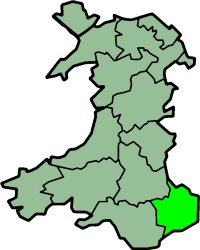
Monmouth (UK Parliament constituency)

Last updated

Monmouth
Mynwy
County constituency
for the House of Commons
Monmouth2007Constituency.svg
Boundary of Monmouth
Mynwy in Wales
Preserved county Gwent
Electorate 65,432 (December 2010) [1]
Major settlements Abergavenny, Chepstow, Monmouth
Current constituency
Created 1918
Member of Parliament David Davies (Conservative)
SeatsOne
Created from Monmouth Boroughs, North Monmouthshire and South Monmouthshire
Overlaps
Senedd Monmouth, South Wales East

Monmouth (Welsh : Mynwy) is a county constituency [n 1] of the House of Commons of the Parliament of the United Kingdom (at Westminster). The seat was created for the 1918 general election. Since 2005 the Member of Parliament (MP) has been David Davies of the Conservative Party. [n 2]

Contents

The Monmouth Senedd constituency, created in 1999, has normally the same boundaries as the Westminster constituency. These cover a large area, omitting the mainly urban areas of Blaenau Gwent in the west and Newport, Wales in the south.

The constituency is set to be abolished, as part of the 2023 Periodic Review of Westminster constituencies and under the June 2023 final recommendations of the Boundary Commission for Wales for the next United Kingdom general election. Its wards is to be split between Monmouthshire and Torfaen. [2]

History

The constituency is considered a safe seat of the Conservative Party although the seat has been won by the Labour Party in three general elections – in addition to the 1991 by-election.

The current MP is the Conservative David Davies, elected in 2005 and a former member for the Senedd seat of the same name. To avoid confusion with the Yorkshire Conservative David Davis, he is named in Hansard as "David T. C. Davies".

Boundaries

Monmouth (UK Parliament constituency)
Map of current boundaries

1983 onwards

The constituency is one of eight covering the preserved county of Gwent. The other seven are Blaenau Gwent, Caerphilly, Islwyn, Merthyr Tydfil and Rhymney, Newport East, Newport West and Torfaen. Merthyr Tydfil and Rhymney, however, straddles the boundary with the preserved county of Mid Glamorgan. It covers most of current local authority of Monmouthshire, with the main towns being Chepstow, Monmouth and Abergavenny.

For the 2010 general election, there were no changes to the boundaries of the Monmouth constituency stemming from the Fifth Review of the Boundary Commission for Wales. [3] Likewise there were no boundary changes in 1997.

1918 to 1983

As first used in the 1918 general election, the constituency was a creation of the Representation of the People Act 1918 as one of six constituencies covering the county of Monmouth. Prior to the 1918 election the county had been covered, nominally, by the county constituencies of Northern Monmouthshire, Southern Monmouthshire, and Western Monmouthshire, and the Monmouth Boroughs borough constituency. By 1918, however, administrative county boundaries were out of alignment with constituency boundaries. The new constituency boundaries took account of the new local government boundaries.

The other Monmouthshire constituencies defined by the 1918 legislation were the county constituencies of Abertillery, Bedwellty, Ebbw Vale and Pontypool, and the borough constituency of Newport. This general pattern was maintained until 1983, nine years after the administrative county they were based on had been abolished, but there were some boundary changes during the 1918 to 1983 period.

County of Monmouth WalesMonmouthshireTrad.png
County of Monmouth

In 1918 the Monmouth constituency was defined as consisting of the municipal boroughs of Abergavenny, and Monmouth, the urban districts of Caerleon, Chepstow, and Usk, the rural districts of Abergavenny, Chepstow, Magor, Monmouth, Cwmbran and Pontypool, and part of the rural district of St Mellons. [4] The same boundaries were used for the general elections of 1922, 1923, 1924, 1929, 1931, 1935 and 1945.

New boundaries, created by the House of Commons (Redistribution of Seats) Act 1949, were used for the 1950 general election, and the Monmouth constituency was defined as consisting of the municipal boroughs of Abergavenny and Monmouth, the urban districts of Caerleon, Chepstow, Cwmbran and Usk, and the rural districts of Abergavenny, Chepstow, Magor and St Mellons, Monmouth, and Pontypool. [4]

For the 1951 general election, there was some alteration to the boundaries of rural district of Magor and St Mellons. [4]

The constituency was redefined again for the 1955 general election, taking account of new local government boundaries. The result was the same list of boroughs and districts as for the 1951 election. [4] 1951 boundaries were used also in the general elections of 1959, 1964, 1966, 1970, February 1974, October 1974 and 1979.

In 1974, under the Local Government Act 1972, the local government county of Monmouth was abolished. For the 1983 general election, new constituency boundaries were drawn, taking account of new local government boundaries.

Members of Parliament

The following list does not include MPs who actually represented Monmouth Boroughs:

ElectionMember [5] Party
1918 Leolin Forestier-Walker Conservative
1934 by-election John Herbert Conservative
1939 by-election Leslie Pym Conservative
1945 by-election Peter Thorneycroft Conservative
1966 Donald Anderson Labour
1970 Sir John Stradling Thomas Conservative
1991 by-election Huw Edwards Labour
1992 Roger Evans Conservative
1997 Huw Edwards Labour
2005 David Davies Conservative

Elections

Elections in the 1910s

General election 1918: Monmouth [6]
PartyCandidateVotes%±%
Unionist Leolin Forestier-Walker 9,164 59.7 N/A
Liberal Hubert Martineau 6,18940.3N/A
Majority2,97519.4N/A
Turnout 15,35355.7N/A
Registered electors 27,575
Unionist win (new seat)

Elections in the 1920s

General election 1922: Monmouth [6]
PartyCandidateVotes%±%
Unionist Leolin Forestier-Walker Unopposed
Registered electors 29,779
Unionist hold
General election 1923: Monmouth [7] [6]
PartyCandidateVotes%±%
Unionist Leolin Forestier-Walker 12,697 59.9 N/A
Liberal Morgan Griffith8,48740.1N/A
Majority4,21019.8N/A
Turnout 21,18480.9N/A
Registered electors 29,889
Unionist hold Swing N/A
General election 1924: Monmouth [6]
PartyCandidateVotes%±%
Unionist Leolin Forestier-Walker 16,510 71.8 +11.9
Labour Luke Bateman 6,46928.2N/A
Majority10,04143.6-20.2
Turnout 22,97974.1+3.2
Registered electors 31,031
Unionist hold Swing
General election 1929: Monmouth [6]
PartyCandidateVotes%±%
Unionist Leolin Forestier-Walker 16,353 49.3 -22.5
Liberal Richard Charles Williams8,58225.8N/A
Labour Luke Bateman 8,26824.9-3.3
Majority7,77123.5-20.1
Turnout 33,20378.9+4.8
Registered electors 42,070
Unionist hold Swing

Elections in the 1930s

General election 1931: Monmouth [6]
PartyCandidateVotes%±%
Conservative Leolin Forestier-Walker 24,829 70.8 +21.5
Labour D. Hughes10,21729.2+4.3
Majority14,61241.6+18.1
Turnout 45,04678.0-0.9
Registered electors 44,929
Conservative hold Swing
1934 Monmouth by-election [6]
PartyCandidateVotes%±%
Conservative John Herbert 20,640 65.0 -5.8
Labour D. Hughes11,09435.0+5.8
Majority9,54630.0-11.6
Turnout 31,73469.2-8.8
Registered electors 45,885
Conservative hold Swing -5.8
General election 1935: Monmouth [6]
PartyCandidateVotes%±%
Conservative John Herbert 23,262 63.4 -7.4
Labour Michael Mackintosh Foot 13,45436.6+7.4
Majority9,80826.8-14.8
Turnout 36,71676.8-1.4
Registered electors 47,792
Conservative hold Swing -1.6
1939 Monmouth by-election [6]
PartyCandidateVotes%±%
Conservative Leslie Pym 17,358 60.1 -3.3
Labour Frank Rivers Hancock11,54339.9+3.3
Majority5,81520.2-6.6
Turnout 28,90158.2-18.6
Registered electors 49,690
Conservative hold Swing -3.3

Elections in the 1940s

General election 1945: Monmouth [6]
PartyCandidateVotes%±%
Conservative Leslie Pym 22,195 51.9 -11.5
Labour A B L Oakley20,54348.1+11.5
Majority1,6523.8-23.0
Turnout 42,73872.0-4.8
Registered electors 59,359
Conservative hold Swing -8.2
1945 Monmouth by-election [6]
PartyCandidateVotes%±%
Conservative Peter Thorneycroft 21,092 52.7 +0.8
Labour A B L Oakley18,95347.3-0.8
Majority2,1395.4+1.6
Turnout 40,04539.8-32.2
Registered electors 60,013
Conservative hold Swing +0.8

Elections in the 1950s

General election 1950: Monmouth [8]
PartyCandidateVotes%±%
Conservative Peter Thorneycroft 21,956 55.3 +3.4
Labour G P Thomas17,72544.7-3.4
Majority4,23110.6+6.8
Turnout 39,68183.1+11.1
Registered electors 47,725
Conservative hold Swing
General election 1951: Monmouth [8]
PartyCandidateVotes%±%
Conservative Peter Thorneycroft 22,475 55.6 +0.3
Labour Josephine Richardson 17,95244.4-0.3
Majority4,52311.2+0.6
Turnout 40,24783.7+0.6
Registered electors 48,314
Conservative hold Swing
General election 1955: Monmouth [8]
PartyCandidateVotes%±%
Conservative Peter Thorneycroft 22,970 57.2 +1.6
Labour Josephine Richardson 17,17342.8-1.6
Majority5,79714.4+3.2
Turnout 40,14381.5-2.2
Registered electors 49,252
Conservative hold Swing
General election 1959: Monmouth [8]
PartyCandidateVotes%±%
Conservative Peter Thorneycroft 25,422 57.0 -0.2
Labour Gordon Parry 19,16543.0+0.2
Majority6,25714.0-0.4
Turnout 44,58783.1+1.6
Registered electors 53,628
Conservative hold Swing

Elections in the 1960s

General election 1964: Monmouth [8]
PartyCandidateVotes%±%
Conservative Peter Thorneycroft 22,635 44.1 -12.9
Labour A Calvin Kerr21,92142.7-0.3
Liberal D Hywell Davies6,76413.2N/A
Majority7141.4-12.6
Turnout 51,05084.4+1.3
Registered electors 60,803
Conservative hold Swing
General election 1966: Monmouth [8]
PartyCandidateVotes%±%
Labour Donald Anderson 28,619 52.7 +10.0
Conservative Peter Thorneycroft 25,65447.3+3.2
Majority2,9655.4N/A
Turnout 54,27384.3-0.1
Registered electors 64,356
Labour gain from Conservative Swing

Elections in the 1970s

General election 1970: Monmouth [8]
PartyCandidateVotes%±%
Conservative John Stradling Thomas 28,312 46.5 -0.8
Labour Donald Anderson 26,95744.3-8.4
Liberal David H Hando4,6016.7N/A
Plaid Cymru Stuart K Neale1,5012.5N/A
Majority1,3552.2N/A
Turnout 61,37180.5-3.8
Registered electors 75,602
Conservative gain from Labour Swing
General election February 1974: Monmouth [9]
PartyCandidateVotes%±%
Conservative John Stradling Thomas 27,269 43.7 -2.8
Labour F R Thompson22,70736.4-7.9
Liberal David H Hando11,50618.4+11.7
Plaid Cymru E H Spanwick9301.5-1.0
Majority4,5627.3+5.1
Turnout 62,41284.1+3.6
Registered electors 74,173
Conservative hold Swing
General election October 1974: Monmouth [10]
PartyCandidateVotes%±%
Conservative John Stradling Thomas 25,460 42.8 -0.9
Labour Richard Faulkner 23,11836.9+0.5
Liberal David H Hando10,07616.9-1.5
Plaid Cymru T Brimmacombe8391.4-0.1
Majority2,3423.9-4.4
Turnout 59,49379.5-4.6
Registered electors 74,838
Conservative hold Swing
General election 1979: Monmouth [11]
PartyCandidateVotes%±%
Conservative John Stradling Thomas 33,547 50.5 +7.7
Labour T M Steel23,78535.8-1.1
Liberal David H Hando8,49412.8-4.1
Plaid Cymru Gwyn Williams6411.0-0.4
Majority9,76214.7+10.8
Turnout 66,46783.0+3.5
Registered electors 80,085
Conservative hold Swing

Elections in the 1980s

General election 1983: Monmouth [12]
PartyCandidateVotes%±%
Conservative John Stradling Thomas 21,746 49.2 -1.3
SDP Clive Lindley12,40328.0+15.2
Labour Christopher Short9,59321.7-14.1
Plaid Cymru Gwynddri Williams4931.1+0.1
Majority9,34321.2+6.5
Turnout 44,23578.8-4.2
Registered electors 56,112
Conservative hold Swing
General election 1987: Monmouth [13]
PartyCandidateVotes%±%
Conservative John Stradling Thomas 22,387 47.5 −1.7
Labour Katrina Gass13,03727.7+6.0
SDP Clive Lindley11,31324.0−4.0
Plaid Cymru Sian Meredudd3630.8−0.3
Majority9,53019.8−1.4
Turnout 47,10080.8+2.0
Registered electors 58,468
Conservative hold Swing −2.2

Elections in the 1990s

1991 Monmouth by-election [14]
PartyCandidateVotes%±%
Labour Huw Edwards 17,733 39.3 +11.6
Conservative Roger Evans 15,32734.0−13.5
Liberal Democrats Frances David11,16424.8N/A
Monster Raving Loony Screaming Lord Sutch 3140.7N/A
Plaid Cymru (Green)Melvin Witherden2770.6-0.2
Unitax IndependentPeter Carpenter1640.4N/A
Corrective Party Lindi St Clair 1210.3N/A
Majority2,4065.3N/A
Turnout 45,10075.8-5.0
Registered electors 59,460
Labour gain from Conservative Swing -12.6
General election 1992: Monmouth [15] [16]
PartyCandidateVotes%±%
Conservative Roger Evans 24,059 47.3 −0.2
Labour Huw Edwards 20,85541.0+13.3
Liberal Democrats Frances David5,56210.9−13.1
Plaid Cymru (Green)Melvin Witherden4310.8±0.0
Majority3,2046.3-13.5
Turnout 50,90786.1+5.3
Registered electors 59,147
Conservative hold Swing −6.8
General election 1997: Monmouth [17] [18]
PartyCandidateVotes%±%
Labour Huw Edwards 23,404 47.7 +6.7
Conservative Roger Evans 19,22639.2-8.1
Liberal Democrats Mark Williams 4,6899.6-1.3
Referendum Timothy Warry1,1902.4N/A
Plaid Cymru Alan Cotton5161.1+0.3
Majority4,1788.5N/A
Turnout 49,02580.5−5.6
Registered electors 60,873
Labour gain from Conservative Swing +7.4

Elections in the 2000s

General election 2001: Monmouth [19] [20]
PartyCandidateVotes%±%
Labour Huw Edwards 19,021 42.8 −4.9
Conservative Roger Evans 18,63741.9+2.7
Liberal Democrats Neil Parker5,08011.4+1.8
Plaid Cymru Marc Hubbard1,0682.4+1.3
UKIP David Rowlands6561.5N/A
Majority3840.9−7.6
Turnout 44,46271.5−9.0
Registered electors 62,200
Labour hold Swing −3.8
General election 2005: Monmouth [21] [22]
PartyCandidateVotes%±%
Conservative David Davies 21,396 46.9 +5.0
Labour Huw Edwards 16,86937.0−5.8
Liberal Democrats Phylip A. D. Hobson5,85212.8+1.4
Plaid Cymru Jonathan Clark9932.2−0.2
UKIP John Bufton 5431.2−0.3
Majority4,5279.9N/A
Turnout 45,65372.4+0.9
Registered electors 62,233
Conservative gain from Labour Swing +5.4

Elections in the 2010s

General election 2010: Monmouth [23] [24] [25]
PartyCandidateVotes%±%
Conservative David Davies 22,466 48.3 +1.4
Labour Hamish Sandison12,04125.9−11.1
Liberal Democrats Martin Blakebrough9,02619.4+6.6
Plaid Cymru Jonathan Clark1,2732.7+0.5
UKIP Derek Rowe1,1262.4+1.2
Green Steve Millson5871.3N/A
Rejected ballots75
Majority10,42522.4+12.5
Turnout 46,51972.2−0.2
Registered electors 64,538
Conservative hold Swing +6.2

Of the 75 rejected ballots:

General election 2015: Monmouth [26] [27] [28]
PartyCandidateVotes%±%
Conservative David Davies 23,701 49.9 +1.6
Labour Ruth Jones 12,71926.8+0.9
UKIP Gareth Dunn4,94210.4+8.0
Liberal Democrats Veronica German 2,4965.3−14.1
Plaid Cymru Jonathan Clark1,8753.9+1.2
Green Christopher Were1,6293.4+2.1
English Democrat Stephen Morris1000.2N/A
Rejected ballots104
Majority10,98223.1+0.7
Turnout 47,46276.2+4.0
Registered electors 62,248
Conservative hold Swing +0.3

Of the 104 rejected ballots:

General election 2017: Monmouth [29] [30]
PartyCandidateVotes%±%
Conservative David Davies 26,411 53.1 +3.2
Labour Ruth Jones 18,20536.6+9.8
Liberal Democrats Veronica German 2,0644.2−1.1
Plaid Cymru Carole Damon1,3382.7-1.2
Green Ian Chandler9541.9-1.5
UKIP Roy Neale7621.5-8.9
Rejected ballots64
Majority8,20616.5-6.6
Turnout 49,73476.6+0.4
Registered electors 64,909
Conservative hold Swing -3.3

Of the 64 rejected ballots:

General election 2019: Monmouth [31] [32] [33]
PartyCandidateVotes%±%
Conservative David Davies 26,160 52.1 -1.0
Labour Yvonne Murphy16,17832.2-4.4
Liberal Democrats Alison Willott4,9099.8+5.6
Green Ian Chandler1,3532.7+0.8
Plaid Cymru Hugh Kocan1,1822.4-0.3
Independent Martyn Ford4350.9N/A
Rejected ballots136
Majority9,98219.9+3.4
Turnout 50,21774.8-1.8
Registered electors 67,094
Conservative hold Swing +1.7

Of the 136 rejected ballots:

See also

Notes

  1. A county constituency (for the purposes of election expenses and type of returning officer)
  2. As with all constituencies, the constituency elects one Member of Parliament (MP) by the first past the post system of election at least every five years.

Related Research Articles

<span class="mw-page-title-main">Aberavon (UK Parliament constituency)</span> Parliamentary constituency in the United Kingdom, 1918 onwards

Aberavon is a constituency represented in the House of Commons of the Parliament of the United Kingdom since 2015 by Stephen Kinnock of the Welsh Labour Party. It includes the town of Aberavon, although the largest town in the constituency is Port Talbot.

<span class="mw-page-title-main">Monmouthshire (historic)</span> Historic county in Wales

Until 1974, Monmouthshire, also formerly known as the County of Monmouth, was an administrative county in the south-east of Wales, on the border with England, and later classed as one of the thirteen historic counties of Wales. Its area now corresponds approximately to the present principal areas of Monmouthshire, Blaenau Gwent, Newport and Torfaen, and those parts of Caerphilly and Cardiff east of the Rhymney River.

<span class="mw-page-title-main">Ynys Môn (UK Parliament constituency)</span> Parliamentary constituency in the UK

Ynys Môn is a constituency of the House of Commons of the Parliament of the United Kingdom. It elects one Member of Parliament (MP) by the first past the post system of election.

<span class="mw-page-title-main">Neath (UK Parliament constituency)</span> Parliamentary constituency in the United Kingdom, 1918 onwards

Neath is a constituency represented in the House of Commons of the UK Parliament since 2015 by Christina Rees, a Labour and Co-operative MP. As of 13 October 2022, she is currently suspended from the party and therefore sitting as an independent, following allegations of bullying.

<span class="mw-page-title-main">Swansea West (UK Parliament constituency)</span> Parliamentary constituency in the United Kingdom, 1918 onwards

Swansea West is a constituency of the House of Commons of the Parliament of the United Kingdom. It elects one Member of Parliament (MP) by the first past the post system of election, and is currently represented by Geraint Davies of Labour Co-op, who was first elected in the constituency in 2010.

<span class="mw-page-title-main">Blaenau Gwent (UK Parliament constituency)</span> Parliamentary constituency in the United Kingdom, 1983 onwards

Blaenau Gwent is a constituency in South Wales, represented in the House of Commons of the UK Parliament since 2010 by Nick Smith of the Labour Party.

<span class="mw-page-title-main">Brecon and Radnorshire (UK Parliament constituency)</span> Parliamentary constituency in the United Kingdom, 1918 onwards

Brecon and Radnorshire is a county constituency in Wales of the House of Commons of the Parliament of the United Kingdom. Created in 1918, it elects one Member of Parliament (MP) by the first-past-the-post system of election. The constituency is represented by Fay Jones of the Conservative Party, who defeated incumbent Jane Dodds of the Liberal Democrats at the 2019 general election.

<span class="mw-page-title-main">Bridgend (UK Parliament constituency)</span> Parliamentary constituency in the United Kingdom, 1983 onwards

Bridgend is a constituency represented in the House of Commons of the UK Parliament since 2019 by Jamie Wallis, a Conservative.

<span class="mw-page-title-main">Caerphilly (UK Parliament constituency)</span> Parliamentary constituency in the United Kingdom, 1918 onwards

Caerphilly is a constituency centred on the town of Caerphilly in South Wales, represented in the House of Commons of the UK Parliament since 2001 by Wayne David of the Labour Party.

<span class="mw-page-title-main">Cardiff West (UK Parliament constituency)</span> Parliamentary constituency in the United Kingdom, 1950 onwards

Cardiff West is a constituency represented in the House of Commons of the UK Parliament since 2001 by Kevin Brennan of the Labour Party.

<span class="mw-page-title-main">Gower (UK Parliament constituency)</span> Parliamentary constituency in the United Kingdom, 1885 onwards

Gower is a constituency created in 1885 and represented in the House of Commons of the UK Parliament by one Member of Parliament (MP). Tonia Antoniazzi of the Labour Party became its MP after winning it from Conservative Byron Davies in the 2017 UK general election. Her party had previously represented the seat from 1909 until 2015.

<span class="mw-page-title-main">Islwyn (UK Parliament constituency)</span> Parliamentary constituency in the United Kingdom, 1983 onwards

Islwyn is a constituency in Wales represented in the House of Commons of the Parliament of the United Kingdom. The area, historically known for coal-mining, has voted for Labour Party candidates since it was created effective at the 1983 general election. Islwyn's first Member of Parliament (MP) was Neil Kinnock, who represented it until he resigned from Parliament in 1995. Kinnock also served as Leader of the Labour Party and Leader of the Opposition from 1983 until 1992. The constituency's current MP is Chris Evans, first elected at the 2010 general election.

<span class="mw-page-title-main">Llanelli (UK Parliament constituency)</span> Parliamentary constituency in the United Kingdom, 1918 onwards

Llanelli is a constituency of the House of Commons of the Parliament of the United Kingdom. From 1918 to 1970 the official spelling of the constituency name was Llanelly. It elects one Member of Parliament (MP) by the first past the post system of election. Since 2005, it is currently represented by Nia Griffith of the Labour Party.

<span class="mw-page-title-main">Merthyr Tydfil and Rhymney (UK Parliament constituency)</span> Parliamentary constituency in the United Kingdom, 1983 onwards

Merthyr Tydfil and Rhymney is a constituency represented in the House of Commons of the UK Parliament since 2015 by Gerald Jones of the Welsh Labour Party. It was established for the 1983 general election.

<span class="mw-page-title-main">Newport East (UK Parliament constituency)</span> Parliamentary constituency in the United Kingdom, 1983 onwards

Newport East is a constituency in the city of Newport, South Wales, represented in the House of Commons of the UK Parliament since 2005 by Jessica Morden of the Labour Party.

<span class="mw-page-title-main">Ogmore (UK Parliament constituency)</span> Parliamentary constituency in the United Kingdom, 1918 onwards

Ogmore is a constituency created in 1918 represented in the House of Commons of the UK Parliament by Chris Elmore of the Labour Party.

<span class="mw-page-title-main">Rhondda (UK Parliament constituency)</span> Parliamentary constituency in the United Kingdom, 1974 onwards

Rhondda is a constituency in Wales represented in the House of Commons of the UK Parliament since 2001 by Chris Bryant of the Labour Party.

<span class="mw-page-title-main">Swansea East (UK Parliament constituency)</span> Parliamentary constituency in the United Kingdom, 1918 onwards

Swansea East is a borough constituency represented in the House of Commons of the Parliament of the United Kingdom by Carolyn Harris of the Labour Party.

<span class="mw-page-title-main">Torfaen (UK Parliament constituency)</span> Parliamentary constituency in the United Kingdom, 1983 onwards

Torfaen is a constituency in Wales represented in the House of Commons of the UK Parliament since 2015 by Nick Thomas-Symonds, a member of the Labour Party who also serves as the Shadow Secretary of State for International Trade. It was established for the 1983 general election.

<span class="mw-page-title-main">Wrexham (UK Parliament constituency)</span> Parliamentary constituency in the United Kingdom, 1918 onwards

Wrexham is a parliamentary constituency centred on the city of Wrexham in the preserved county of Clwyd, Wales in the United Kingdom. It was created in 1918, and is represented in the House of Commons of the UK Parliament from December 2019 by Sarah Atherton of the Conservative Party.

References

  1. "Beyond 20/20 WDS – Table view". 2011 Electorate Figures. StatsWales. 1 December 2010. Retrieved 13 March 2011.
  2. 2023 Review of Parliamentary Constituencies - The 2023 Review of Parliamentary Constituencies in Wales (PDF). Boundary Commission for Wales. 28 June 2023.
  3. Boundary Commission for Wales website
    The Parliamentary Constituencies and Assembly Electoral Regions (Wales) Order 2006, OPSI website
  4. 1 2 3 4 Boundaries of Parliamentary Constituencies 1885-1972 ( ISBN   0-900178-09-4), F. W. S. Craig 1972
    Craig attributes the 1951 alteration to SI 1851/1390 under section 2(3) of the House of Commons (Redistribution of Seats) Act 1949
  5. Leigh Rayment's Historical List of MPs – Constituencies beginning with "M" (part 3)
  6. 1 2 3 4 5 6 7 8 9 10 11 Craig, F. W. S. (1969). British parliamentary election results 1918–1945 (1 ed.). Glasgow: Political Reference Publications. ISBN   0-900178-019. p.567
  7. Etholiadau'r ganrif 1885–1997, Beti Jones
  8. 1 2 3 4 5 6 7 Craig, F. W. S. (1971). British parliamentary election results 1950-1970 (1 ed.). Chichester: Political Reference Publications. ISBN   9780900178023. Page 587
  9. "Politics Resources". Election February 1974. Politics Resources. 28 February 1974. Archived from the original on 11 August 2011. Retrieved 2 February 2021.
  10. "Politics Resources". Election October 1974. Politics Resources. 10 October 1974. Archived from the original on 11 August 2011. Retrieved 2 February 2021.
  11. "Politics Resources". Election 1979. Politics Resources. 3 May 1979. Archived from the original on 11 August 2011. Retrieved 2 February 2021.
  12. "Election Data 1983". Electoral Calculus. Archived from the original on 15 October 2011. Retrieved 18 October 2015.
  13. "Election Data 1987". Electoral Calculus. Archived from the original on 15 October 2011. Retrieved 18 October 2015.
  14. Boothroyd, David. "Results of Byelections in the 1987–92 Parliament". United Kingdom Election Results. Retrieved 1 October 2015.
  15. "Election Data 1992". Electoral Calculus. Archived from the original on 15 October 2011. Retrieved 18 October 2015.
  16. "Politics Resources". Election 1992. Politics Resources. 9 April 1992. Archived from the original on 24 July 2011. Retrieved 6 December 2010.
  17. "Election Data 1997". Electoral Calculus. Archived from the original on 15 October 2011. Retrieved 18 October 2015.
  18. "BBC NEWS>VOTE 2001>Results and Constituencies>Monmouth". Vote 2001. BBC News. 1 May 1997. Retrieved 4 April 2020.
  19. "Election Data 2001". Electoral Calculus. Archived from the original on 15 October 2011. Retrieved 18 October 2015.
  20. "BBC NEWS > Monmouth". Vote 2001. BBC News. 7 June 2001. Retrieved 4 April 2020.
  21. "Election Data 2005". Electoral Calculus. Archived from the original on 15 October 2011. Retrieved 18 October 2015.
  22. "Monmouth parliamentary constituency - Election 2005" via www.bbc.co.uk.
  23. "Election Data 2010". Electoral Calculus. Archived from the original on 26 July 2013. Retrieved 17 October 2015.
  24. "BBC News | Election 2010 | Constituency | Monmouth". news.bbc.co.uk. Retrieved 4 April 2020.
  25. 1 2 3 4 "Results" (PDF). Monmouthshire Council. Retrieved 4 April 2020.
  26. "Election Data 2015". Electoral Calculus. Archived from the original on 17 October 2015. Retrieved 17 October 2015.
  27. "Monmouth Parliamentary constituency". Election 2015 Results. BBC. Retrieved 4 April 2020.
  28. 1 2 3 4 "Monmouth Results" (PDF). UK Parliamentary Elections May 2015 results. Monmouthshire County Council. Retrieved 4 April 2020.
  29. "Monmouth Parliamentary constituency". Election 2017 Results. BBC . Retrieved 4 April 2020.
  30. 1 2 3 "2017 Results". Monmouthshire Council. Retrieved 4 April 2020.
  31. "Statement of Persons Nominated and Notice of Poll" (PDF). Monmouthshire County Council. 14 November 2019. Archived (PDF) from the original on 14 November 2019. Retrieved 14 November 2019.
  32. "Monmouth parliamentary constituency – Election 2019". BBC News. Retrieved 18 December 2019.
  33. 1 2 3 "Election-Results/General-Election-2019". Monmouthshire Council. Retrieved 4 April 2020.

Further reading

Parliament of the United Kingdom
Preceded by Constituency represented by the chancellor of the Exchequer
1957–1958
Succeeded by

51°46′05″N2°48′40″W / 51.768°N 2.811°W / 51.768; -2.811