Results of the 2019 European Parliament election in the United Kingdom

Last updated

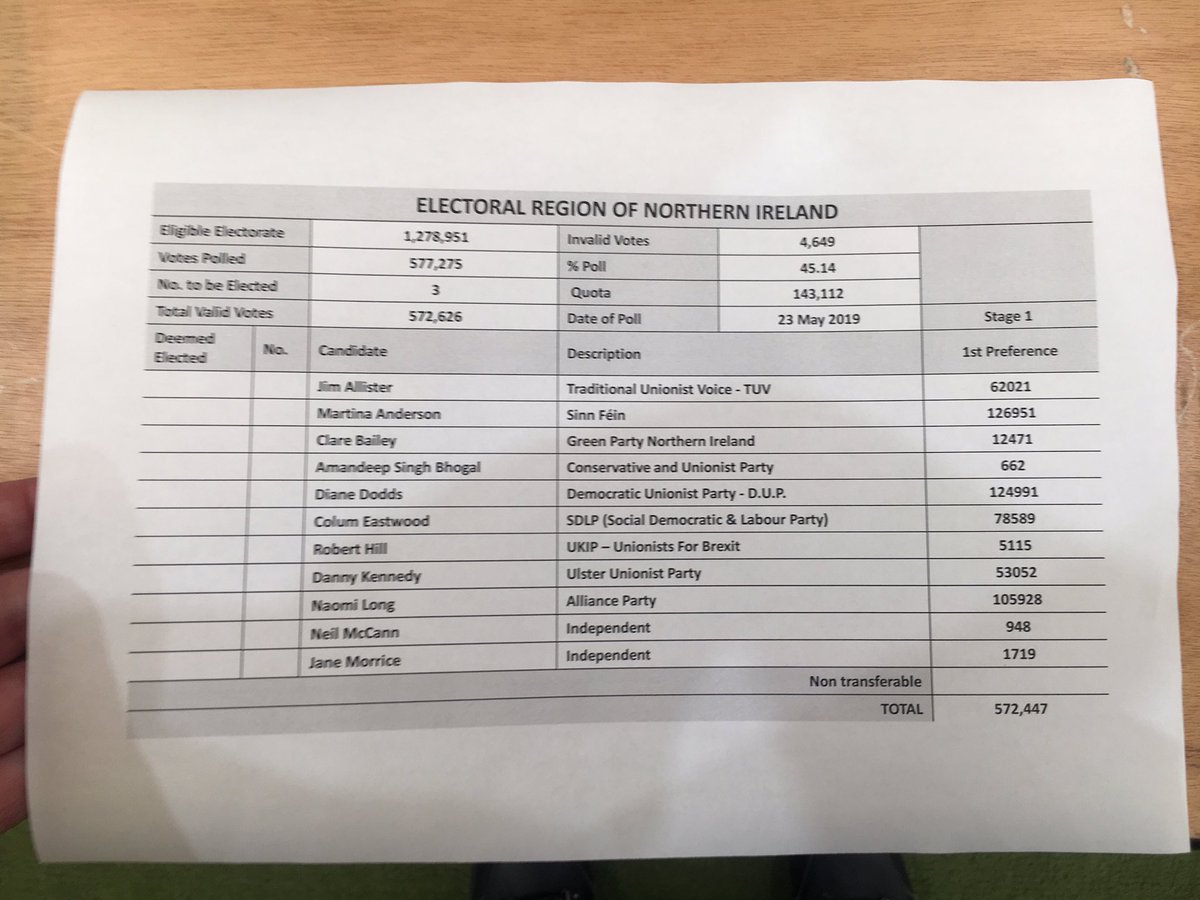
The United Kingdom's component of the 2019 European Parliament election was held on Thursday 23 May 2019 and the local results were to be announced after 22:00 BST on Sunday 26 May 2019 when all the other EU countries had voted although the counting of votes started at 18:00 BST on that evening. The nine English regions and Wales announced their regional results overnight. [1] Local results were also announced overnight in all Scottish council areas with the single exception of Na h-Eileanan Siar (Western Isles), which did not count their votes until the following morning due to local opposition to counting on the Sabbath. Thus the Scottish national declaration did not take place until around lunchtime on Monday 27 May. [2] Northern Ireland also did not start to count their votes until the Monday morning as votes are by tradition not counted here on Sunday either, as a religious observance. Furthermore, due to the use of the single transferable vote (STV), it was expected that counting could take up to two days, [3] but in the event it was completed on 27 May.

Contents

In the election there were a total of 373 voting areas across twelve regions, using the same regional boundaries as used in all previous European Parliamentary elections since 1999, under the provisions of the European Parliamentary Elections Act 2002, with votes counted at local authority level. In England the 317 local government districts were used as the voting areas; these consist of all unitary authorities, all metropolitan boroughs, all shire districts, the London boroughs, the City of London and the Isles of Scilly. The nine regions of England which make up the regional constituencies were then used to count the votes, with Gibraltar being regarded as part of South West England. Northern Ireland due to using a different form of Proportional representation than the rest of the UK was a single voting area and national constituency. In Scotland the 32 Scottish council areas were used as voting areas within its single national constituency whilst in Wales the 22 Welsh council areas were used as the voting areas within its single national constituency.

Overview

Results of the 2019 European Parliament election in the United Kingdom [4]
PartyAllianceVotesSeats
Number%+/−Seats+/−%
Brexit Party NI 5,248,53330.5new party29new party39.7
Liberal Democrats ALDE 3,367,28419.6Increase2.svg13.016Increase2.svg1521.9
Labour Party S&D 2,347,25513.7Decrease2.svg10.810Decrease2.svg1013.7
Green Party of England and Wales G/EFA 1,881,30611.0Increase2.svg4.07Increase2.svg49.6
Conservative Party ECR 1,512,8098.8Decrease2.svg14.34Decrease2.svg155.5
Scottish National Party G/EFA 594,5533.5Increase2.svg1.13Increase2.svg14.1
Plaid Cymru G/EFA 163,9281.0Increase2.svg0.31Steady2.svg1.4
Sinn Féin GUE/NGL 126,9510.7Decrease2.svg0.21Steady2.svg1.4
Democratic Unionist Party NI 124,9910.7Decrease2.svg0.11Steady2.svg1.4
Alliance Party of Northern Ireland ALDE 105,9280.6Increase2.svg0.31Increase2.svg11.4
Change UK EPP [party 1] 571,8463.3new party0new party0
UK Independence Party 554,4633.2Decrease2.svg23.40Decrease2.svg240
Scottish Green Party G/EFA 129,6030.8Increase2.svg0.10Steady2.svg0
Social Democratic and Labour Party S&D 78,5890.5Decrease2.svg0.00Steady2.svg0
Traditional Unionist Voice NI 62,0210.4Decrease2.svg0.10Steady2.svg0
Ulster Unionist Party ECR 53,0520.3Decrease2.svg0.20Decrease2.svg10
Yorkshire Party G/EFA 50,8420.3Increase2.svg0.20Steady2.svg0
English Democrats 39,9380.2Decrease2.svg0.60Steady2.svg0
UK European Union Party 33,5760.2new party0new party0
Animal Welfare Party 25,2320.2Increase2.svg0.00Steady2.svg0
Women's Equality Party 23,7660.1new party0new party0
Green Party in Northern Ireland G/EFA 12,4710.1Increase2.svg0.00Steady2.svg0
Independent Network 7,641<0.1new party0Steady2.svg0
Socialist Party of Great Britain 3,505<0.1Increase2.svg0.00Steady2.svg0
Independent 80,2800.5Increase2.svg0.50Steady2.svg0
Valid Votes17,199,70199.9273Steady2.svg0
Rejected Votes15,1380.08
Overall turnout17,214,83937.18Increase2.svg1.4
  1. Change UK's sole MEP before the election, Richard Ashworth, was a member of the EPP group.

Results by constituency and local areas

Map of 2019 European Parliament election in the United Kingdom.svg
European Parliament election, 2019 (United Kingdom) area results.svg
Results by country/region (left) and by local authority areas (right). The Brexit Party won every region in England and Wales, except London, where the Liberal Democrats came top. The SNP was the largest party in Scotland and Sinn Féin in Northern Ireland. At the local authority level, the Brexit Party won most areas in England and Wales, and the SNP most in Scotland, with the Liberal Democrats, Labour, Plaid Cymru and the Green Party winning the remainder.
ConstituencyElected MEPs
East Midlands
Brx
Brx
Brx
LD
Lab
 
East of England
Brx
Brx
Brx
LD
LD
Grn
Con
 
London
LD
LD
LD
Lab
Lab
Brx
Brx
Grn
 
North East England
Brx
Brx
Lab
 
North West England
Brx
Brx
Brx
Lab
Lab
LD
LD
Grn
 
South East England
Brx
Brx
Brx
Brx
LD
LD
LD
Grn
Con
Lab
South West England
Brx
Brx
Brx
LD
LD
Grn
 
West Midlands
Brx
Brx
Brx
Lab
LD
Grn
Con
 
Yorkshire and the Humber
Brx
Brx
Brx
Lab
LD
Grn
 
Scotland
SNP
SNP
SNP
Brx
LD
Con
 
Wales
Brx
Brx
PC
Lab
 
Northern Ireland
SF
APNI
DUP
 

England

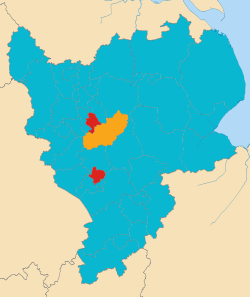
East Midlands (5 seats)

Map showing highest polling party by counting area in the East Midlands electoral region. 2019 European Parliament election in the United Kingdom area results (East Midlands).svg
Map showing highest polling party by counting area in the East Midlands electoral region.
European Election 2019: East Midlands [5]
ListCandidatesVotes%±
Brexit Party Annunziata Rees-Mogg, Jonathan Bullock, Matthew Patten
Tracy Knowles, Anna Bailey
452,321
(150,773.7)
38.23+38.23
Liberal Democrats William Newton Dunn
Michael Mullaney, Lucy Care, Suzanna Austin, Caroline Kenyon
203,98917.24+11.82
Labour Rory Palmer
Leonie Mathers, Tony Tinley, Nicole Ndiweni, Gary Godden
164,68213.92-11.01
Conservative Emma McClarkin, Rupert Matthews, Tony Harper, Brendan Clarke-Smith, Thomas Randall126,13810.66-15.33
Green Kat Boettge, Gerhard Lohmann-Bond, Liam McClelland, Daniel Wimberley, Simon Tooke124,63010.53+4.55
UKIP Alan Graves, Marietta King, Anil Bhatti, Fran Loi, John Evans58,1984.92-27.98
Change UK Kate Godfrey, Joan Laplana, Narinder Sharma, Pankajkumar Gulab, Emma Manley41,1173.47+3.47
Independent NetworkNick Byatt, Marianne Overton, Daniel Simpson, Pearl Clarke, Nikki Dillon7,6410.65
Independent Simon Rood4,5110.38
Turnout 1,183,22734.9+1.7

The East Midlands electoral region is broken down into 40 local council areas.

District [6] Turnout
BrexitLib DemLabourGreenConservativeUKIPChange UKOthers
# %# %#%#%#%#%#%#%
Amber Valley 36.5%14,24640.0 5,41915.24,34412.24,27612.04,00111.21,9115.41,1003.12760.8
Ashfield 30.5%13,94649.42,7999.93,42412.11,9887.01,6986.02,2157.81,3134.78503.0
Bassetlaw 32.5%12,97747.13,16811.54,12715.02,0077.32,3018.41,9737.27602.82360.9
Blaby 33.4%10,31241.54,11716.62,3529.52,72811.03,19212.81,1284.58503.41920.8
Bolsover 26.9%7,61248.51,5219.72,56416.31,1337.28895.71,1277.25633.63021.9
Boston 32.7%7,54456.11,0497.89336.97175.31,75713.19967.42962.21581.2
Broxtowe 39.2%11,66835.66,80220.83,92712.04,38513.42,8838.81,3074.01,5424.72440.7
Charnwood 33.3%14,94034.58,27219.15,34612.45,52212.85,58012.91,7454.01,5673.62870.7
Chesterfield 32.2%9,78339.34,59018.44,15816.72,50010.01,4355.81,3885.68113.32140.9
Corby 35.0%6,29940.21,82911.73,62023.11,1967.61,1477.38365.35943.81420.9
Daventry 41.9%10,33939.55,38220.51,5085.82,93311.23,60913.81,0494.01,1744.52060.8
Derby 31.8%18,07533.310,56219.59,88518.24,9869.24,9259.13,9507.31,5202.83950.7
Derbyshire Dales 44.9%8,66934.06,19224.31,6946.63,79114.93,16512.49363.79153.61480.6
East Lindsey 35.2%20,45453.84,20811.12,3726.22,5096.64,52011.92,5436.79382.54781.3
East Northamptonshire 38.7%10,95841.35,32820.11,7846.72,6249.93,51013.21,2354.78813.32040.8
Erewash 34.2%11,83440.34,62215.73,66612.53,04310.43,54012.11,4915.19213.12440.8
Gedling 36.5%11,78837.05,51817.34,79915.13,99812.62,8078.81,5184.81,1663.72570.8
Harborough 40.3%9,84835.66,68124.21,5505.63,32912.04,08314.89443.41,0233.71770.6
High Peak 39.0%8,94631.96,05821.63,98114.24,61616.42,3108.21,0893.99113.21640.6
Hinckley & Bosworth 34.1%12,65143.36,86923.51,7005.82,3578.13,20911.01,5065.27392.51770.6
Kettering 37.5%10,98741.14,47316.72,76910.32,78710.43,22812.11,3024.99613.62540.9
Leicester 32.6%11,46416.110,33014.533,44947.06,5039.15,2707.42,2013.11,6092.33520.5
Lincoln 32.4%7,34338.03,33917.33,00215.32,44312.61,5868.28754.55252.72021.0
Mansfield 28.8%11,10850.21,9648.93,42515.51,3135.91,6607.51,5196.97433.43851.7
Melton 36.7%5,96242.22,41217.17585.41,86013.21,81712.96604.75193.71511.1
Newark and Sherwood 36.6%13,40641.45,62617.42,8989.03,2069.94,15712.91,5714.91,1373.53451.1
North East Derbyshire 33.6%11,29342.94,01715.33,32912.72,5279.62,81010.71,3635.27823.01910.7
Northampton 36.9%19,78137.38,70416.48,24215.55,55810.55,47210.32,4994.72,3934.54380.8
North Kesteven 34.4%14,20147.04,64915.41,6085.32,3857.93,52311.71,3984.61,0383.41,3944.6
North West Leicestershire 32.7%11,01943.34,16816.42,3509.22,5209.92,87311.31,2925.19993.92180.9
Nottingham 30.8%15,79825.89,44815.418,19429.78,71414.23,6506.02,7704.52,1823.64750.8
Oadby and Wigston 33.6%4,75733.63,57625.21,83412.91,2508.81,67711.85924.24012.8820.6
Rushcliffe 45.0%10,50327.210,58027.33,2708.56,02415.65,08513.11,0562.71,8514.83150.8
Rutland 40.0%4,17636.12,89225.04874.21,49913.01,58113.73773.34243.71211.0
South Derbyshire 31.7%9,97640.53,97116.12,50910.22,3189.43,11412.61,4305.81,1124.51920.8
South Holland 32.1%11,44555.21,9499.49024.31,30613.52,80013.51,4997.25942.92571.1
South Kesteven 36.6%16,19642.56,68917.62,3336.13,7359.85,18313.61,7824.71,4743.96831.8
South Northamptonshire 42.8%10,69836.36,59522.41,5085.13,84213.04,28514.59623.31,3234.52550.9
Wellingborough 36.2%7,90139.53,06515.32,56112.81,99410.02,53612.71,0365.27213.61830.9
West Lindsey 34.7%11,41545.44,55618.11,5206.02,2088.83,27013.01,1274.57453.03081.2

Best and worst results for each party

BrexitLiberal DemocratLabourGreenConservative
Local authority%Local authority%Local authority%Local authority%Local authority%
Best1 Boston 56.1 Rushcliffe 27.3 Leicester 47.0 High Peak 16.4 Harborough 14.8
2 South Holland 55.2 Oadby and Wigston 25.2 Nottingham 29.7 Rushcliffe 15.6 South Northamptonshire 14.5
3 East Lindsey 53.8 Rutland 25.0 Corby 23.1 Derbyshire Dales 14.9 Daventry 13.8
4 Mansfield 50.2 Derbyshire Dales 24.3 Derby 18.2 Nottingham 14.2 Rutland 13.7
5 Ashfield 49.4 Harborough 24.2 Chesterfield 16.7 South Holland 13.5 South Kesteven 13.6
6 Bolsover 48.5 Hinckley & Bosworth 23.5 Bolsover 16.3 Broxtowe 13.4 South Holland 13.5
7 Bassetlaw 47.1 South Northamptonshire 22.4 Mansfield 15.5 Melton 13.2 East Northamptonshire 13.2
8 North Kesteven 47.0 High Peak 21.6 Northampton 15.5 Rutland 13.0 Boston 13.1
9 West Lindsey 45.4 Broxtowe 20.8 Lincoln 15.3 South Northamptonshire 13.0 Rushcliffe 13.1
10 Hinckley & Bosworth 43.3 Daventry 20.5 Gedling 15.1 Charnwood 12.8 West Lindsey 13.0
Worst1 Leicester 16.1 Boston 7.8 Rutland 4.2 Boston 5.3 Bolsover 5.7
2 Nottingham 25.8 Mansfield 8.9 South Holland 4.3 Mansfield 5.9 Chesterfield 5.8
3 Rushcliffe 27.2 South Holland 9.4 South Northamptonshire 5.1 East Lindsey 6.6 Ashfield 6.0
4 High Peak 31.9 Bolsover 9.7 North Kesteven 5.3 Ashfield 7.0 Nottingham 6.0
5 Derby 33.3 Ashfield 9.9 Melton 5.4 Bolsover 7.2 Corby 7.3
6 Oadby and Wigston 33.6 East Lindsey 11.1 Harborough 5.6 Bassetlaw 7.3 Leicester 7.4
7 Derbyshire Dales 34.0 Bassetlaw 11.5 Daventry 5.8 Corby 7.6 Mansfield 7.5
8 Charnwood 34.5 Corby 11.7 Hinckley & Bosworth 5.8 North Kesteven 7.9 High Peak 8.2
9 Broxtowe 35.6 Leicester 14.5 West Lindsey 6.0 Hinckley & Bosworth 8.1 Lincoln 8.2
10 Harborough 35.6 Amber Valley 15.2 South Kesteven 6.1 Oadby and Wigston 8.8 Bassetlaw 8.4
Change UKUKIP
Local authority%Local authority%
Best1 Rushcliffe 4.8 Ashfield 7.8
2 Ashfield 4.7 Boston 7.4
3 Broxtowe 4.7 Derby 7.3
4 Daventry 4.5 Bassetlaw 7.2
5 Northampton 4.5 Bolsover 7.2
6 South Derbyshire 4.5 South Holland 7.2
7 South Northamptonshire 4.5 Mansfield 6.9
8 North West Leicestershire 3.9 East Lindsey 6.7
9 South Kesteven 3.9 South Derbyshire 5.8
10 Corby 3.8 Chesterfield 5.6
Worst1 Boston 2.2 Rushcliffe 2.7
2 Leicester 2.3 Leicester 3.1
3 East Lindsey 2.5 Rutland 3.3
4 Hinckley & Bosworth 2.5 South Northamptonshire 3.3
5 Lincoln 2.7 Harborough 3.4
6 Bassetlaw 2.8 Derbyshire Dales 3.7
7 Derby 2.8 High Peak 3.9
8 Oadby and Wigston 2.8 Broxtowe 4.0
9 South Holland 2.9 Charnwood 4.0
10 North East Derbyshire 3.0 Daventry 4.0

East of England (7 seats)

Map showing highest polling party by counting area in the East of England electoral region. 2019 European Parliament election in the United Kingdom area results (East of England).svg
Map showing highest polling party by counting area in the East of England electoral region.
European election 2019: East of England [7]
ListCandidatesVotes%±
Brexit Party Richard Tice, Michael Heaver, June Mummery
Paul Hearn, Priscilla Huby, Sean Lever, Edmund Fordham
604,715
(201,571.7)
37.83
Liberal Democrats Barbara Gibson, Lucy Nethsingha
Fionna Tod, Stephen Robinson, Sandy Walkington, Marie Goldman, Jules Ewart
361,563
(180,781.5)
22.62+15.76
Green Catherine Rowett
Rupert Read, Martin Schmierer, Fiona Radic, Paul Jeater, Pallavi Devulapalli, Jeremy Caddick
202,46012.67+4.20
Conservative Geoffrey Van Orden
John Flack, Joe Rich, Thomas McLaren, Joel Charles, Wazz Mughal, Thomas Smith
163,83010.25-18.12
Labour Alex Mayer, Chris Vince, Sharon Taylor, Alvin Shum, Anna Smith, Adam Scott, Javeria Hussain139,4908.73-8.53
Change UK Emma Taylor, Neil Carmichael, Bhavna Joshi, Michelle de Vries, Amanda Gummer, Thomas Graham, Roger Casale 58,2743.65
UKIP Stuart Agnew, Paul Oakley, Elizabeth Jones, William Ashpole, Alan Graves, John Wallace, John Whitby54,6763.42-31.06
English Democrat Robin Tilbrook, Charles Vickers, Bridget Vickers, Paul Wiffen10,2170.64-0.41
Independent Attila Csordas3,2300.20
Turnout 1,598,45536.5 [8]

The East of England electoral region is broken down into 45 local council areas.

District [9] Turnout [10] BrexitLib DemLabourGreenConservativeUKIPChange UKOthers
# %# %# %# %#%#%#%#%
Babergh 39%11,35541.35,59020.31,3474.94,49416.32,7299.98733.28933.22160.8
Basildon 31%20,84350.55,53613.43,8079.23,4248.33,9759.62,0525.01,2573.03590.9
Bedford 36%13,86832.510,92425.65,30712.45,11512.04,1949.81,2542.91,6583.93650.9
Braintree 33%16,59044.76,31717.02,2116.05,05413.64,00910.81,3363.61,2033.23681.0
Breckland 35%15,62645.85,12115.02,1136.24,22012.43,97111.71,6564.91,0143.03641.1
Brentwood 30%9,48643.25,21923.81,0024.62,1159.62,58211.86683.06953.21700.8
Broadland 37%14,66239.48,73323.52,3756.44,79712.93,87410.41,3613.71,1683.12690.7
Broxbourne 32%9,89044.73,18614.42,52811.41,8378.32,88413.08433.87483.42070.9
Cambridge 48%5,06412.717,32843.54,55111.49,40823.61,4993.84821.21,3233.31510.4
Castle Point 32%12,82158.72,1239.71,2375.71,5176.92,1229.71,1945.56623.01830.8
Central Bedfordshire 36%27,10237.214,80020.35,1617.19,46213.09,23612.72,9384.03,4924.86370.9
Chelmsford 37%19,11340.413,57228.72,2374.74,5039.54,6399.81,3512.91,5553.32820.6
Colchester 35%17,03437.211,11424.33,4017.46,70714.74,1759.11,3683.01,6373.63110.7
Dacorum 39%13,42731.813,12031.13,0497.25,13412.24,65111.01,1272.71,4353.42810.7
East Cambridgeshire 38%8,05733.77,02729.41,1044.63,40814.32,52810.66672.89333.91710.7
East Hertfordshire 40%14,37434.011,09026.22,2345.36,59215.64,95311.71,0692.51,6293.93180.8
East Suffolk 40%27,74539.313,89319.74,8186.811,28916.87,75811.02,2833.22,1323.06620.9
Epping Forest 36%16,01845.06,62618.62,3176.53,69510.44,26012.01,1783.31,2473.52630.7
Fenland 31%11,48651.92,52611.41,2705.71,7678.02,90113.11,2605.76913.12361.1
Great Yarmouth 31%11,55253.02,0799.52,23610.31,7488.02,1149.71,2675.85622.62301.1
Harlow 30%7,73743.62,17212.23,03717.11,5899.01,6339.28995.15022.81650.9
Hertsmere 36%8,14530.96,06223.02,4439.32,5599.74,67317.77242.71,5756.02130.8
Huntingdonshire 38%18,49437.811,34323.22,7385.66,31312.95,69011.61,6523.42,2814.74200.9
Ipswich 34%11,36736.75,38317.45,09516.44,16413.42,6698.61,2083.98252.72690.9
King's Lynn and West Norfolk 34%17,86547.45,24813.92,5056.64,05210.74,51612.01,7694.71,3863.73791.0
Luton 28%10,02628.15,03014.112,87836.12,6597.42,4997.01,1973.41,1203.12830.8
Maldon 35%8,43647.23,13217.57454.22,06111.51,94510.96923.96993.91650.9
Mid Suffolk 39%12,41740.55,92419.31,3844.55,56518.23,32010.81,0093.38032.62340.8
North Hertfordshire 41%10,71926.812,59531.53,2618.26,14915.44,32410.89242.31,6404.13680.9
North Norfolk 39%13,40041.78,96627.91,2363.83,27910.22,8668.91,3254.17602.43201.0
Norwich 39%7,82021.38,80024.06,23917.09,52926.01,9155.29492.611973.32680.7
Peterborough 35%16,19638.36,49115.47,27217.24,56310.84,59410.91,5373.61,2773.03490.8
Rochford 36%12,39652.83,27613.91,0834.62,47810.52,2019.49854.27733.32981.3
South Cambridgeshire 48%13,17423.920,97538.12,6754.98,35115.24,6858.51,0181.83,9067.13160.6
Southend-on-Sea 33%18,03242.18,08518.94,2559.95,21412.23,8499.01,5823.71,4653.43900.9
South Norfolk 39%14,28835.39,49523.52,3055.76,54716.24,77411.81,2553.11,4213.53590.9
St Albans 47%10,59021.522,23245.02,7525.66,01012.24,5839.37171.52,2354.52390.5
Stevenage 35%7,63634.93,80317.43,89017.82,32910.72,39110.97673.58483.92020.9
Tendring 36%21,41054.35,01612.72,5236.43,4998.93,2828.32,1905.61,0862.84451.1
Three Rivers 38%8,48633.97,70730.81,6806.72,72710.92,72510.96822.79253.71300.5
Thurrock 30%17,57351.72,9098.65,08015.02,1596.42,6237.71,9475.71,0933.25871.7
Uttlesford 40%10,13737.87,64528.58903.33,46012.92,83810.65772.21,0664.01980.7
Watford 36%6,18927.27,80634.33,61715.92,1289.41,6327.25682.56823.01230.5
Welwyn Hatfield 38%9,59733.38,08028.12,8549.92,98310.43,29411.47742.71,0153.52060.7
West Suffolk 36%16,47239.77,46418.02,7486.65,80714.05,25512.71,5023.61,7604.24781.2

Best and worst results for each party

BrexitLiberal DemocratLabourGreenConservative
Local authority%Local authority%Local authority%Local authority%Local authority%
Best1 Castle Point 58.7 St Albans 45.0 Luton 36.1 Norwich 26.0 Hertsmere 17.7
2 Tendring 54.3 Cambridge 43.5 Stevenage 17.8 Cambridge 23.6 Fenland 13.1
3 Great Yarmouth 53.0 South Cambridgeshire 38.1 Peterborough 17.2 Mid Suffolk 18.2 Broxbourne 13.0
4 Rochford 52.8 Watford 34.3 Harlow 17.1 East Suffolk 16.8 Central Bedfordshire 12.7
5 Fenland 51.9 North Hertfordshire 31.5 Norwich 17.0 Babergh 16.3 West Suffolk 12.7
6 Thurrock 51.7 Dacorum 31.1 Ipswich 16.4 South Norfolk 16.2 Epping Forest 12.0
7 Basildon 50.5 Three Rivers 30.8 Watford 15.9 East Hertfordshire 15.6 King's Lynn and West Norfolk 12.0
8 King's Lynn and West Norfolk 47.4 East Cambridgeshire 29.4 Thurrock 15.0 North Hertfordshire 15.4 Brentwood 11.8
9 Maldon 47.2 Chelmsford 28.7 Bedford 12.4 South Cambridgeshire 15.2 South Norfolk 11.8
10 Breckland 45.8 Uttlesford 28.5 Broxbourne 11.4 Colchester 14.7 Breckland 11.7
Worst1 Cambridge 12.7 Thurrock 8.6 Uttlesford 3.3 Thurrock 5.3 Cambridge 3.8
2 Norwich 21.3 Great Yarmouth 9.5 North Norfolk 3.8 Castle Point 6.9 Norwich 5.2
3 St Albans 21.5 Castle Point 9.7 Maldon 4.2 Luton 7.4 Luton 7.0
4 South Cambridgeshire 23.9 Fenland 11.4 Mid Suffolk 4.5 Fenland 8.0 Watford 7.2
5 North Hertfordshire 26.8 Harlow 12.2 Brentwood 4.6 Great Yarmouth 8.0 Thurrock 7.7
6 Watford 27.2 Tendring 12.7 East Cambridgeshire 4.6 Basildon 8.3 Tendring 8.3
7 Luton 28.1 Basildon 13.4 Rochford 4.6 Broxbourne 8.3 South Cambridgeshire 8.5
8 Hertsmere 30.9 King's Lynn and West Norfolk 13.9 Chelmsford 4.7 Tendring 8.9 Ipswich 8.6
9 Dacorum 31.8 Rochford 13.9 Babergh 4.9 Harlow 9.0 North Norfolk 8.9
10 Bedford 32.5 Luton 14.1 South Cambridgeshire 4.9 Watford 9.4 Southend-on-Sea 9.0
Change UKUKIP
Local authority%Local authority%
Best1 South Cambridgeshire 7.1 Great Yarmouth 5.8
2 Hertsmere 6.0 Fenland 5.7
3 Central Bedfordshire 4.8 Thurrock 5.7
4 Huntingdonshire 4.7 Tendring 5.6
5 St Albans 4.5 Castle Point 5.5
6 West Suffolk 4.2 Harlow 5.1
7 North Hertfordshire 4.1 Basildon 5.0
8 Uttlesford 4.0 Breckland 4.9
9 Bedford 3.9 King's Lynn and West Norfolk 4.7
10 East Cambridgeshire 3.9 Rochford 4.2
Worst1 North Norfolk 2.4 Cambridge 1.2
2 Great Yarmouth 2.6 St Albans 1.5
3 Mid Suffolk 2.6 South Cambridgeshire 1.8
4 Ipswich 2.7 Uttlesford 2.2
5 Harlow 2.8 North Hertfordshire 2.3
6 Tendring 2.8 East Hertfordshire 2.5
7 Basildon 3.0 Watford 2.5
8 Breckland 3.0 Norwich 2.6
9 Castle Point 3.0 Dacorum 2.7
10 East Suffolk 3.0 Hertsmere 2.7

London (8 seats)

Map showing highest polling party by counting area in the Greater London electoral region. 2019 European Parliament election in the United Kingdom area results (Greater London).svg
Map showing highest polling party by counting area in the Greater London electoral region.
European election 2019: London [11]
ListCandidatesVotes%±
Liberal Democrats Irina Von Wiese, Dinesh Dhamija, Luisa Manon Porritt
Jonathan Fryer, Hussain Khan, Helen Cross, Graham Colley, Rabina Khan
608,725
(202,908.3)
27.2+20.5
Labour Claude Moraes, Seb Dance
Katy Clark, Laura Parker, Murad Qureshi, Taranjit Kaur Chana, James Beckles, Sanchia Alasia
536,810
(268,405)
23.9-12.8
Brexit Party Benyamin Habib, Lance Graham Forman
Graham Shore, Alka Cuthbert, Jimi Ogunnusi, Simon Marcus, Mehrtash A'zami, Aileen Quinton
400,257
(200,128.5)
17.9
Green Scott Ainslie
Gulnar Hasnain, Shahrar Ali, Rachel Collinson, Eleanor Margolies, Remco van der Stoep, Kirsten De Keyser, Peter Underwood
278,95712.5+3.6
Conservative Syed Kamall, Charles Tannock, Joy Morrissey, Tim Barnes, Scott Pattenden, Attic Rahman, Kirsty Finlayson, Luke Parker177,9647.8-14.6
Change UK Gavin Esler, Jacek Rostowski, Carole Tongue, Annabel Mullin, Karen Newman, Nora Mulready, Jessica Simor, Haseeb Ur-Rehman117,6355.25
UKIP Gerard Batten, Richard Braine, Peter Muswell, Freddy Vachha, Robert Stephenson, Peter McIlvenna, John Poynton, Ronie Johnson46,4972.1-14.8
Animal Welfare Vanessa Hudson, Jane Smith, Sam Morland, Ranjan Joshi, Mina Da Rui, Jonathan Homan, Simon Gouldman25,2321.13+0.17
Women's Equality Catherine Mayer, Bea Gare, Nanci Hogan, Aliyah Dunbar-Hussain, Hannah Barham-Brown, Alison Marshall, Olivia Vincenti, Leyla Mohan23,7661.06
UKEU Pierre Kirk, Richard Stevens, Saleyha Ahsan, Anna Novikova, Angela Antetomaso, Richard Boardman18,8060.84
Independent Claudia Mcdowell1,0360.05
Independent Daze Aghaji1,0180.05
Independent Roger Hallam 9240.04
Independent Kofi Klu8690.04
Independent Andrea Venzon7310.03
Independent Mike Shad7070.03
Independent Zoe Lafferty4360.02
Independent Andrew Medhurst4300.02
Independent Alan Kirkby4010.02
Independent Ian Sowden2540.01
Independent Henry Muss2260.01
Turnout 2,241,68141.3% [12]

The Greater London electoral region is broken down into the 33 London Borough areas.

BoroughTurnout [13] BrexitLib DemLabourGreenConservativeUKIPChange UKOthers
 %# %# %# %# %#%#%#%#%
Barking and Dagenham [14] 31.6%11,01429.03,1058.215,44940.71,9665.21,9785.21,8995.09282.41,5904.4
Barnet [15] [16] 42.5%17,08917.727,42328.415,98016.69,76110.113,86814.41,6241.77,4917.83,3133.4
Bexley [17] 37.7%26,36941.49,19814.48,48913.35,0257.97,07611.13,0024.72,3523.72,2083.5
Brent [18] [19] 35.5%8,01411.516,14123.125,56536.66,3989.27,03710.11,3374.12,8594.12,5433.6
Bromley [20] 43.2%31,29231.126,91226.88,6298.611,83511.811,05111.02,5852.65,0315.03,1323.1
Camden [21] [22] 44.8%6,35010.521,63535.913,56422.59,58215.92,9915.06651.13,9326.51,5542.6
City of London [23] 54.0%50415.71,29840.534810.946414.51966.1381.22537.91003.1
Croydon [24] 38.4%20,72821.621,28922.222,37523.310,62911.110,13910.62,4802.64,6364.83,8014.0
Ealing [25] 45.5%12,85813.025,87626.131,88132.110,51910.67,4167.51,7441.84,9615.03,9284.0
Enfield [26] 38.4%14,65019.415,71620.822,84330.37,76410.36,5018.61,7852.43,4874.62,6453.5
Greenwich [27] 40.1%14,37420.416,76923.817,60225.09,04512.93,9235.61,9172.73,9725.62,7573.9
Hackney [28] 41.7%4,0976.015,96623.523,82535.015,70323.12,1093.16861.03,6695.41,9722.9
Hammersmith and Fulham [29] 45.1%7,12314.117,34434.39,90619.65,83911.54,5589.07841.53,2976.51,7553.5
Haringey [30] 46.5%5,4877.522,86531.422,15830.413,43318.42,3073.27261.03,8635.32,0132.8
Harrow [31] 38.8%12,00418.514,11621.816,31225.25,1878.09,81415.11,3882.13,1284.82,9024.5
Havering [32] 37.2%32,16547.68,25812.27,55011.24,7627.06,6799.93,6755.42,0873.12,4273.6
Hillingdon [33] [34] 37.6%19,12327.012,37217.416,78823.75,9498.48,81212.42,3573.32,7873.92,7133.8
Hounslow [35] 38.8%11,98118.315,09523.119,75930.25,8629.05,6448.61,6642.52,9654.52,4923.8
Islington [36] 47.7%6,5089.819,89029.819,01728.513,04719.61,6322.49131.43,7715.71,8692.8
Kensington and Chelsea [37] 41.0%5,77717.212,07136.04,66213.93,0149.04,45413.34441.32,2316.69142.7
Kingston upon Thames [38] 48.1%10,19719.225,00647.24,0057.64,8929.24,1767.91,0352.02,1654.11,5512.9
Lambeth [39] 42.0%7,3298.428,33632.619,50222.417,91620.63,3883.97670.97,0768.12,5743.0
Lewisham [40] 42.2%9,11711.921,58128.119,96526.015,44420.12,6413.41,0991.44,5145.92,5643.3
Merton [41] 44.5%10,13216.520,02132.712,73520.86,78411.14,8087.81,1561.93,5705.82,0673.4
Newham [42] 36.2%7,73011.89,19214.133,37951.05,3538.23,7565.71,3362.02,2343.42,4413.7
Redbridge [43] 37.8%13,62119.213,65519.323,61533.35,9598.46,9309.81,5452.23,0404.32,4733.5
Richmond upon Thames [44] 53.8%11,69916.138,00052.33,4044.77,80210.75,7277.98721.23,4034.71,6842.3
Southwark [45] 41.3%9,07210.927,12832.520,56924.715,28618.32,8533.41,1581.44,9085.92,3762.9
Sutton [46] 39.3%17,30730.418,70632.85,5639.84,6638.24,8638.51,8453.22,0623.61,9353.4
Tower Hamlets [47] 39.5%6,82310.116,88325.025,60237.99,43214.02,5253.71,0111.53,3505.01,8562.8
Waltham Forest [48] 41.3%10,40715.315,06122.121,09031.011,35616.73,5195.21,2331.83,2224.72,1403.1
Wandsworth [49] 47.0%12,15912.436,01236.715,48715.813,69613.99,3959.61,0571.17,2817.43,1003.2
Westminster [50] [51] 40.6%7,15715.215,80533.59,19219.54,5909.75,19811.06701.43,1106.61,4553.1

Best and worst results for each party

BrexitLiberal DemocratLabourGreenConservative
Local authority%Local authority%Local authority%Local authority%Local authority%
Best1 Havering 47.6 Richmond upon Thames 52.3 Newham 51.0 Hackney 23.1 Harrow 15.1
2 Bexley 41.4 Kingston upon Thames 47.2 Barking and Dagenham 40.7 Lambeth 20.6 Barnet 14.4
3 Bromley 31.1 City of London 40.5 Tower Hamlets 37.9 Lewisham 20.1 Kensington and Chelsea 13.3
4 Sutton 30.4 Wandsworth 36.7 Brent 36.6 Islington 19.6 Hillingdon 12.4
5 Barking and Dagenham 29.0 Kensington and Chelsea 36.0 Hackney 35.0 Haringey 18.4 Bexley 11.1
6 Hillingdon 27.0 Camden 35.9 Redbridge 33.3 Southwark 18.3 Bromley 11.0
7 Croydon 21.6 Hammersmith and Fulham 34.3 Ealing 32.1 Waltham Forest 16.7 Westminster 11.0
8 Greenwich 20.4 Westminster 33.5 Waltham Forest 31.0 Camden 15.9 Croydon 10.6
9 Enfield 19.4 Sutton 32.8 Haringey 30.4 City of London 14.5 Brent 10.1
10 Kingston upon Thames 19.2 Merton 32.7 Enfield 30.3 Tower Hamlets 14.0 Havering 9.9
Worst1 Hackney 6.0 Barking and Dagenham 8.2 Richmond upon Thames 4.7 Barking and Dagenham 5.3 Islington 2.4
2 Haringey 7.5 Havering 12.2 Kingston upon Thames 7.6 Havering 7.0 Hackney 3.1
3 Lambeth 8.4 Newham 14.1 Bromley 8.6 Bexley 7.9 Haringey 3.2
4 Islington 9.8 Bexley 14.4 Sutton 9.8 Harrow 8.0 Lewisham 3.4
5 Tower Hamlets 10.1 Hillingdon 17.4 City of London 10.9 Newham 8.2 Southwark 3.4
6 Camden 10.5 Redbridge 19.3 Havering 11.2 Sutton 8.2 Tower Hamlets 3.7
7 Southwark 10.9 Enfield 20.8 Bexley 13.3 Hillingdon 8.4 Lambeth 3.9
8 Brent 11.5 Harrow 21.8 Kensington and Chelsea 13.9 Redbridge 8.4 Camden 5.0
9 Newham 11.8 Waltham Forest 22.1 Wandsworth 15.8 Hounslow 9.0 Barking and Dagenham 5.2
10 Lewisham 11.9 Croydon 22.2 Barnet 16.6 Kensington and Chelsea 9.0 Waltham Forest 5.2
Change UKUKIP
Local authority%Local authority%
Best1 Lambeth 8.1 Havering 5.4
2 City of London 7.9 Barking and Dagenham 5.0
3 Barnet 7.8 Bexley 4.7
4 Wandsworth 7.4 Brent 4.1
5 Kensington and Chelsea 6.6 Hillingdon 3.3
6 Westminster 6.6 Sutton 3.2
7 Camden 6.5 Greenwich 2.7
8 Hammersmith and Fulham 6.5 Bromley 2.6
9 Lewisham 5.9 Croydon 2.6
10 Southwark 5.9 Hounslow 2.5
Worst1 Barking and Dagenham 2.4 Lambeth 0.9
2 Havering 3.1 Hackney 1.0
3 Newham 3.4 Haringey 1.0
4 Sutton 3.6 Camden 1.1
5 Bexley 3.7 Wandsworth 1.1
6 Hillingdon 3.9 City of London 1.2
7 Brent 4.1 Richmond upon Thames 1.2
8 Kingston upon Thames 4.1 Kensington and Chelsea 1.3
9 Redbridge 4.3 Islington 1.4
10 Hounslow 4.5 Lewisham 1.4

North East England (3 seats)

Map showing highest polling party by counting area in the North East England electoral region. 2019 European Parliament election in the United Kingdom area results (North East England).svg
Map showing highest polling party by counting area in the North East England electoral region.
European Election 2019: North East England [11]
ListCandidatesVotes%±
Brexit Party Brian Monteith , John Tennant
Richard Monaghan
240,056
(120,028)
38.7+38.7
Labour Jude Kirton-Darling
Paul Brannen, Clare Penny-Evans
119,93119.4-17.1
Liberal Democrats Fiona Hall, Julie Pörksen, Aidan King104,33016.8+10.9
Green Rachel Featherstone, Jonathan Elmer, Dawn Furness49,9058.1+2.9
Conservative Richard Lawrie, Chris Galley, Duncan Crute42,3956.8-10.9
UKIP Richard Elvin, Christopher Gallacher, Alan Breeze38,2696.2-23.0
Change UK Frances Weetman, Penny Hawley, Kathryn Heywood24,9684.0+4.0
Turnout 623,47832.7

The North East England electoral region is broken down into 12 local council areas.

DistrictVoter turnout,
of eligible [52]
BrexitLib DemLabourGreenConservativeUKIPChange UKOthers
# %# %# %# %#%#%#%#%
Darlington 31.7%9,72840.24,12817.03,43014.22,3409.72,59910.71,1224.68713.6N/AN/A
County Durham 32.9%49,68739.520,96316.724,23219.310,2018.17,7526.27,8396.25,1644.1N/AN/A
Gateshead 34.1%17,83736.98,54617.711,31123.43,8958.12,3234.82,8315.91,6193.3N/AN/A
Hartlepool 25.5%9,44652.71,7299.72,46513.89805.59105.11,5868.97934.4N/AN/A
Middlesbrough 25.6%10,73844.82,76211.55,00320.91,3265.51,2425.21,5086.31,4095.9N/AN/A
Newcastle upon Tyne 38.8%18,32827.216,14923.916,58224.66,6299.83,6335.43,3955.02,7464.1N/AN/A
North Tyneside 34.9%17,94433.89,79818.511,69622.04,5468.64,0307.62,8655.42,2204.2N/AN/A
Northumberland 34.0%31,41538.118,39022.311,76314.36,2187.57,5199.13,8104.63,2974.0N/AN/A
Redcar and Cleveland 29.7%14,86548.74,18513.74,20713.81,7705.82,0306.72,2427.41,2043.9N/AN/A
South Tyneside 31.9%14,86440.93,73410.38,14022.43,90510.71,8425.12,4106.61,4654.0N/AN/A
Stockton-on-Tees 31.8%19,28643.36,29314.17,47716.82,8436.44,1139.22,7366.11,7954.0N/AN/A
Sunderland 31.7%25,91839.87,65311.713,62520.95,2528.14,4026.85,9259.12,3853.7N/AN/A

Full results for each party

BrexitLiberal DemocratLabourGreenConservative
Local authority%Local authority%Local authority%Local authority%Local authority%
1 Hartlepool 52.7 Newcastle upon Tyne 23.9 Newcastle upon Tyne 24.6 South Tyneside 10.7 Darlington 10.7
2 Redcar and Cleveland 48.7 Northumberland 22.3 Gateshead 23.4 Newcastle upon Tyne 9.8 Stockton-on-Tees 9.2
3 Middlesbrough 44.8 North Tyneside 18.5 South Tyneside 22.4 Darlington 9.7 Northumberland 9.1
4 Stockton-on-Tees 43.3 Gateshead 17.7 North Tyneside 22.0 North Tyneside 8.6 North Tyneside 7.6
5 South Tyneside 40.9 Darlington 17.0 Middlesbrough 20.9 County Durham 8.1 Sunderland 6.8
6 Darlington 40.2 County Durham 16.7 Sunderland 20.9 Gateshead 8.1 Redcar and Cleveland 6.7
7 Sunderland 39.8 Stockton-on-Tees 14.1 County Durham 19.3 Sunderland 8.1 County Durham 6.2
8 County Durham 39.5 Redcar and Cleveland 13.7 Stockton-on-Tees 16.8 Northumberland 7.5 Newcastle upon Tyne 5.4
9 Northumberland 38.1 Sunderland 11.7 Northumberland 14.3 Stockton-on-Tees 6.4 Middlesbrough 5.2
10 Gateshead 36.9 Middlesbrough 11.5 Darlington 14.2 Redcar and Cleveland 5.8 Hartlepool 5.1
11 North Tyneside 33.8 South Tyneside 10.3 Hartlepool 13.8 Hartlepool 5.5 South Tyneside 5.1
12 Newcastle upon Tyne 27.2 Hartlepool 9.7 Redcar and Cleveland 13.8 Middlesbrough 5.5 Gateshead 4.8
Change UKUKIP
Local authority%Local authority%
1 Middlesbrough 5.9 Sunderland 9.1
2 Hartlepool 4.4 Hartlepool 8.9
3 North Tyneside 4.2 Redcar and Cleveland 7.4
4 County Durham 4.1 South Tyneside 6.6
5 Newcastle upon Tyne 4.1 Middlesbrough 6.3
6 Northumberland 4.0 County Durham 6.2
7 South Tyneside 4.0 Stockton-on-Tees 6.1
8 Stockton-on-Tees 4.0 Gateshead 5.9
9 Redcar and Cleveland 3.9 North Tyneside 5.4
10 Sunderland 3.7 Newcastle upon Tyne 5.0
11 Darlington 3.6 Darlington 4.6
12 Gateshead 3.3 Northumberland 4.6

North West England (8 seats)

Map showing highest polling party by counting area in the North West England electoral region. 2019 European Parliament election in the United Kingdom area results (North West England).svg
Map showing highest polling party by counting area in the North West England electoral region.
European Election 2019: North West England [53]
ListCandidatesVotes%±
Brexit Party Claire Fox, Henrik Nielsen, David Bull
Gary Harvey, Ajay Jagota, Elizabeth Babade, Sally Bate, John Banks
541,843
(180,614.3)
31.23N/A
Labour Theresa Griffin, Julie Ward
Wajid Khan, Erica Lewis, David Brennan, Claire Cozler, Saf Ismail, Yvonne Tennant
380,193
(190,096.5)
21.91-11.94
Liberal Democrats Chris Davies, Jane Brophy
Helen Foster-Grime, Anna Fryer, Sam Al-Hamdani, Rebecca Forrest, John Studholme, Frederick Van Mierlo
297,507
(148,753.5)
17.15+11.14
Green Gina Dowding
Wendy Kay Olsen, Jessica Northey, Geraldine Coggins, Rosie Mills, Astrid Johnson, Daniel Jerrome, James Booth
216,58112.48+5.47
Conservative Sajjad Karim, Kevin Beaty, Jane Howard, Arnold Saunders, Wendy Maisey, Thomas Lord, Anthony Pickles, Attika Choudhary131,0027.55-12.51
UKIP Adam Richardson, Jeff Armstrong, Fiona Mills, Nathan Ryding, Michael Felse, Ben Fryer, John Booker, Alexander Craig62,4643.60-23.86
Change UK Andrea Cooper, Dan Price, Arun Banerji, Michael Taylor, Philippa Olive, Victoria Desmond, Andrew Graystone, Elisabeth Knight47,2372.72N/A
Independent Tommy Robinson 38,9082.24N/A
English Democrat Stephen Morris, Valerie Morris10,0450.58-0.53
UKEU Sophie Larroque7,1250.41N/A
Independent Mohammad Aslam2,0020.12N/A
Turnout 1,734,90733.1

The North West England electoral region is broken down into 39 local council areas.

District [54] Voter turnout,
of eligible
BrexitLib DemLabourGreenConservativeUKIPChange UKOthers
# %# %# %# %#%#%#%#%
Allerdale 33.78%9,59938.54,22917.03,20512.92,76611.12,3639.59914.09693.97893.2
Barrow-in-Furness 26.49%5,57340.41,65612.02,48218.01,2058.71,2338.96915.03492.56214.5
Blackburn with Darwen 36.69%9,48825.93,1898.716,18044.12,2836.22,3306.41,1493.15691.61,4604.0
Blackpool 30.17%13,14543.52,7169.05,16617.12,4728.23,03510.11,5215.07342.41,4044.7
Bolton 34.38%23,12234.68,41512.617,45526.15,0617.65,5778.32,9574.41,5322.32,6864.0
Burnley 33.13%8,28239.42,0469.75,39625.61,7258.29834.75212.53431.61,7458.3
Bury 35.16%15,39031.47,93616.210,41921.25,55811.34,7229.61,7043.51,5633.21,7543.6
Carlisle 33.85%10,70139.14,19615.33,17511.63,12811.43,17911.61,2134.47412.71,0703.9
Cheshire East 36.14%36,70134.224,63323.09,8079.114,23013.312,14211.33,3733.13,9443.72,3712.2
Cheshire West and Chester 34.94%30,20332.720,21021.812,41513.412,86013.99,1539.92,7773.02,8643.12,0202.2
Chorley 36.09%11,58237.44,65115.05,01316.23,44811.13,31010.71,0863.51,0133.38532.8
Copeland 31.07%6,50540.02,13613.12,81917.31,1507.01,76710.87304.55673.56413.9
Eden 38.66%5,68435.33,70623.08805.52,59616.12,00212.44742.94002.53662.3
Fylde 37.00%9,40141.83,78616.81,5947.12,52211.22,94513.17743.48283.76512.9
Halton 27.12%8,77635.03,29013.16,66126.52,63910.51,0934.41,0984.46372.59093.6
Hyndburn 31.41%7,38639.11,5288.14,81725.51,4177.51,5208.01,0195.43631.98534.5
Knowsley 23.57%6,97525.72,4018.910,84740.03,70813.75201.98363.16732.51,1504.2
Lancaster 35.96%11,67930.87,50719.84,95613.17,74920.52,9057.71,2303.29762.68872.3
Liverpool 29.96%17,35118.415,77616.738,04840.314,48115.31,9222.02,1032.22,2632.42,5062.6
Manchester 31.67%15,06913.921,04119.540,19137.219,96618.53,4233.22,6262.42,3812.23,4283.2
Oldham 32.63%15,79130.46,14411.817,51233.84,0417.82,5504.92,4004.69981.92,4424.7
Pendle 34.45%7,60934.42,32510.55,76526.11,6297.42,78612.68964.13531.67423.4
Preston 35.15%8,90227.25,30516.210,23031.22,9409.02,4407.51,1433.56682.01,1103.4
Ribble Valley 36.90%6,75939.73,39819.91,0966.42,17412.82,21413.05483.24502.63982.3
Rochdale 30.44%15,46832.35,47811.414,33630.03,9028.22,7495.72,4555.18951.92,5665.4
Rossendale 34.72%6,58537.32,31713.12,87616.32,19612.41,6959.67614.34902.87424.2
Salford 30.09%14,86729.87,11014.311,37622.86,68913.43,4016.82,2864.61,4362.92,6425.3
Sefton 31.19%19,84829.812,43818.717,58126.47,71711.63,6095.42,0063.01,7622.61,5712.4
South Lakeland 45.04%10,93830.212,90135.61,7744.94,95513.73,5439.89362.66611.85181.4
South Ribble 35.61%11,78939.84,89916.64,02513.62,9229.93,09610.51,1503.98632.98402.8
St. Helens 28.59%13,76335.35,01512.78,44321.75,53014.21,8054.61,5484.01,1893.11,6704.3
Stockport 36.46%22,46228.323,13529.110,73813.510,70513.55,4516.92,3733.02,5993.31,9042.4
Tameside 28.42%17,16435.74,91410.211,29123.55,89512.32,8485.92,4685.11,2462.62,1924.6
Trafford 40.40%15,09822.515,62023.313,64420.311,40217.06,1239.11,7372.62,1223.21,4102.1
Warrington 35.57%17,83031.911,47220.59,53417.16,62911.94,6348.32,1113.81,8343.31,8123.2
West Lancashire 34.79%10,18835.14,42715.25,48018.93,56912.32,6309.01,0773.78893.18062.8
Wigan 27.92%26,92141.07,19311.013,05719.96,1909.43,3875.23,5355.42,0263.13,3595.1
Wirral 34.29%23,92829.214,62217.816,90720.613,55516.56,1257.52,4853.02,2642.82,1702.6
Wyre 34.73%13,32143.93,74612.43,0029.92,9779.83,79212.51,6765.57832.61,0223.4

Best and worst results for each party

BrexitLiberal DemocratLabourGreenConservative
Local authority%Local authority%Local authority%Local authority%Local authority%
Best1 Wyre 43.9 South Lakeland 35.6 Blackburn with Darwen 44.1 Lancaster 20.5 Fylde 13.1
2 Blackpool 43.5 Stockport 29.1 Liverpool 40.3 Manchester 18.5 Ribble Valley 13.0
3 Fylde 41.8 Trafford 23.3 Knowsley 40.0 Trafford 17.0 Pendle 12.6
4 Wigan 41.0 Cheshire East 23.0 Manchester 37.2 Wirral 16.5 Wyre 12.5
5 Barrow-in-Furness 40.4 Eden 23.0 Oldham 33.8 Eden 16.1 Eden 12.4
6 Copeland 40.0 Cheshire West and Chester 21.8 Preston 31.2 Liverpool 15.3 Carlisle 11.6
7 South Ribble 39.8 Warrington 20.5 Rochdale 30.0 St. Helens 14.2 Cheshire East 11.3
8 Ribble Valley 39.7 Ribble Valley 19.9 Halton 26.5 Cheshire West and Chester 13.9 Copeland 10.8
9 Burnley 39.4 Lancaster 19.8 Sefton 26.4 Knowsley 13.7 Chorley 10.7
10 Carlisle 39.1 Manchester 19.5 Bolton 26.1 South Lakeland 13.7 South Ribble 10.5
Worst1 Manchester 13.9 Hyndburn 8.1 South Lakeland 4.9 Blackburn with Darwen 6.2 Knowsley 1.9
2 Liverpool 18.4 Blackburn with Darwen 8.7 Eden 5.5 Copeland 7.0 Liverpool 2.0
3 Trafford 22.5 Knowsley 8.9 Ribble Valley 6.4 Pendle 7.4 Manchester 3.2
4 Knowsley 25.7 Blackpool 9.0 Fylde 7.1 Hyndburn 7.5 Halton 4.4
5 Blackburn with Darwen 25.9 Burnley 9.7 Cheshire East 9.1 Bolton 7.6 St. Helens 4.6
6 Preston 27.2 Tameside 10.2 Wyre 9.9 Oldham 7.8 Burnley 4.7
7 Stockport 28.3 Pendle 10.5 Carlisle 11.6 Blackpool 8.2 Oldham 4.9
8 Wirral 29.2 Wigan 11.0 Allerdale 12.9 Burnley 8.2 Wigan 5.2
9 Salford 29.8 Rochdale 11.4 Lancaster 13.1 Rochdale 8.2 Sefton 5.4
10 Sefton 29.8 Oldham 11.8 Cheshire West and Chester 13.4 Barrow-in-Furness 8.7 Rochdale 5.7
Change UKUKIP
Local authority%Local authority%
Best1 Allerdale 3.9 Wyre 5.5
2 Cheshire East 3.7 Hyndburn 5.4
3 Fylde 3.7 Wigan 5.4
4 Copeland 3.5 Rochdale 5.1
5 Chorley 3.3 Tameside 5.1
6 Stockport 3.3 Barrow-in-Furness 5.0
7 Warrington 3.3 Blackpool 5.0
8 Bury 3.2 Oldham 4.6
9 Trafford 3.2 Salford 4.6
10 Cheshire West and Chester 3.1 Copeland 4.5
Worst1 Blackburn with Darwen 1.6 Liverpool 2.2
2 Burnley 1.6 Manchester 2.4
3 Pendle 1.6 Burnley 2.5
4 South Lakeland 1.8 South Lakeland 2.6
5 Hyndburn 1.9 Trafford 2.6
6 Oldham 1.9 Eden 2.9
7 Rochdale 1.9 Cheshire West and Chester 3.0
8 Preston 2.0 Sefton 3.0
9 Manchester 2.2 Stockport 3.0
10 Bolton 2.3 Wirral 3.0

South East England (10 seats)

Map showing highest polling party by counting area in the South East England electoral region. 2019 European Parliament election in the United Kingdom area results (South East England).svg
Map showing highest polling party by counting area in the South East England electoral region.
European Election 2019: South East England [55] [56]
ListCandidatesVotes%±
Brexit Party Nigel Farage, Alexandra Lesley Phillips, Robert Andrew Rowland, Belinda Claire De Camborne Lucy
James Gilbert Bartholomew, Christopher Graham Ellis, John Kennedy, Matthew Peter Taylor, George Thomas Stahel Farmer, Peter David Wiltshire
915,686
(228,921.5)
36.07
Liberal Democrats Catherine Bearder, Antony James Hook, Judith Bunting
Martin Paul Niebuhr Tod, Elizabeth Pendrill Raphael Leffman, Christopher Alan Bowers, Giles Damian Goodall, Ruvi Ziegler, Nicholas David Stanford Perry, John William Vincent
653,743
(217,914.3)
25.75+17.8
Green Alexandra Phillips
Elise Danielle Benjamin, Vix Lowthion, Leslie Christine Groves Williams, Phelim Mac Cafferty, Jan Hendrik Jamison Doerfel, Larry Sanders, Isabella Lina Marie Moir, Oliver Sykes, Jonathan Christopher St.Aubyn Essex
343,24913.52+4.4
Conservative Daniel Hannan
Nirj Deva, Richard McDonald Robinson, Mike Whiting, Juliette Katherine Christie Ash, Anna Firth, Adrian Pepper, Clarence Mitchell, Neva Sadikoglu-Novaky, Caroline Anne Newton
260,27710.25-20.7
Labour John Howarth
Cathy Shutt, Arran Richard Neathey, Emma Christina Turnbull, Rohit K. Dasgupta, Amy Lauren Fowler, Duncan Shaw Thomas Enright, Lubna Aiysha Arshad, Simon Guy Burgess, Rachael Eowyn Ward
184,6787.27-7.4
Change UK Richard Ashworth, Victoria Groulef, Warren Morgan, Eleanor Mary Fuller, Robin John Bextor, Nicholas Mazzei, Suzana Carp, Phil Murphy, Heather Marion Allen, Diane Helen Yeo105,8324.17
UKIP Piers Wauchope, Elizabeth Fletcher Philips, Daryll James Pitcher, Martin Toby Brothers, Tony Gould, Clive Keith Egan, Troy De Leon, Alan Harvey Stone, Judy Moore, Patricia Ann Mountain 56,4872.22-29.9
UKEU Pacelli Ndikumana, Clinton Powe7,6450.30
Independent Jason Guy Spencer McMahon3,6500.14
Socialist (GB) Mandy Bruce, Raymond Dennis Carr, David Stanley Chesham, Robert Alexander Cox, Michael Foster, Stephen Harper, Neil Kirk, Anton Charles Pruden, Andrew Brian Thomas-Emans, Darren James Williams3,5050.14
Independent David Victor Round2,6060.10
Independent Michael Jeffrey Turberville1,5870.06
Turnout 2,552,59339.2

The South East England electoral region is broken down into 67 local council areas.

DistrictTurnoutBrexitLib DemLabourGreenConservativeUKIPChange UKOthers
# %# %# %# %#%#%#%#%
Adur [57] 39.6%6,93136.28%3,74419.6%1,7419.11%3,30617.3%1,93110.11%4732.48%8354.37%1440.75%
Arun [58] 37.49%21,82748.68%8,71319.43%2,0354.54%4,73610.56%4,3579.72%1,3873.09%1,4413.21%3450.77%
Ashford [59] 37.60%15,74145.54%6,55818.97%2,1446.2%4,20012.15%3,4369.94%8422.44%1,4004.05%2410.7%
Aylesbury Vale [60] 41.6%19,53033.65%15,39526.52%4,0647%8,12213.99%6,39811.02%1,2662.18%2,7744.78%4940.85%
Basingstoke and Deane [61] 37.45%17,29535.61%12,33625.4%3,3556.91%5,69311.72%6,05312.46%1,1612.39%2,1314.39%5421.12%
Bracknell Forest [62] 35%10,94737.25%6,98323.76%2,1457.3%3,34611.39%3,73312.7%7062.4%1,2854.37%2420.82%
Brighton & Hove [63] 46.83%15,91417.35%20,33722.17%11,87512.95%32,59435.53%4,7395.17%9441.03%4,4784.88%5300.58%
Canterbury [64] 42.2%16,69537%11,67425.87%3,8358.5%6,42214.23%3,5577.88%8901.97%1,8074%2470.55%
Cherwell [65] 40.15%13,92333.5%11,19326.93%3,1297.53%5,52413.29%4,55710.96%9882.38%1,9184.61%3320.8%
Chichester [66] 41.2%13,89737.41%10,14427.31%1,1473.09%5,18713.96%4,32011.63%7822.11%1,4273.84%2440.66%
Chiltern [67] 48.2%10,31930.03%10,94231.85%1,4964.35%4,59713.38%4,38112.75%4961.44%1,8815.47%2410.70%
Crawley [68] 34.11%9,49337.69%4,12816.39%4,72818.77%2,3679.4%2,72110.8%6282.49%8873.52%2340.93%
Dartford [69] 33.6%11,59246.23%3,40313.57%3,24712.95%2,1438.55%2,67810.68%8703.47%9443.76%1980.79%
Dover [70] 38.62%15,75046.98%5,62916.79%3,0789.18%3,82111.4%3,0419.07%7722.3%1,1673.48%2650.79%
Eastbourne [71] 38.7%11,73641.82%7,47426.63%1,5295.45%3,16811.29%2,5238.99%6582.34%7752.76%2030.72%
Eastleigh [72]  %13,92238.82%11,06030.84%1,5724.38%3,82010.65%3,0248.43%9042.52%1,3083.65%2520.7%
East Hampshire [73] 43.4%14,33036.14%11,39728.74%1,2043.04%5,22613.18%4,88112.31%7411.87%1,5833.99%2930.74%
Elmbridge [74] 44.3%11,64827.58%16,41038.86%1,5533.68%4,36510.34%5,13012.15%5341.26%2,2515.33%3390.8%
Epsom and Ewell [75] 41.2%7,56432.74%7,48132.38%1,3986.05%2,61111.3%2,1299.21%3721.61%1,3705.93%1800.78%
Fareham [76]  %15,90043.29%8,45423.02%1,4423.93%4,11411.2%4,23811.54%9002.45%1,3663.72%3140.85%
Folkestone & Hythe [77] 38.62%15,67448.35%5,04515.56%1,9335.96%4,99415.41%2,5897.99%9022.78%1,0313.18%2490.77%
Gosport [78] 35%10,66650.44%3,24015.32%1,2365.84%2,17110.27%2,24710.63%7423.51%6673.15%1790.85%
Gravesham [79] 35.1%11,49145.4%3,22812.75%3,88115.33%2,2348.83%2,5129.92%9133.61%8293.28%2240.88%
Guildford [80] 44.21%12,42129%15,41235.98%1,7484.08%5,58113.03%4,53710.59%5631.31%2,2245.19%3510.82%
Hart [81] 40.0%10,03234.94%8,85330.83%8112.82%3,23511.27%3,56412.41%5151.79%1,4745.13%2290.8%
Hastings [82]  %8,97736.68%4,41518.04%3,46214.15%4,48018.31%1,6536.75%5872.4%7122.91%1870.76%
Havant [83] 33.98%15,16647.19%6,04118.8%1,5214.73%3,28010.21%3,73011.61%1,1883.7%9592.98%2540.79%
Horsham [84] 42.03%16,07235.62%12,54527.8%1,6543.67%6,14513.62%5,29811.74%8611.91%2,2244.93%3220.71%
Isle of Wight [85] 38.3%19,39246.67%6,55715.78%2,4815.97%6,85516.5%3,5778.61%1,2923.11%1,1072.66%2900.7%
Lewes [86] 44.32%10,21031.12%9,14427.87%1,9485.94%6,70720.44%2,7478.37%5601.71%1,3083.99%1880.57%
Maidstone [87] 37.8%20,47545.98%9,45421.23%2,4375.47%4,53010.17%4,69710.55%1,0622.38%1,5803.55%2970.67%
Medway [88]  %30,86148.29%8,64713.53%7,47211.69%5,8429.14%6,2199.73%2,3203.63%2,0093.14%5470.86%
Mid Sussex [89] 40.9%14,96833.15%13,70930.36%1,8214.03%6,45614.3%4,84910.74%7191.59%2,3325.16%3030.67%
Milton Keynes [90]  %20,61733.56%14,99624.41%8,70714.18%6,80211.07%5,6759.24%1,6262.65%2,4774.03%5250.85%
Mole Valley [91] 46%9,92032.77%11,05536.51%8252.72%3,27510.82%3,26610.79%5561.84%1,2174.02%1620.54%
New Forest [92] 38.7%23,85444.03%12,15322.43%1,8403.4%6,30511.64%6,46611.94%1,3512.49%1,8173.35%3850.71%
Oxford [93] 47.6%5,99913.29%18,19040.30%6,44414.28%10,23922.68%1,7553.89%5111.13%1,7653.91%2380.53%
Portsmouth [94] 33.5%18,31539.46%10,60122.84%4,94910.66%5,86912.64%3,3687.26%1,5033.24%1,4673.16%3440.74%
Reading [95] 38.7%9,03422.35%11,39728.19%6,78816.79%7,00917.34%3,2087.94%6861.7%1,9304.77%3760.93%
Reigate and Banstead [96]  %14,65335.63%10,78926.24%2,1585.25%5,62813.69%4,77211.6%8892.16%1,9224.67%3130.76%
Rother [97] 41.37%14,33447.29%6,06920.02%1,4014.62%3,51011.58%2,7108.94%8442.78%1,2003.96%2450.81%
Runnymede [98] 36.4%7,88037.41%5,01423.81%1,3326.32%2,57912.24%2,49211.83%5632.67%1,0074.78%1950.93%
Rushmoor [99] 35.2%8,30237.45%4,81121.7%2,30910.42%2,48011.19%2,46011.1%7533.4%8293.74%2251.01%
Sevenoaks [100] 41.1%14,53440.34%9,13525.35%1,4704.08%3,99611.09%4,31511.98%6731.87%1,6804.66%2290.64%
Slough [101] 27.2%5,95425.17%3,41214.42%8,91737.69%1,5396.51%2,1489.08%5542.34%8163.45%3171.34%
Southampton [102] 34.4%17,68332.84%11,97222.23%8,20015.23%7,79414.47%4,2807.95%1,4692.73%2,0063.73%4430.82%
South Bucks [103] 40.4%7,31035%5,34025.57%1,2005.75%2,16310.36%3,16915.17%3721.78%1,1655.58%1660.79%
South Oxfordshire [104] 43.34%13,19729.3%15,23333.83%1,8184.04%6,80715.12%4,63910.3%7631.69%2,2374.97%3400.75%
Spelthorne [105] 37.8%10,86040.42%5,91322.01%2,2878.51%2,84210.58%2,85810.64%8493.16%1,0343.85%2240.83%
Surrey Heath [106] 38.1%9,49238.31%6,54626.42%1,1094.48%2,75311.11%3,17412.81%4711.9%1,0144.09%2170.88%
Swale [107] 33.9%17,45149.58%5,91116.79%2,4486.95%3,76110.68%2,8748.16%1,2643.59%1,1893.38%3030.86%
Tandridge [108] 41.2%10,09038.68%6,97526.74%1,0073.86%2,88511.06%3,00411.52%6442.47%1,2904.95%1900.73%
Test Valley [109] 40.3%14,27137.87%10,33727.43%1,3733.64%4,29911.41%4,74712.6%8182.17%1,5654.15%2750.73%
Thanet [110] 36.11%17,43049.19%5,03414.21%3,0548.62%4,32312.2%2,9028.19%1,3563.83%1,1113.14%2210.62%
Tonbridge and Malling [111] 38.9%15,71342.16%8,26422.17%1,5314.11%4,81012.91%4,45411.95%7562.03%1,5294.1%2120.57%
Tunbridge Wells [112] 43.1%11,37032.96%10,88931.57%1,5204.41%4,62413.4%3,50710.17%6431.86%1,7255%2180.63%
Vale of White Horse [113] 44.42%11,97627.97%17,27340.35%1,6283.8%5,38412.58%3,9009.11%7341.71%1,6603.88%2570.6%
Waverley [114] 44.6%11,59928.76%14,15635.1%1,0092.5%5,86114.53%4,63611.5%6131.52%2,0935.19%3610.9%
Wealden [115] 41.65%21,32142.23%11,08021.94%1,6813.33%7,33914.54%5,59311.08%1,0862.15%2,0474.05%3440.68%
West Berkshire [116] 39.30%15,83033.99%13,98130.02%1,6323.5%6,02912.94%5,97412.83%8831.9%1,9484.18%2980.64%
West Oxfordshire [117] 41.46%10,50131.25%10,60431.56%1,8125.39%4,78214.23%3,68310.96%6381.9%1,3554.03%2250.67%
Winchester [118] 47.0%12,15729.14%16,84840.38%1,0412.5%5,00311.99%4,27510.25%5671.36%1,6223.89%2080.5%
Windsor and Maidenhead [119] 39.6%13,28932.51%12,76931.23%1,8474.52%4,55411.14%5,49613.44%5801.42%2,0515.02%2960.72%
Woking [120] 38.7%7,68228.35%9,79736.15%1,6446.07%2,84310.49%3,07511.35%5071.87%1,3394.94%2140.79%
Wokingham [121] 41.7%14,72829.05%17,37934.28%2,6895.3%5,80711.45%6,33012.49%7591.5%2,6505.23%3530.7%
Worthing [57] 38.1%11,32936.3%6,74221.6%2,9939.59%4,86615.59%3,0059.63%7262.33%1,3304.26%2150.69%
Wycombe [122] 39.96%15,65231.26%13,33326.62%4,8939.77%6,61713.21%6,02112.02%9421.88%2,2614.51%3590.72%

Best and worst results for each party

BrexitLiberal DemocratLabourGreenConservative
Local authority%Local authority%Local authority%Local authority%Local authority%
Best1 Gosport 50.44 Winchester 40.38 Slough 37.69 Brighton & Hove 35.53 South Bucks 15.17
2 Swale 49.58 Vale of White Horse 40.35 Crawley 18.77 Oxford 22.68 Windsor and Maidenhead 13.44
3 Thanet 49.19 Oxford 40.3 Reading 16.79 Lewes 20.44 West Berkshire 12.83
4 Arun 48.68 Elmbridge 38.86 Gravesham 15.33 Hastings 18.31 Surrey Heath 12.81
5 Folkestone & Hythe 48.35 Mole Valley 36.51 Southampton 15.23 Reading 17.34 Chiltern 12.75
6 Medway 48.29 Woking 36.15 Oxford 14.28 Adur 17.3 Bracknell Forest 12.7
7 Rother 47.29 Guildford 35.98 Milton Keynes 14.18 Isle of Wight 16.5 Test Valley 12.6
8 Havant 47.19 Waverley 35.1 Hastings 14.15 Worthing 15.59 Wokingham 12.49
9 Dover 46.98 Wokingham 34.28 Brighton & Hove 12.95 Folkestone & Hythe 15.41 Basingstoke and Deane 12.46
10 Isle of Wight 46.67 South Oxfordshire 33.83 Dartford 12.95 South Oxfordshire 15.12 Hart 12.41
Worst1 Oxford 13.29 Gravesham 12.75 Winchester 2.5 Slough 6.51 Oxford 3.89
2 Brighton & Hove 17.35 Medway 13.53 Waverley 2.5 Dartford 8.55 Brighton & Hove 5.17
3 Reading 22.35 Dartford 13.57 Mole Valley 2.72 Gravesham 8.83 Hastings 6.75
4 Slough 25.17 Thanet 14.21 Hart 2.82 Medway 9.14 Portsmouth 7.26
5 Elmbridge 27.58 Slough 14.42 East Hampshire 3.04 Crawley 9.4 Canterbury 7.88
6 Vale of White Horse 27.97 Gosport 15.32 Chichester 3.09 Maidstone 10.17 Reading 7.94
7 Woking 28.35 Folkestone & Hythe 15.56 Wealden 3.33 Havant 10.21 Southampton 7.95
8 Waverley 28.76 Isle of Wight 15.78 New Forest 3.4 Gosport 10.27 Folkestone & Hythe 7.99
9 Guildford 29.0 Crawley 16.39 West Berkshire 3.5 Elmbridge 10.34 Swale 8.16
10 Wokingham 29.05 Dover 16.79 Test Valley 3.64 South Bucks 10.36 Thanet 8.19
Change UKUKIP
Local authority%Local authority%
Best1 Epsom and Ewell 5.93 Thanet 3.83
2 South Bucks 5.58 Havant 3.7
3 Chiltern 5.47 Medway 3.63
4 Elmbridge 5.33 Gravesham 3.61
5 Wokingham 5.23 Swale 3.59
6 Guildford 5.19 Gosport 3.51
7 Waverley 5.19 Dartford 3.47
8 Mid Sussex 5.16 Rushmoor 3.4
9 Hart 5.13 Portsmouth 3.24
10 Windsor and Maidenhead 5.02 Spelthorne 3.16
Worst1 Isle of Wight 2.66 Brighton & Hove 1.03
2 Eastbourne 2.76 Oxford 1.13
3 Hastings 2.91 Elmbridge 1.26
4 Havant 2.98 Guildford 1.31
5 Medway 3.14 Winchester 1.36
6 Thanet 3.14 Windsor and Maidenhead 1.42
7 Gosport 3.15 Chiltern 1.44
8 Portsmouth 3.16 Wokingham 1.5
9 Folkestone & Hythe 3.18 Waverley 1.52
10 Arun 3.21 Mid Sussex 1.59

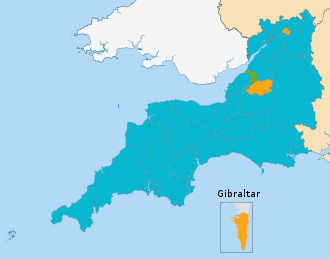
South West England (6 seats)

Map showing highest polling party by counting area in the South West England electoral region. 2019 European Parliament election in the United Kingdom area results (South West England).svg
Map showing highest polling party by counting area in the South West England electoral region.
European Election 2019: South West England [123]
ListCandidatesVotes%±
Brexit Party Ann Widdecombe, James Glancy, Christina Jordan
Ann Tarr, Roger Lane-Nott, Nicola Darke
611,742
(203,914)
36.71
Liberal Democrats Caroline Voaden, Martin Horwood
Stephen Williams, Eleanor Rylance, David Chalmers, Luke Stagnetto
385,095
(192,547.5)
23.11+12.41
Green Molly Scott Cato
Cleo Lake, Carla Denyer, Tom Scott, Martin Dimery, Karen La Borde
302,36418.14+7.04
Conservative Ashley Fox, James Mustoe, Faye Purbrick, Claire Hiscott, James Taghdissian, Emmline Owens144,6748.68-20.21
Labour Clare Moody, Andrew Adonis, Jayne Kirkham, Neil Guild, Yvonne Atkinson, Sadik Al-Hassan108,1006.49-7.26
UKIP Lawrence Webb, Carl Benjamin, Anthony McIntyre, Lester Taylor, Stephen Lee, Alison Sheridan53,7393.22-29.07
Change UK Rachel Johnson, Jim Godfrey, Oliver Middleton, Matthew Hooberman, Elizabeth-Anne Sewell, Crispin Hunt 46,6122.80
English Democrat Jenny Knight, Michael Blundell8,3930.50-0.50
Independent Larch Maxey1,7720.11
Independent Mothiur Rahman7550.05
Independent Neville Seed3,3830.20
Turnout 1,678,61940.5%+3.5

The South West England electoral region is broken down into 30 local council areas and Gibraltar.

District [124] Voter turnout,
of eligible [125]
BrexitLib DemLabourGreenConservativeUKIPChange UKOthers
# %# %# %# %#%#%#%#%
Bath and North East Somerset 44.4%15,73826.5%20,78735.0%3,1825.4%12,23020.6%4,0306.8%1,3672.3%1,6992.9%3800.64%
Bournemouth, Christchurch and Poole 35.9%42,17941.8%21,38921.2%5,5915.5%15,20515.1%8,5558.5%3,8633.8%3,2443.2%9010.89%
Bristol 44.6%26,07118.6%31,51022.5%19,43113.9%49,12635.1%6,6234.7%3,1962.3%3,2582.3%8250.59%
Cheltenham 43.3%10,09927.0%13,63136.5%1,6424.4%6,33216.9%3,5219.4%7692.1%1,1273.0%2540.68%
Cornwall 41.4%71,68141.1%34,84520.0%10,7826.2%31,54418.1%13,4867.7%6,2093.6%4,1912.4%1,6820.96%
Cotswold 43.2%10,27534.3%9,06730.2%8512.8%4,21714.1%3,74112.5%7152.4%9223.1%2110.70%
Dorset 41.1%50,16341.9%26,78922.4%4,7284.0%17,84314.9%12,07610.1%4,2533.6%2,9462.5%8960.75%
East Devon 40.7%19,60341.4%9,60720.3%1,6443.5%8,50818.0%4,2439.0%1,5133.2%1,5783.3%6201.31%
Exeter 40.5%10,04228.1%7,23620.2%4,39512.3%9,74227.2%2,1095.9%9542.7%1,0903.0%2110.59%
Forest of Dean 37.9%10,55341.8%4,25516.8%1,8337.3%4,48917.8%2,3099.1%9003.6%6842.7%2521.00%
Gloucester 35.3%11,46338.6%5,76919.4%3,54511.9%3,74812.6%2,99410.1%1,1183.8%7912.7%3041.02%
Isles of Scilly 55.4%23827.8%20624.1%495.7%21224.8%9010.5%202.3%313.6%101.17%
Mendip 42.4%12,08333.0%9,49925.9%1,4704.0%8,34722.8%3,0928.4%9912.7%8662.4%2730.75%
Mid Devon 40.0%9,57238.7%5,21321.1%1,0504.2%4,73119.1%2,3279.4%8883.6%6982.8%2410.97%
North Devon 38.1%12,07742.7%6,58723.3%1,1013.9%4,26115.1%2,4088.5%1,0463.7%5632.0%2660.94%
North Somerset 38.5%23,38837.8%14,85324.0%3,0805.0%10,81217.5%5,0368.1%1,8913.1%2,1483.5%6050.98%
Plymouth 34.9%28,28942.8%9,30314.1%8,10112.3%9,06413.7%5,6748.6%3,0714.7%1,9152.9%6200.94%
Sedgemoor 35.4%14,31445.1%6,46920.4%1,6925.3%3,80712.0%3,21910.2%1,2544.0%7012.2%2490.79%
Somerset West and Taunton 41.8%18,82240.3%12,08425.9%1,7903.8%6,53514.0%4,1879.0%1,5473.3%1,2962.8%4500.96%
South Gloucestershire 37.5%27,83936.8%18,24524.1%5,4627.2%11,14914.7%7,63310.1%2,4813.3%2,1762.9%6270.83%
South Hams 46.8%11,27835.6%7,59524.0%1,2183.8%6,86721.7%2,8088.9%6942.2%1,0323.3%2170.68%
South Somerset 40.8%21,71242.6%13,00625.5%1,6083.2%6,63613.0%4,6339.1%1,7403.4%1,2092.4%4670.92%
Stroud 46.3%12,50129.2%9,13421.3%2,8636.7%12,14328.3%3,7418.7%1,0032.3%1,2062.8%2900.68%
Swindon 35.7%19,12635.7%9,51117.8%7,83814.6%6,86112.8%5,55010.4%2,1153.9%2,0263.8%5240.98%
Teignbridge 42.5%18,34141.6%10,55123.9%1,7654.0%7,47817.0%3,1897.2%1,2722.9%1,1332.6%3440.78%
Tewkesbury 38.0%9,94537.7%6,53424.8%1,0253.9%3,78514.4%3,08411.7%8633.3%8873.4%2250.85%
Torbay 36.3%18,82151.6%6,82418.7%1,6354.5%3,71510.2%2,7867.6%1,4163.9%9782.7%3080.84%
Torridge 39.7%10,20248.7%3,65717.4%9064.3%3,03814.5%1,5407.3%8964.3%4882.3%2351.12%
West Devon 45.9%7,96840.7%3,90819.9%7333.7%3,72119.0%1,8599.5%6003.1%5793.0%2241.14%
Wiltshire 44.3%56,61335.8%39,81125.1%6,6794.2%25,75116.3%17,87511.3%5,0103.2%5,0733.2%1,5220.96%

Gibraltar

Overseas Territory Voter turnout,
of eligible
Votes
BrexitLib DemLabourGreenConservativeUKIPChange UKOthers
#%#%#%#%#%#%#%#%
Gibraltar [126] [127] 39.8%7468.0%7,22077.4%4114.4%4675.0%2562.7%840.9%770.8%700.75%

Best and worst results for each party

BrexitLiberal DemocratLabourGreenConservative
Local authority%Local authority%Local authority%Local authority%Local authority%
Best1 Torbay 51.6 Cheltenham 36.5 Swindon 14.6 Bristol 35.1 Cotswold 12.5
2 Torridge 48.7 Bath and North East Somerset 35.0 Bristol 13.9 Stroud 28.3 Tewkesbury 11.7
3 Sedgemoor 45.1 Cotswold 30.2 Exeter 12.3 Exeter 27.2 Wiltshire 11.3
4 Plymouth 42.8 Mendip 25.9 Plymouth 12.3 Isles of Scilly 24.8 Isles of Scilly 10.5
5 North Devon 42.7 Somerset West and Taunton 25.9 Gloucester 11.9 Mendip 22.8 Swindon 10.4
6 South Somerset 42.6 South Somerset 25.5 Forest of Dean 7.3 South Hams 21.7 Sedgemoor 10.2
7 Dorset 41.9 Wiltshire 25.1 South Gloucestershire 7.2 Bath and North East Somerset 20.6 Dorset 10.1
8 Bournemouth, Christchurch and Poole 41.8 Tewkesbury 24.8 Stroud 6.7 Mid Devon 19.1 Gloucester 10.1
9 Forest of Dean 41.8 Isles of Scilly 24.1 Cornwall 6.2 West Devon 19.0 South Gloucestershire 10.1
10 Teignbridge 41.6 South Gloucestershire 24.1 Isles of Scilly 5.7 Cornwall 18.1 West Devon 9.5
Worst1 Bristol 18.6 Plymouth 14.1 Cotswold 2.8 Torbay 10.2 Bristol 4.7
2 Bath and North East Somerset 26.5 Forest of Dean 16.8 South Somerset 3.2 Sedgemoor 12.0 Exeter 5.9
3 Cheltenham 27.0 Torridge 17.4 East Devon 3.5 Gloucester 12.6 Bath and North East Somerset 6.8
4 Isles of Scilly 27.8 Swindon 17.8 West Devon 3.7 Swindon 12.8 Teignbridge 7.2
5 Exeter 28.1 Torbay 18.7 Somerset West and Taunton 3.8 South Somerset 13.0 Torridge 7.3
6 Stroud 29.2 Gloucester 19.4 South Hams 3.8 Plymouth 13.7 Torbay 7.6
7 Mendip 33.0 West Devon 19.9 North Devon 3.9 Somerset West and Taunton 14.0 Cornwall 7.7
8 Cotswold 34.3 Cornwall 20.0 Tewkesbury 3.9 Cotswold 14.1 North Somerset 8.1
9 South Hams 35.6 Exeter 20.2 Dorset 4.0 Tewkesbury 14.4 Mendip 8.4
10 Swindon 35.7 East Devon 20.3 Mendip 4.0 Torridge 14.5 Bournemouth, Christchurch and Poole 8.5
Change UKUKIP
Local authority%Local authority%
Best1 Swindon 3.8 Plymouth 4.7
2 Isles of Scilly 3.6 Torridge 4.3
3 North Somerset 3.5 Sedgemoor 4.0
4 Tewkesbury 3.4 Swindon 3.9
5 East Devon 3.3 Torbay 3.9
6 South Hams 3.3 Bournemouth, Christchurch and Poole 3.8
7 Bournemouth, Christchurch and Poole 3.2 Gloucester 3.8
8 Wiltshire 3.2 North Devon 3.7
9 Cotswold 3.1 Cornwall 3.6
10 Cheltenham 3.0 Dorset 3.6
Worst1 North Devon 2.0 Cheltenham 2.1
2 Sedgemoor 2.2 South Hams 2.2
3 Bristol 2.3 Bath and North East Somerset 2.3
4 Torridge 2.3 Bristol 2.3
5 Cornwall 2.4 Isles of Scilly 2.3
6 Mendip 2.4 Stroud 2.3
7 South Somerset 2.4 Cotswold 2.4
8 Dorset 2.5 Exeter 2.7
9 Teignbridge 2.6 Mendip 2.7
10 Forest of Dean 2.7 Teignbridge 2.9

West Midlands (7 seats)

Map showing highest polling party by counting area in the West Midlands electoral region. 2019 European Parliament election in the United Kingdom area results (West Midlands).svg
Map showing highest polling party by counting area in the West Midlands electoral region.
European Election 2019: West Midlands [128]
ListCandidatesVotes%±
Brexit Party Rupert Lowe, Martin Daubney, Andrew England Kerr
Vishal Khatri, Nikki Page, Laura Kevehazi, Katharine Harborne
507,152
(169,050.7)
37.66N/A
Labour Neena Gill
Sion Simon, Julia Buckley, Ansar Khan, Zarah Sultana, Sam Hennessy, Liz Clements
228,29816.95Decrease2.svg 9.76
Liberal Democrats Phil Bennion
Ade Adeyemo, Jeanie Falconer, Jenny Wilkinson, Jennifer Gray, Beverley Nielsen, Lee Dargue
219,98216.33Increase2.svg 10.77
Green Ellie Chowns
Diana Toynbee, Paul Woodhead, Julian Dean, Louis Stephen, Helen Heathfield, Kefentse Dennis
143,52010.66Increase2.svg 5.40
Conservative Anthea McIntyre
Daniel Dalton, Suzanne Webb, Meirion Jenkins, Alex Philips, Mary Noone, Ahmed Ejaz
135,27910.04Decrease2.svg 14.27
UKIP Ernest Valentine, Paul Williams, Graham Eardley, Paul Allen, Nigel Ely, Joe Smyth, Derek Bennett66,9344.97Decrease2.svg 26.52
Change UK Stephen Dorrell, Charlotte Gath, Peter Wilding, Amrik Kandola, Joanna McKenna, Victor Odusanya, Lucinda Empson45,6733.39N/A
Turnout 1,355,21632.9%

The West Midlands electoral region is broken down into 30 voting areas.

District [129] TurnoutBrexitLib DemLabourGreenConservativeUKIPChange UK
# %# %# %# %# %#%#%#%
Birmingham 220,28031.1%52,95324.035,88016.377,55135.224,61411.215,1336.98,0743.76,0752.8
Bromsgrove 27,29737.3%10,70039.25,85721.51,8496.83,11011.43,48312.81,1524.21,1464.2
Cannock Chase 20,95828.4%10,53850.31,9519.32,37311.31,9129.12,11110.11,4687.06052.9
Coventry 66,52130.7%21,26032.010,08115.216,99125.57,82011.85,0837.63,2694.92,0173.0
Dudley 72,00330.3%34,14947.48,05111.210,62014.75,3177.47,51010.44,4886.21,8682.6
East Staffordshire 27,36933.3%11,44241.83,98314.63,37512.32,2488.23,83414.01,4155.21,0723.9
Herefordshire 55,19639.8%21,87639.611,37420.62,3824.38,75915.95,94210.82,5744.72,2894.1
Lichfield 28,40035.5%12,18542.95,49019.31,9506.73,01210.63,39612.01,3584.81,0093.6
Malvern Hills 25,84243.3%9,40336.46,50125.21,0384.03,87915.02,85911.11,0404.01,1224.3
Newcastle-under-Lyme 30,77333.9%13,51743.94,38514.24,19813.62,9609.62,8599.31,8866.19683.1
North Warwickshire 15,85032.5%7,88149.71,86511.81,5369.71,3288.41,68010.61,0566.75043.2
Nuneaton and Bedworth 31,49933.5%14,36945.63,76712.04,67814.92,7578.83,0319.61,9506.29473.0
Redditch 18,94732.2%8,16243.12,65714.02,32612.31,6558.72,19511.61,1666.27864.1
Rugby 28,94838.7%10,98738.06,25521.62,93710.13,14010.83,33011.51,2244.21,0753.7
Sandwell 60,07127.9%21,92436.54,3237.221,33535.54,0496.73,5195.93,5505.91,3712.3
Shropshire 92,68839.1%36,26039.119,50521.06,6657.212,24213.210,75311.63,9244.23,3393.6
Solihull 54,28734.2%21,37139.411,38721.03,6326.76,77512.57,06813.02,1243.91,9303.6
South Staffordshire 28,05233.2%14,06850.13,57812.81,6415.82,4228.63,74013.31,5505.51,0533.8
Stafford 35,75742.5%14,33940.16,42418.03,2889.24,12811.54,06811.41,8475.21,6634.7
Staffordshire Moorlands 25,44032.6%12,02147.33,68314.52,1498.42,4629.72,78110.91,3695.49753.8
Stoke-on-Trent 44,91726.5%20,43445.54,1179.29,05520.23,0366.83,4387.73,2137.21,6243.6
Stratford-on-Avon 41,96926.5%14,72335.111,32927.01,6283.95,16912.35,76113.71,5353.71,8244.3
Tamworth 17,10730.6%8,06747.21,99411.71,83010.71,3067.62,11512.41,2387.25573.3
Telford and Wrekin 40,96433.1%16,81141.05,62713.76,77516.53,4458.44,40710.82,3515.71,5483.8
Walsall 55,06928.7%23,53142.75,3539.711,83821.53,1255.75,84210.63,8667.01,5142.7
Warwick 44,41942.0%11,20725.213,23329.84,2319.58,28918.74,4069.91,1332.61,9204.3
Wolverhampton 48,98628.8%18,11037.05,10010.413,70628.03,5317.24,4369.12,8645.81,2392.5
Worcester 25,40735.3%8,36432.95,01819.83,10912.24,29316.92,4789.81,1724.69733.8
Wychavon 37,38839.2%15,26240.87,49220.01,7574.74,11611.05,53914.81,6554.41,5674.2
Wyre Forest 24,43432.6%11,23846.03,72215.21,8557.62,62110.72,48210.21,4235.81,0934.5

Best and worst results for each party

BrexitLiberal DemocratLabourGreenConservative
Local authority%Local authority%Local authority%Local authority%Local authority%
Best1 Cannock Chase 50.3 Warwick 29.8 Sandwell 35.5 Warwick 18.7 Wychavon 14.8
2 South Staffordshire 50.1 Stratford-on-Avon 27.0 Birmingham 35.2 Worcester 16.9 East Staffordshire 14.0
3 North Warwickshire 49.7 Malvern Hills 25.2 Wolverhampton 28.0 Herefordshire 15.9 Stratford-on-Avon 13.7
4 Dudley 47.4 Rugby 21.6 Coventry 25.5 Malvern Hills 15.0 South Staffordshire 13.3
5 Staffordshire Moorlands 47.3 Bromsgrove 21.5 Walsall 21.5 Shropshire 13.2 Solihull 13.0
6 Tamworth 47.2 Shropshire 21.0 Stoke-on-Trent 20.2 Solihull 12.5 Bromsgrove 12.8
7 Wyre Forest 46.0 Solihull 21.0 Telford and Wrekin 16.5 Stratford-on-Avon 12.3 Tamworth 12.4
8 Nuneaton and Bedworth 45.6 Herefordshire 20.6 Nuneaton and Bedworth 14.9 Coventry 11.8 Lichfield 12.0
9 Stoke-on-Trent 45.5 Wychavon 20.0 Dudley 14.7 Stafford 11.5 Redditch 11.6
10 Newcastle-under-Lyme 43.9 Worcester 19.8 Newcastle-under-Lyme 13.6 Bromsgrove 11.4 Shropshire 11.6
Worst1 Birmingham 24.0 Sandwell 7.2 Stratford-on-Avon 3.9 Walsall 5.7 Sandwell 5.9
2 Warwick 25.2 Stoke-on-Trent 9.2 Malvern Hills 4.0 Sandwell 6.7 Birmingham 6.9
3 Coventry 32.0 Cannock Chase 9.3 Herefordshire 4.3 Stoke-on-Trent 6.8 Coventry 7.6
4 Worcester 32.9 Walsall 9.7 Wychavon 4.7 Wolverhampton 7.2 Stoke-on-Trent 7.7
5 Stratford-on-Avon 35.1 Wolverhampton 10.4 South Staffordshire 5.8 Dudley 7.4 Wolverhampton 9.1
6 Malvern Hills 36.4 Dudley 11.2 Lichfield 6.7 Tamworth 7.6 Newcastle-under-Lyme 9.3
7 Sandwell 36.5 Tamworth 11.7 Solihull 6.7 East Staffordshire 8.2 Nuneaton and Bedworth 9.6
8 Wolverhampton 37.0 North Warwickshire 11.8 Bromsgrove 6.8 North Warwickshire 8.4 Worcester 9.8
9 Rugby 38.0 Nuneaton and Bedworth 12.0 Shropshire 7.2 Telford and Wrekin 8.4 Warwick 9.9
10 Shropshire 39.1 South Staffordshire 12.8 Wyre Forest 7.6 South Staffordshire 8.6 Cannock Chase 10.1
Change UKUKIP
Local authority%Local authority%
Best1 Stafford 4.7 Stoke-on-Trent 7.2
2 Wyre Forest 4.5 Tamworth 7.2
3 Malvern Hills 4.3 Cannock Chase 7.0
4 Stratford-on-Avon 4.3 Walsall 7.0
5 Warwick 4.3 North Warwickshire 6.7
6 Bromsgrove 4.2 Dudley 6.2
7 Wychavon 4.2 Nuneaton and Bedworth 6.2
8 Herefordshire 4.1 Redditch 6.2
9 Redditch 4.1 Newcastle-under-Lyme 6.1
10 East Staffordshire 3.9 Sandwell 5.9
Worst1 Sandwell 2.3 Warwick 2.6
2 Wolverhampton 2.5 Birmingham 3.7
3 Dudley 2.6 Stratford-on-Avon 3.7
4 Walsall 2.7 Solihull 3.9
5 Birmingham 2.8 Malvern Hills 4.0
6 Cannock Chase 2.9 Bromsgrove 4.2
7 Coventry 3.0 Rugby 4.2
8 Nuneaton and Bedworth 3.0 Shropshire 4.2
9 Newcastle-under-Lyme 3.1 Wychavon 4.4
10 North Warwickshire 3.2 Worcester 4.6

Yorkshire and the Humber (6 seats)

Map showing highest polling party by counting area in the Yorkshire and the Humber electoral region. 2019 European Parliament election in the United Kingdom area results (Yorkshire and the Humber).svg
Map showing highest polling party by counting area in the Yorkshire and the Humber electoral region.
European election 2019: Yorkshire and the Humber [130]
ListCandidatesVotes%±
Brexit Party John Longworth , Lucy Harris , Jake Pugh
James Heartfield, Andrew Allison, Christopher Barker
470,351
(156,783.7)
36.5%N/A
Labour Richard Corbett
Eloise Todd, Jawad Mohammed Khan, Jayne Allport, Martin Mayer, Alison Hume
210,51616.3%Decrease2.svg13.0%
Liberal Democrats Shaffaq Mohammed
Rosina Robson, James Blanchard, Sophie Thornton, James Baker, Ruth Coleman-Taylor
200,18015.5%Increase2.svg9.3%
Green Magid Magid
Alison Teal, Andrew Cooper, Louise Houghton, Lars Kramm, Ann Forsaith
166,98013.0%Increase2.svg5.1%
Conservative John Procter, Amjad Bashir, Michael Naughton, Andrew Lee, Matthew Freckleton, Sue Pascoe92,8637.2%Decrease2.svg12.0%
UKIP Mike Hookem, Gary Shores, John Hancock, David Dews, Graeme Waddicar, Clifford Parsons56,1004.4%Decrease2.svg26.8%
Yorkshire Chris Whitwood, Mike Jordan, Jack Carrington, Laura Walker, Bob Buxton, Dan Cochran50,8423.9%Increase2.svg2.5%
Change UK Diana Wallis, Juliet Lodge, Sophia Bow, Joshua Malkin, Rosanne McMullen, Steven Wilson30,1622.3%N/A
English Democrat David Allen, Tony Allen, Joanne Allen, Fiona Allen11,2830.9%Decrease2.svg0.1%
Turnout 1,289,27733.5%

The Yorkshire and the Humber electoral region is broken down into 21 local council areas.

DistrictTurnoutBrexitLib DemLabourGreenConservativeUKIPChange UKYorkshireEng Dem
#%#%#%#%#%#%#%#%#%#%
Barnsley 28.0%23,45947.64,6189.47,69315.64,0648.21,8783.82,8995.91,2002.42,8925.96161.2
Bradford 32.0%33,56729.915,88214.132,39928.812,40111.07,5216.74,1693.71,9481.73,5963.29660.9
Calderdale 35.7%18,83835.67,49314.29,72418.46,90213.04,2618.11,9083.61,1112.12,2584.34250.8
Craven 41.6%6,30234.43,67720.11,1906.53,09116.92,04111.16203.44972.78114.41090.6
Doncaster 30.8%30,01645.05,9088.911,39317.14,8987.34,1226.23,8625.81,5652.33,9635.99531.4
East Riding of Yorkshire 33.8%39,46544.413,97615.76,0516.88,5589.69,54510.73,9374.42,3712.74,1794.77340.8
Hambleton 40.7%10,61536.85,38918.71,4104.93,59912.54,19714.51,0353.68923.11,5115.22320.8
Harrogate 42.8%16,03931.813,70727.12,2484.56,44712.86,36412.61,5093.01,6983.42,1974.42320.6
Kingston upon Hull 24.0%18,57244.05,66713.47,83218.63,8879.21,2292.92,7256.56851.61,1572.74621.1
Kirklees 34.7%35,84334.214,84514.225,43524.210,93410.46,8206.54,0763.92,1032.03,9673.88720.8
Leeds 34.2%53,60028.934,07618.436,37719.629,60316.012,8246.96,3803.44,8132.66,4173.51,3480.7
North East Lincolnshire 28.7%16,89551.92,9169.03,44410.62,3707.33,2249.92,2346.98712.71680.54451.4
North Lincolnshire 31.4%18,30847.03,8669.94,88212.53,2068.24,47511.52,2345.71,0202.64661.24811.2
Richmondshire 36.3%5,28039.82,50818.95434.11,57111.81,68112.74753.64793.65934.51301.0
Rotherham 32.5%26,95143.35,4788.811,37318.35,4718.83,2085.23,9026.31,4002.23,7196.07391.2
Ryedale 39.3%6,19037.93,17619.58074.92,11513.02,01412.35403.34732.98995.51150.7
Scarborough 35.5%12,62443.44,01713.82,8539.83,22411.12,5288.71,4354.97802.71,3874.82530.9
Selby 36.2%9,73340.33,80315.82,0358.42,49010.32,48010.39954.17283.01,6857.01840.8
Sheffield 35.9%39,53428.125,36618.123,92517.034,80324.84,8273.45,4083.92,4921.83,0892.29980.7
Wakefield 29.9%33,17344.97,47210.012,66117.05,9238.04,2675.74,3175.81,5482.14,3815.96700.9
York 39.9%15,34726.716,34028.56,24110.911,42319.93,3575.81,1402.51,4882.61,5072.62730.5

Best and worst results for each party

BrexitLiberal DemocratLabourGreenConservative
Local authority%Local authority%Local authority%Local authority%Local authority%
Best1 North East Lincolnshire 51.9 York 28.5 Bradford 28.8 Sheffield 24.8 Hambleton 14.5
2 Barnsley 47.6 Harrogate 27.1 Kirklees 24.2 York 19.9 Richmondshire 12.7
3 North Lincolnshire 47.0 Craven 20.1 Leeds 19.6 Craven 16.9 Harrogate 12.6
4 Doncaster 45.0 Ryedale 19.5 Kingston upon Hull 18.6 Leeds 16.0 Ryedale 12.3
5 Wakefield 44.9 Richmondshire 18.9 Calderdale 18.4 Calderdale 13.0 North Lincolnshire 11.5
6 East Riding of Yorkshire 44.4 Hambleton 18.7 Rotherham 18.3 Ryedale 13.0 Craven 11.1
7 Kingston upon Hull 44.0 Leeds 18.4 Doncaster 17.1 Harrogate 12.8 East Riding of Yorkshire 10.7
8 Scarborough 43.4 Sheffield 18.1 Sheffield 17.0 Hambleton 12.5 Selby 10.3
9 Rotherham 43.3 Selby 15.8 Wakefield 17.0 Richmondshire 11.8 North East Lincolnshire 9.9
10 Selby 40.3 East Riding of Yorkshire 15.7 Barnsley 15.6 Scarborough 11.1 Scarborough 8.7
Worst1 York 26.7 Rotherham 8.8 Richmondshire 4.1 Doncaster 7.3 Kingston upon Hull 2.9
2 Sheffield 28.1 Doncaster 8.9 Harrogate 4.5 North East Lincolnshire 7.3 Sheffield 3.4
3 Leeds 28.9 North East Lincolnshire 9.0 Hambleton 4.9 Wakefield 8.0 Barnsley 3.8
4 Bradford 29.9 Barnsley 9.4 Ryedale 4.9 Barnsley 8.2 Rotherham 5.2
5 Harrogate 31.8 North Lincolnshire 9.9 Craven 6.5 North Lincolnshire 8.2 Wakefield 5.7
6 Kirklees 34.2 Wakefield 10.0 East Riding of Yorkshire 6.8 Rotherham 8.8 York 5.8
7 Craven 34.4 Kingston upon Hull 13.4 Selby 8.4 Kingston upon Hull 9.2 Doncaster 6.2
8 Calderdale 35.6 Scarborough 13.8 Scarborough 9.8 East Riding of Yorkshire 9.6 Kirklees 6.5
9 Hambleton 36.8 Bradford 14.1 North East Lincolnshire 10.6 Selby 10.3 Bradford 6.7
10 Ryedale 37.9 Calderdale 14.2 York 10.9 Kirklees 10.4 Leeds 6.9
Change UKUKIPYorkshireEng Dem
Local authority%Local authority%Local authority%Local authority%
Best1 Richmondshire 3.6 North East Lincolnshire 6.9 Selby 7.0 Doncaster 1.4
2 Harrogate 3.4 Kingston upon Hull 6.5 Rotherham 6.0 North East Lincolnshire 1.4
3 Hambleton 3.1 Rotherham 6.3 Barnsley 5.9 Barnsley 1.2
4 Selby 3.0 Barnsley 5.9 Doncaster 5.9 North Lincolnshire 1.2
5 Ryedale 2.9 Doncaster 5.8 Wakefield 5.9 Rotherham 1.2
6 Craven 2.7 Wakefield 5.8 Ryedale 5.5 Kingston upon Hull 1.1
7 East Riding of Yorkshire 2.7 North Lincolnshire 5.7 Hambleton 5.2 Richmondshire 1.0
8 North East Lincolnshire 2.7 Scarborough 4.9 Scarborough 4.8 Bradford 0.9
9 Scarborough 2.7 East Riding of Yorkshire 4.4 East Riding of Yorkshire 4.7 Scarborough 0.9
10 Leeds 2.6 Selby 4.1 Richmondshire 4.5 Wakefield 0.9
Worst1 Kingston upon Hull 1.6 York 2.5 North East Lincolnshire 0.5 York 0.5
2 Bradford 1.7 Harrogate 3.0 North Lincolnshire 1.2 Craven 0.6
3 Sheffield 1.8 Ryedale 3.3 Sheffield 2.2 Harrogate 0.6
4 Kirklees 2.0 Craven 3.4 York 2.6 Leeds 0.7
5 Calderdale 2.1 Leeds 3.4 Kingston upon Hull 2.7 Ryedale 0.7
6 Wakefield 2.1 Calderdale 3.6 Bradford 3.2 Sheffield 0.7
7 Rotherham 2.2 Hambleton 3.6 Leeds 3.5 Calderdale 0.8
8 Doncaster 2.3 Richmondshire 3.6 Kirklees 3.8 East Riding of Yorkshire 0.8
9 Barnsley 2.4 Bradford 3.7 Calderdale 4.3 Hambleton 0.8
10 North Lincolnshire 2.6 Kirklees 3.9 Craven 4.4 Kirklees 0.8

Northern Ireland (3 seats)

2019 European Parliament election: Northern Ireland [131]
PartyCandidateFPv%Count
12345
DUP Diane Dodds 21.83124,991127,291 155,422  
Alliance Naomi Long 18.50105,928115,327 122,263 123,917.00 170,370.00
Sinn Féin Martina Anderson 22.17126,951128,117 128,190 128,200.50 152,436.50
TUV Jim Allister 10.8362,02163,872 79,540 89,854.00 90,079.00
SDLP Colum Eastwood 13.7278,58980,949 82,101 82,413.50  
Ulster Unionist Danny Kennedy 9.2653,05254,736    
Green (NI) Clare Bailey 2.1812,471    
UKIP Robert Hill0.895,115    
Independent Jane Morrice 0.301,719    
Independent Neil McCann0.17948    
NI Conservatives Amandeep Singh Bhogal0.12662    
Electorate: 1,278,951  Valid: 572,447  Spoilt: 4,649 (0.81%)  Quota: 143,112  Turnout: 577,275 (45.14%)  

    Scotland (6 seats)

    Map showing highest polling party by counting area in the Scotland electoral region. 2019 European Parliament election in the United Kingdom area results (Scotland).svg
    Map showing highest polling party by counting area in the Scotland electoral region.
    European Election 2019: Scotland [132]
    ListCandidatesVotes%±
    SNP Alyn Smith, Christian Allard, Aileen McLeod
    Margaret Ferrier, Heather Anderson, Alex Kerr [133]
    594,553
    (198,184.3)
    37.8%+8.8
    Brexit Party Louis Stedman-Bryce
    Karina Walker, James Ferguson-Hannah, Stuart Waiton, Paul Aitken, Calum Walker
    233,00614.8%N/A
    Liberal Democrats Sheila Ritchie
    Fred Mackintosh, Catriona Bhatia, Vita Zaporozcenko, John Edward, Clive Sneddon [134]
    218,28513.8%+6.8
    Conservative Nosheena Mobarik
    Ian McGill, Shona Haslam, Iain Whyte, Andrea Gee, Michael Kusznir [135]
    182,47611.6%-5.6
    Labour David Martin, Jayne Baxter, Craig Miller, Amy Lee Fraioli, Callum O’Dwyer, Angela Bretherton [136] 146,7249.3%-16.6
    Scottish Green Maggie Chapman, Lorna Slater, Gillian MacKay, Chas Booth, Mags Hall, Allan Faulds129,6038.2%+0.1
    Change UK – The Independent Group David Macdonald,1 Kate Forman, Peter Griffiths, Heather Astbury, Colin McFadyen, Cathy Edgeworth30,0041.9%N/A
    UKIP Donald MacKay, Janice MacKay, Otto Inglis, Mark Meechan, Roy Hill [137] 28,4181.8%-8.7
    Independent Gordon Edgar [138] 6,1280.4%N/A
    Independent Ken Parke [138] 2,0490.1%N/A
    Turnout 1,571,24639.9%+ 6.4

    The Scotland electoral region is broken down into 32 local council areas.

    DistrictVoter turnout,
    of eligible
    SNPBrexitLib DemLabourGreenConservativeUKIPChange UKOthers
    #%# %# %# %# %#%#%#%#%
    Aberdeen City 38.9%19,54134.68,82815.69,57416.94,7858.53,9256.97,21512.81,0341.81,3592.42960.6
    Aberdeenshire 38.6%23,25531.414,67119.812,49616.92,1993.04,5736.213,29718.01,6142.21,5262.13760.5
    Angus 38.8%12,99838.86,27018.73,52610.51,4304.31,9966.05,76717.26101.86351.92440.7
    Argyll and Bute 46.8%11,36637.25,45017.95,01916.41,1973.92,2557.43,98513.15681.95051.71840.6
    Clackmannanshire 37.0%5,58139.82,28216.31,3639.71,58611.39736.91,67712.02782.02231.6620.4
    Dumfries and Galloway 40.6%12,67027.89,98121.94,54410.03,2077.03,1406.99,65121.11,2282.79132.03080.6
    Dundee City 35.7%17,07446.15,19114.03,4599.34,22811.42,7087.32,9958.16441.75521.52010.5
    East Ayrshire 33.2%12,61741.15,04416.42,4418.03,96613.01,6775.53,46411.36772.26152.01750.6
    East Dunbartonshire [139] 47.1%13,41434.54,78712.39,61524.82,6176.73,1128.03,92510.14701.27081.81930.6
    East Lothian 42.9%10,99232.64,48113.35,07915.13,98611.83,0959.24,63513.85321.66792.01330.4
    East Renfrewshire 48.4%11,36633.64,01611.95,48716.22,8348.42,5607.65,89817.54161.29953.02340.7
    City of Edinburgh 50.2%57,43233.316,1629.439,60922.912,2517.123,86813.817,22210.01,8641.13,2691.95250.4
    Falkirk 35.6%18,10243.07,16017.03,8369.14,1329.92,7176.53,9139.39322.21,0442.52980.7
    Fife 38.9%39,44637.616,73816.017,26916.510,2169.77,0596.79,9169.51,9621.91,7981.75440.5
    Glasgow City 35.8%68,21643.915,2769.814,3579.223,42315.018,86212.19,7006.22,4961.62,5111.66410.4
    Highland 43.2%28,68137.313,85418.013,41617.43,1094.07,0529.27,5779.91,6192.11,1991.64100.5
    Inverclyde 39.9%9,23741.93,20714.62,22510.13,23614.71,1365.22,0549.33841.74251.91270.6
    Midlothian 38.2%9,77337.13,70914.13,46313.13,26112.42,3799.02,4059.15502.15962.31520.6
    Moray 38.0%9,02734.15,80721.92,68610.19583.61,9107.24,64817.56562.55852.22100.8
    North Ayrshire 35.6%15,49341.66,52417.52,9347.93,76610.12,0935.64,66212.58202.27342.02260.6
    North Lanarkshire 33.6%38,23245.411,78914.05,8466.913,82016.44,3305.16,5617.81,7302.11,4831.83920.5
    Perth and Kinross 45.9%18,11635.88,08816.07,35014.51,5183.03,6987.39,85619.57701.58891.82640.6
    Renfrewshire 40.3%21,87041.67,18913.75,66010.86,97613.33,5456.74,9419.49911.91,0902.13300.5
    Scottish Borders 43.0%10,76128.37,18818.96,90018.11,0592.82,9977.97,15218.86711.87301.94081.1
    Stirling 46.7%11,78038.33,77412.34,64515.11,9156.22,9379.64,64315.14011.35581.8930.3
    South Lanarkshire 37.6%37,55240.713,81815.09,75110.611,54312.55,8156.39,83810.71,6681.81,8192.04720.4
    South Ayrshire 40.8%12,25434.26,19917.33,76310.52,6097.32,0645.87,33420.56871.97202.02190.6
    West Dunbartonshire 35.7%10,67045.53,24013.81,7067.33,74816.01,5546.61,4846.34862.14171.81380.6
    West Lothian 38.5%20,13239.98,27816.45,51010.95,82611.63,5127.04,6099.11,1432.31,1302.22900.6
    Na h-Eileanan Siar (Western Isles) 39.3%3,60643.71,64019.96117.48149.85817.06117.41892.31301.6280.3
    Orkney 38.3%1,54824.21,03516.22,14433.52043.272411.34997.81572.5751.2210.1
    Shetland 39.6%1,75125.91,33019.72,00129.63054.575611.23425.11512.2821.2320.5

    Best and worst results for each party

    BrexitLiberal DemocratLabourGreenConservativeSNP
    Local authority%Local authority%Local authority%Local authority%Local authority%Local authority%
    Best1 Dumfries and Galloway 21.9 Orkney 33.5 North Lanarkshire 16.4 City of Edinburgh 13.8 Dumfries and Galloway 21.1 Dundee City 46.1
    2 Moray 21.9 Shetland 29.6 West Dunbartonshire 16.0 Glasgow City 12.1 South Ayrshire 20.5 West Dunbartonshire 45.5
    3 Na h-Eileanan Siar (Western Isles) 19.9 East Dunbartonshire 24.8 Glasgow City 15.0 Orkney 11.3 Perth and Kinross 19.5 North Lanarkshire 45.4
    4 Aberdeenshire 19.8 City of Edinburgh 22.9 Inverclyde 14.7 Shetland 11.2 Scottish Borders 18.8 Glasgow City 43.9
    5 Shetland 19.7 Scottish Borders 18.1 Renfrewshire 13.3 Stirling 9.6 Aberdeenshire 18.0 Na h-Eileanan Siar 43.7
    6 Scottish Borders 18.9 Highland 17.4 East Ayrshire 13.0 East Lothian 9.2 East Renfrewshire 17.5 Falkirk 43.0
    7 Angus 18.7 Aberdeen City 16.9 South Lanarkshire 12.5 Highland 9.2 Moray 17.5 Inverclyde 41.9
    8 Highland 18.0 Aberdeenshire 16.9 Midlothian 12.4 Midlothian 9.0 Angus 17.2 Renfrewshire 41.6
    9 Argyll and Bute 17.9 Fife 16.5 East Lothian 11.8 East Dunbartonshire 8.0 Stirling 15.1 North Ayrshire 41.6
    10 North Ayrshire 17.5 Argyll and Bute 16.4 West Lothian 11.6 Scottish Borders 7.9 East Lothian 13.8 East Ayrshire 41.1
    Worst1 City of Edinburgh 9.4 North Lanarkshire 6.9 Scottish Borders 2.8 North Lanarkshire 5.1 Shetland 5.1 Orkney 24.2
    2 Glasgow City 9.8 West Dunbartonshire 7.3 Perth and Kinross 3.0 Inverclyde 5.2 Glasgow City 6.2 Shetland 25.9
    3 East Renfrewshire 11.9 Na h-Eileanan Siar (Western Isles) 7.4 Aberdeenshire 3.0 East Ayrshire 5.5 West Dunbartonshire 6.3 Dumfries and Galloway 27.8
    4 East Dunbartonshire 12.3 North Ayrshire 7.9 Orkney 3.2 North Ayrshire 5.6 Na h-Eileanan Siar (Western Isles) 7.4 Scottish Borders 28.3
    5 Stirling 12.3 East Ayrshire 8.0 Moray 3.6 South Ayrshire 5.8 North Lanarkshire 7.8 Aberdeenshire 31.4
    6 East Lothian 13.3 Falkirk 9.1 Argyll and Bute 3.9 Angus 6.0 Orkney 7.8 East Lothian 32.6
    7 Renfrewshire 13.7 Glasgow City 9.2 Highland 4.0 Aberdeenshire 6.2 Dundee City 8.1 City of Edinburgh 33.3
    8 West Dunbartonshire 13.8 Dundee City 9.3 Angus 4.3 South Lanarkshire 6.3 Midlothian 9.1 East Renfrewshire 33.6
    9 Dundee City 14.0 Clackmannanshire 9.7 Shetland 4.5 Falkirk 6.5 West Lothian 9.1 Moray 34.1
    10 North Lanarkshire 14.0 Dumfries and Galloway 10.0 Stirling 6.2 West Dunbartonshire 6.6 Falkirk 9.3 South Ayrshire 34.2
    Change UKUKIP
    Local authority%Local authority%
    Best1 East Renfrewshire 3.0 Dumfries and Galloway 2.7
    2 Falkirk 2.5 Moray 2.5
    3 Aberdeen City 2.4 Orkney 2.5
    4 Midlothian 2.3 Na h-Eileanan Siar (Western Isles) 2.3
    5 Moray 2.2 West Lothian 2.3
    6 West Lothian 2.2 Aberdeenshire 2.2
    7 Aberdeenshire 2.1 East Ayrshire 2.2
    8 Renfrewshire 2.1 Falkirk 2.2
    9 Dumfries and Galloway 2.0 North Ayrshire 2.2
    10 East Ayrshire 2.0 Shetland 2.2
    Worst1 Orkney 1.2 City of Edinburgh 1.1
    2 Shetland 1.2 East Dunbartonshire 1.2
    3 Dundee City 1.5 East Renfrewshire 1.2
    4 Clackmannanshire 1.6 Stirling 1.3
    5 Glasgow City 1.6 Perth and Kinross 1.5
    6 Highland 1.6 East Lothian 1.6
    7 Na h-Eileanan Siar (Western Isles) 1.6 Glasgow City 1.6
    8 Argyll and Bute 1.7 Dundee City 1.7
    9 Fife 1.7 Inverclyde 1.7
    10 East Dunbartonshire 1.8 Aberdeen City 1.8

    Wales (4 seats)

    Map showing highest polling party by counting area in the Wales electoral region. 2019 European Parliament election in the United Kingdom area results (Wales).svg
    Map showing highest polling party by counting area in the Wales electoral region.

    [140]

    European Election 2019: Wales
    ListCandidatesVotes%±
    Brexit Party Nathan Gill, James Wells
    Gethin James, Julie Price
    271,404
    (135,702)
    32.5N/A
    Plaid Cymru Jill Evans
    Carmen Smith, Patrick McGuinness, Ioan Bellin
    163,92819.6+4.3
    Labour Jacqueline Jones
    Matthew Dorrance, Mary Wimbury, Mark Whitcott
    127,83315.3-12.9
    Liberal Democrats Sam Bennett, Donna Lalek, Alistair Cameron, Andrew Parkhurst113,88513.6+9.7
    Conservative Daniel Boucher, Craig Lawton, Fay Jones, Tomos Davies54,5876.5-10.9
    Green Anthony Slaughter, Ian Chandler, Ceri Davies, Duncan Rees52,6606.3+1.8
    UKIP Kristian Hicks, Keith Edwards, Thomas Harrison, Robert McNeil-Wilson27,5663.3-24.3
    Change UK Jon Owen Jones, June Davies, Matthew Paul, Sally Anne Stephenson24,3322.9N/A
    Turnout 836,19537.1+5.6

    The Wales electoral region is broken down into 22 local council areas.

    DistrictTurnoutPlaidBrexitLib DemLabourGreenConservativeUKIPChange UKLead
    #%# %# %# %# %# %#%#%#%#%
    Anglesey [141] 20,57640.7%7.14434.76,79133.01,6037.81,8909.29414.61,1575.66683.23821.91.7%
    Blaenau Gwent [142] 15,18530.4% [143] 2,07213.65,99539.51,0587.03,67924.26464.34543.08065.34753.215.3%
    Bridgend [144] 34,46532.6%5,21915.112,31835.74,07111.86,35518.41,8955.52,1116.11,2613.71,2353.617.3%
    Caerphilly [145] 42,38732.9%7,54817.815,80837.33,7959.08,35419.72,3025.41,5523.71,8464.41,1822.817.7%
    Cardiff [146] 99,36842%20,04720.221,07721.220,79920.917,29717.48,4058.56,3936.42,1642.23,2043.20.3%
    Carmarthenshire [147] 57,82341.8%18,04031.219,00432.94,5988.07,26312.62,8534.92,8394.91,8553.21,3712.41.7%
    Ceredigion [148] 23,96545.7% [149] 8,90837.26,47127.03,91516.31,2315.11,6386.88963.75782.43281.410.2%
    Conwy [150] 33,88238.6% [151] 6,78420.012,13135.84,44213.13,43910.11,9765.83,0018.91,1683.49412.815.8%
    Denbighshire [152] 26,98237%4,91018.29,16834.03,33512.43,68213.61,6546.12,5729.59613.67002.615.8%
    Flintshire [153] 41,08935.7%4,39610.715,61338.05,94414.56,42815.62,5796.33,2607.91,4833.61,3863.422.4%
    Gwynedd [154] 35,44043.1% 18,00950.87,88622.32,2446.32,7617.81,8265.21,3353.88662.45131.428.5%
    Merthyr Tydfil [155] 12,61029% [156] 2,02316.04,40734.91,0908.63,23525.73903.13733.06114.84813.89.2%
    Monmouthshire [157] 30,20143.6%3,26410.89,97833.06,18320.52,5958.62,8089.33,43111.48022.71,1403.812.5%
    Neath Port Talbot [158] 37,24435.5%7,12419.112,07532.43,2628.88,77623.61,7574.71,3903.71,5604.21,3003.58.8%
    Newport [159] 34,49332.1%3,2779.512,27035.64,82114.06,93420.12,1726.32,7548.01,2003.51,0653.115.5%
    Pembrokeshire [160] 36,09139.5%5,63115.613,76838.14,40812.24,03611.22,5437.03,61510.01,2223.48682.422.5%
    Powys [161] 42,28342.5%5,17712.214,93235.310,06923.83,1197.42,9627.03,8189.01,3843.38221.911.5%
    Rhondda Cynon Taf [162] 54,28532.2%11,88321.918,32333.84,4968.311,42821.12,7375.01,9223.52,0043.71,4922.711.9%
    Swansea [163] 62,07836.0%9,28115.019,65031.79,90816.011,46318.54,1626.73,8276.21,9293.11,8583.013.2%
    Torfaen [164] 23,20633.7%2,53310.99,08839.22,70111.64,30318.51,3255.71,4596.31,0024.37953.421.0%
    Vale of Glamorgan [165] 39,89741.6% [166] 6,08615.312,57331.56,80017.04,57711.53,2798.23,9579.91,1442.91,4813.714.5%
    Wrexham [167] 32,62734%4,57214.012,07837.04,34313.34,98815.31,8105.52,4717.61,0523.21,3134.121.7%

    Estimated results by Westminster constituency

    PartiesSeats
    Brexit Party 414
    Liberal Democrats 74
    Labour Party 67
    Scottish National Party 54
    Plaid Cymru 10
    Green Party 10
    Conservative Party 1
    Others18
    Brexit Party majority of 180

    Related Research Articles

    <span class="mw-page-title-main">Bethnal Green and Bow (UK Parliament constituency)</span> UK Parliament constituency in England since 1997

    Bethnal Green and Bow is a constituency in Greater London, represented in the House of Commons of the UK Parliament since 2010 by Rushanara Ali of the Labour Party.

    <span class="mw-page-title-main">Blaydon (UK Parliament constituency)</span> Parliamentary constituency in the United Kingdom since 1918

    Blaydon is a constituency represented in the House of Commons since 2017 by Liz Twist of the Labour Party.

    <span class="mw-page-title-main">Reading West (UK Parliament constituency)</span> Parliamentary constituency in the United Kingdom, 1983 onwards

    Reading West is a constituency represented in the House of Commons of the UK Parliament since 2010 by Alok Sharma, a Conservative.

    <span class="mw-page-title-main">Islington South and Finsbury (UK Parliament constituency)</span> Parliamentary constituency in the United Kingdom, 1974 onwards

    Islington South and Finsbury is a constituency created in 1974 and represented in the House of Commons of the UK Parliament since 2005 by Emily Thornberry of the Labour Party. Thornberry served as Shadow Foreign Secretary from 2016 until 2020 and is currently Shadow Attorney General for England and Wales.

    <span class="mw-page-title-main">East Ham (UK Parliament constituency)</span> UK Parliament constituency since 1997

    East Ham is a constituency in the London Borough of Newham represented in the House of Commons of the UK Parliament since its creation in 1997 by Stephen Timms of the Labour Party.

    <span class="mw-page-title-main">Birmingham Erdington (UK Parliament constituency)</span> Parliamentary constituency in the United Kingdom, 1974 onwards

    Birmingham Erdington is a parliamentary constituency in Birmingham, England, represented in the House of Commons of the Parliament of the United Kingdom since 2022 by Paulette Hamilton of the Labour Party.

    <span class="mw-page-title-main">Mid Bedfordshire (UK Parliament constituency)</span> Parliamentary constituency in the United Kingdom, 1918 onwards

    Mid Bedfordshire is a constituency represented in the House of Commons of the UK Parliament by Alistair Strathern of the Labour Party since a 2023 by-election.

    <span class="mw-page-title-main">Croydon South (UK Parliament constituency)</span> UK Parliament constituency since 1974

    Croydon South is a constituency created in 1974 and represented in the House of Commons of the UK Parliament since 2015 by Chris Philp, a Conservative.

    <span class="mw-page-title-main">Kingston and Surbiton (UK Parliament constituency)</span> Parliamentary constituency in the United Kingdom, 1997 onwards

    Kingston and Surbiton is a constituency in Greater London created in 1997 and represented in the House of Commons of the UK Parliament since 2017 by Ed Davey, the Leader of the Liberal Democrats. Davey previously held the seat from 1997 until losing reelection in 2015 to Conservative James Berry.

    <span class="mw-page-title-main">Sutton and Cheam (UK Parliament constituency)</span> Parliamentary constituency in the United Kingdom, 1945 onwards

    Sutton and Cheam is a constituency in Greater London represented in the House of Commons of the UK Parliament since 2015 by Paul Scully, a Conservative.

    <span class="mw-page-title-main">Ealing Central and Acton (UK Parliament constituency)</span> UK Parliament constituency since 2010

    Ealing Central and Acton is a constituency created in 2010, represented in the House of Commons of the UK Parliament since 2015 by Rupa Huq, who was elected as a Labour MP, suspended from the party in September 2022 following alleged racist comments, and reinstated in March 2023.

    <span class="mw-page-title-main">Poplar and Limehouse (UK Parliament constituency)</span> Constituency represented in the UK Parliament

    Poplar and Limehouse is a constituency created in 2010 and represented in the House of Commons of the UK Parliament since 2019 by Apsana Begum of the Labour Party. From its creation until 2019, it was represented by Jim Fitzpatrick, also of Labour.

    <span class="mw-page-title-main">Uxbridge and South Ruislip (UK Parliament constituency)</span> Parliamentary constituency in the United Kingdom, 2010 onwards

    Uxbridge and South Ruislip is a constituency in Greater London represented in the House of Commons of the UK Parliament since its 2010 creation. The seat has been held by Steve Tuckwell of the Conservative Party with a majority of 495 since a by-election on 20 July 2023. The seat's previous holder, former Prime Minister (2019–2022) Boris Johnson, also of the Conservative Party, had formally resigned after receiving a copy of the Standard Committee's report into Partygate, which recommended a recall petition.

    This article lists the British National Party's election results in the UK parliamentary, Scottish parliamentary and Welsh Assembly elections, as well as in the European Parliament elections and at a local level.

    Janani (Jan) Jananayagam is a British Tamil banking professional, activist and politician. She was an independent candidate for the London region in the 2009 European Parliamentary elections.

    <span class="mw-page-title-main">Results of the 2011 United Kingdom Alternative Vote referendum</span>

    In the United Kingdom, the Alternative Vote referendum also known as the UK-wide referendum on the Parliamentary voting system was a referendum that took place on 5 May 2011, on whether to change the system for electing the House of Commons, the lower house of the national Parliament at Westminster. In the result of a Yes vote, future United Kingdom general elections would have used the "Alternative Vote" (AV); in the event of a No vote, the voting system would remain the same, with the UK continuing to use the "First Past the Post" (FPTP) voting system. The votes cast in the referendum were first counted in each of 440 districts or electoral divisions across the country, which were then combined and declared at a regional level.

    <span class="mw-page-title-main">2012 England and Wales police and crime commissioner elections</span> Local elections in England and Wales

    The 2012 police and crime commissioner elections were polls held in most police areas in England and Wales on Thursday 15 November. The direct election of police and crime commissioners (PCCs) was originally scheduled for May 2012 but was postponed in order to secure the passage of the Police Reform and Social Responsibility Act 2011 through the House of Lords. The government considers the elected commissioners to have a stronger mandate than the "unelected and invisible police authorities that they replace". The elections took place alongside by-elections for the House of Commons in Cardiff South and Penarth, Corby and Manchester Central, and a mayoral election in Bristol.

    <span class="mw-page-title-main">2014 European Parliament election in the United Kingdom</span> Election

    The 2014 European Parliament election was the United Kingdom's component of the 2014 European Parliament election, held on Thursday 22 May 2014, coinciding with the 2014 local elections in England and Northern Ireland. In total, 73 Members of the European Parliament were elected from the United Kingdom using proportional representation. England, Scotland and Wales use a closed-list party list system of PR, while Northern Ireland used the single transferable vote (STV).

    <span class="mw-page-title-main">Results of the 2016 United Kingdom European Union membership referendum</span>

    The 2016 United Kingdom European Union membership referendum took place in the United Kingdom and Gibraltar on 23 June 2016. Membership of the European Union had been a topic of political debate in the United Kingdom since the country joined the European Communities in 1973. This referendum was conducted very differently from the European Communities membership referendum in 1975; a more localised and regionalised counting procedure was used, and the ballot was overseen by the Electoral Commission, a public body which did not exist at the time of the first vote. This article lists, by voting area for Great Britain and Gibraltar and by parliamentary constituency for Northern Ireland, all the results of the referendum, each ordered into national and regional sections.

    <span class="mw-page-title-main">2021 Hertfordshire County Council election</span>

    Elections to Hertfordshire County Council took place on 6 May 2021 alongside other local elections in the United Kingdom. All 78 seats to the council were elected.

    References

    1. "Ministers set for further Brexit talks". BBC News. 8 April 2019.
    2. "Why Scots must wait longer than rest of the UK for EU election results". The National. 22 May 2019.
    3. "Why do votes take so long to count in Northern Ireland?". BBC News. 26 May 2019.
    4. "The UK's European elections 2019". BBC News. 27 May 2019.
    5. Council, Northampton Borough. "Statement of Persons Nominated - European Parliamentary Election on 23 May 2019 | Northampton Borough Council". www.northampton.gov.uk. Archived from the original on 26 April 2019. Retrieved 26 April 2019.
    6. East Midlands regional results, composite. Excel file available on request from Kettering Borough Electoral Services
    7. "Candidates for European election". Chelmsford City Council. Archived from the original on 26 April 2019. Retrieved 26 April 2019.
    8. "European election results 2019. The count and declaration of results. We can announce that for the whole of the Eastern region". Chelmsford City Council. Archived from the original on 19 June 2019. Retrieved 2 June 2019.
    9. "EU election results May 2019-4". Chelmsford City Council. Archived from the original on 2 June 2019. Retrieved 2 June 2019.
    10. "European election results 2019. The count and declaration of results. We can announce that for the whole of the Eastern region". Chelmsford City Council. Archived from the original on 19 June 2019. Retrieved 2 June 2019. (Click on each borough for the percentage turnout.)
    11. 1 2 "European Election 2019: UK results in maps and charts | BBC News". BBC News. 26 May 2019. Retrieved 27 May 2019.
    12. "European election 2019 – London-wide results". London Borough of Lewisham. Retrieved 1 June 2019.
    13. "European election 2019 – London-wide results: Results by local authority". London Borough of Lewisham. Retrieved 6 June 2019.
    14. "European Parliamentary Elections". London Borough of Barking and Dagenham. Archived from the original on 3 May 2019. Retrieved 31 May 2019.
    15. "Barnet Electoral Services - European Parliamentary elections 2019" (PDF). admin.barnet.gov.uk. Retrieved 27 May 2019.
    16. "European Parliamentary Election 2019 – results". London Borough of Barnet. 26 May 2019. Retrieved 29 May 2019.
    17. "Results of European elections - 23 May 2019". London Borough of Bexley. Archived from the original on 31 May 2019. Retrieved 31 May 2019.
    18. "European Parliamentary elections 2019" (PDF). London Borough of Brent. Retrieved 31 May 2019.
    19. "European Parliamentary elections 2019" (PDF). London Borough of Brent. Retrieved 31 May 2019.
    20. "European Parliamentary Elections 2019". London Borough of Bromley. Archived from the original on 31 May 2019. Retrieved 31 May 2019.
    21. "European Parliamentary Election 2019". London Borough of Camden. Retrieved 31 May 2019.
    22. "European Parliamentary Elections 2019". London Borough of Camden. Retrieved 31 May 2019.
    23. "European Parliamentary Election 2019" (PDF). City of London. Retrieved 31 May 2019.[ permanent dead link ]
    24. "European Parliamentary Elections 2019" (PDF). London Borough of Croydon. Retrieved 31 May 2019.
    25. "European parliamentary results 23 May 2019: Results for the borough of Ealing". London Borough of Ealing. Retrieved 31 May 2019.
    26. "European Election Results 2019". London Borough of Enfield. Retrieved 31 May 2019.
    27. "MEP election results for the Royal Borough of Greenwich". Royal Borough of Greenwich. Retrieved 31 May 2019.
    28. "European Election Results 2019: Results for the Borough of Hackney". London Borough of Hackney. Retrieved 31 May 2019.
    29. "2019 European Parliamentary election: Hammersmith & Fulham result". London Borough of Hammersmith and Fulham. 15 April 2019. Retrieved 31 May 2019.
    30. "European Election Results 2019: How did Haringey vote?". London Borough of Haringey. Retrieved 31 May 2019.
    31. "European Parliamentary Election - Thursday 23 May 2019". London Borough of Harrow. Retrieved 31 May 2019.
    32. "2019 European Parliamentary Election results". London Borough of Havering. Retrieved 31 May 2019.
    33. "London Borough of Hillingdon - European Parliament elections 2019". www.hillingdon.gov.uk. Archived from the original on 27 May 2019. Retrieved 27 May 2019.
    34. "The UK's results in maps and charts". 27 May 2019. Retrieved 27 May 2019.
    35. "European Parliamentary Elections". London Borough of Hounslow. Retrieved 31 May 2019.
    36. "European Parliamentary elections, 2019". London Borough of Islington. Archived from the original on 1 June 2019. Retrieved 1 June 2019.
    37. "European Election 2019". Royal Borough of Kensington and Chelsea. Archived from the original on 1 June 2019. Retrieved 1 June 2019.
    38. "2019 European Parliamentary Election Results". Royal Borough of Kingston upon Thames. Archived from the original on 3 June 2019. Retrieved 3 June 2019.
    39. "Election results for Lambeth: European Parliamentary Elections - Thursday 23 May 2019". London Borough of Lambeth. 23 May 2019. Retrieved 1 June 2019.
    40. "European election 2019 – Lewisham results". London Borough of Lewisham. Retrieved 1 June 2019.
    41. "Election results for Merton Counting Area: European Parliamentary Election - Thursday 23 May 2019". London Borough of Merton. 23 May 2019. Retrieved 1 June 2019.
    42. "EUROPEAN PARLIAMENTARY ELECTIONS 2019 LONDON REGION: STATEMENT OF LOCAL TOTALS" (PDF). London Borough of Newham. Archived from the original (PDF) on 19 December 2019. Retrieved 1 June 2019.
    43. "European Parliamentary Election 2019 - results: Results for the London Borough of Redbridge". London Borough of Redbridge. Archived from the original on 1 June 2019. Retrieved 1 June 2019.
    44. "EUROPEAN PARLIAMENTARY ELECTIONS 2019 LONDON REGION: STATEMENT OF LOCAL TOTALS" (PDF). London Borough of Richmond upon Thames. Retrieved 1 June 2019.
    45. "European Parliamentary elections: Election results". London Borough of Southwark. Archived from the original on 1 June 2019. Retrieved 1 June 2019.
    46. "European Parliamentary Election - Local Result - Sutton". London Borough of Sutton. Retrieved 1 June 2019.
    47. "London Region - Statement of local totals" (PDF). Tower Hamlets. Retrieved 30 May 2019.
    48. "European Parliamentary Elections, 23 May 2019: Waltham Forest results". London Borough of Waltham Forest. Archived from the original on 1 June 2019. Retrieved 1 June 2019.
    49. "2019 European Parliamentary election results - 23 May: Notice of result London Region - Wandsworth counting area". London Borough of Wandsworth. Archived from the original on 1 June 2019. Retrieved 1 June 2019.
    50. "European Parliamentary Elections 2019" (PDF). City of Westminster. Retrieved 31 May 2019.
    51. "Verification statement" (PDF). City of Westminster. Retrieved 31 May 2019.
    52. "European elections 2019 results: How every North East area voted in full | The Chronicle". chroniclelive.co.uk. 26 May 2019. Retrieved 27 May 2019.
    53. "North West Votes – Candidates". www.northwestvotes.gov.uk. Retrieved 12 May 2019.
    54. "European Parliamentary Elections: North West Region Results 23 May 2019". North West Votes. Retrieved 5 June 2019.
    55. "Statement of Parties and Individual Candidates Nominated - Notice of Poll - 23 May 2019" (PDF). Archived from the original (PDF) on 27 April 2019. Retrieved 27 April 2019.
    56. "All the South East results from the European Parliamentary Elections". southampton.gov.uk. Southampton City Council. 27 May 2019. Archived from the original on 27 May 2019. Retrieved 27 May 2019.
    57. 1 2 "Election results 2019". Adur & Worthing Councils. 26 May 2019. Retrieved 8 June 2019.
    58. Lynn, Nigel (26 May 2019). "European Parliamentary Election on Thursday 23 May 2019 Result of poll for the Arun local counting area". Arun District Council. Retrieved 8 June 2019.
    59. Kerly, Tracey (26 May 2019). "European Parliamentary Election on Thursday 23 May 2019 Result of poll for the local counting area of Ashford Borough Council" (PDF). Ashford Borough Council. Archived from the original (PDF) on 8 June 2019. Retrieved 8 June 2019.
    60. Grant, Andrew (26 May 2019). "European Parliamentary Election South East Region – Aylesbury Vale District Council Local Counting Area 23 May 2019" (PDF). Aylesbury Vale District Council. Archived from the original (PDF) on 29 May 2019. Retrieved 29 May 2019.
    61. "European Parliamentary Election - South East Region". Basingstoke and Deane. 26 May 2019. Retrieved 29 May 2019.
    62. "European Parliamentary Election (Bracknell Forest Voting) - Thursday, 23 May 2019". Bracknell Forest Council. 26 May 2019. Retrieved 29 May 2019.
    63. "European Parliament elections results 2019". Brighton & Hove City Council. 26 May 2019. Retrieved 31 May 2019.
    64. Carmichael, Colin (26 May 2019). "European Parliamentary Election South East Region Canterbury City Council Local Counting Area Date of Election:23 May 2019" (PDF). Canterbury City Council. Archived from the original (PDF) on 8 June 2019. Retrieved 8 June 2019.
    65. Rees, Yvonne (26 May 2019). "European Parliamentary Election Thursday 23rd May 2019 Cherwell counting area of the South East Region Statement of Votes given for each Registered Party and Individual Candidate" (PDF). Cherwell District Council. Archived from the original (PDF) on 28 May 2019. Retrieved 28 May 2019.
    66. Shepherd, Diane (26 May 2019). "European Parliamentary Election on Thursday 23 May 2019 Result of poll for the Chichester local counting area of the South East". Chichester District Council. Archived from the original on 22 December 2019. Retrieved 8 June 2019.
    67. "Chiltern Local Count Results for the European Parliament Election 2019" (PDF). Chiltern District Council. 27 May 2019. Retrieved 27 May 2019.
    68. Brahma-Pearl, Natalie (26 May 2019). "European Parliamentary Election on Thursday 23 May 2019 Result of poll for the local counting area of Crawley" (PDF). Crawley Borough Council. Retrieved 8 June 2019.
    69. "European Elections 2019 Form Results South East Region Declaration of Count Totals South East: Dartford" (PDF). Dartford Borough Council. 26 May 2019. Archived from the original (PDF) on 8 June 2019. Retrieved 8 June 2019.
    70. Nadeem Aziz (26 May 2019). "European Parliamentary Election on Thursday 23 May 2019 Result of poll for the local counting area of South East Region" (PDF). Dover District Council. Retrieved 8 June 2019.
    71. "European Parliamentary Election Result of Poll South East Electoral Region Eastbourne Local Count Election held on 23 May 2019" (PDF). Lewes and Eastbourne Councils. 26 May 2019. Archived from the original (PDF) on 8 June 2019. Retrieved 8 June 2019.
    72. "European Elections 2019 South East Region Eastleigh local counting area result" (PDF). Eastleigh Borough Council. 26 May 2019. Retrieved 1 June 2019.
    73. Morrison, Lydia (26 May 2019). "European Parliamentary Election on Thursday 23 May 2019 Result of poll for the local counting area of East Hampshire District Council". East Hampshire District Council. Retrieved 30 May 2019.[ permanent dead link ]
    74. "2019 European Election - Thursday, 23rd May, 2019". Elmbridge Borough Council. 26 May 2019. Retrieved 5 June 2019.
    75. Beldon, Kathryn (26 May 2019). "European Parliamentary Election South East Region Date of poll: Thursday 23 May 2019 Local Counting Area: Epsom & Ewell Borough Council" (PDF). Epsom & Ewell Borough Council. Retrieved 7 June 2019.
    76. "European Elections 2019 South East Region Regional Returning Officer (South East Region) Local Authority Fareham Borough Council Count Total" (PDF). Fareham Borough Council. 26 May 2019. Retrieved 31 May 2019.
    77. Priest, S. (26 May 2019). "European Parliamentary Election on Thursday 23 May 2019 Result of poll for the local counting area of South East Region" (PDF). Folkestone & Hythe District Council. Archived from the original (PDF) on 8 June 2019. Retrieved 8 June 2019.
    78. "Election results for Gosport Counting Area". Gosport Borough Council. 26 May 2019. Retrieved 31 May 2019.
    79. "Election results". Gravesham Borough Council. 26 May 2019. Retrieved 8 June 2019.
    80. Whiteman, James (26 May 2019). "European Parliamentary Election South East Region – Guildford Borough Council Local Counting Area Date of Election: 23 May 2019" (PDF). Guildford Borough Council. Retrieved 5 June 2019.
    81. "European Elections 2019 Form SE6 South East Region Local Authority Hart Count Total" (PDF). Hart District Council. 26 May 2019. Archived from the original (PDF) on 18 December 2019. Retrieved 30 May 2019.
    82. "Hastings European Parliamentary Election - Thursday, 23rd May, 2019". Hastings Borough Council. 26 May 2019. Retrieved 8 June 2019.
    83. Leach, Nick (26 May 2019). "European Elections 2019 South East Region Local Authority Havant Borough Count Total" (PDF). Havant Borough Council. Retrieved 31 May 2019.
    84. Chipp, Glen (26 May 2019). "European Parliamentary Election on Thursday 23 May 2019 Result of poll for the local counting area of Horsham" (PDF). Horsham District Council. Archived from the original (PDF) on 8 June 2019. Retrieved 8 June 2019.
    85. Shand, Claire (26 May 2019). "European Parliamentary Election South East Region - Isle of Wight Local Counting Area Date of Election: 23 May 2019". Isle of Wight Council. Retrieved 1 June 2019.
    86. "European Parliamentary Election Result of Poll South East Electoral Region Lewes Local Count Election held on 23 May 2019" (PDF). Lewes and Eastbourne Councils. 26 May 2019. Archived from the original (PDF) on 8 June 2019. Retrieved 8 June 2019.
    87. "Upcoming Elections and Results". Maidstone Borough Council. 26 May 2019. Retrieved 8 June 2019.
    88. "European Parliamentary Election 2019 results". medway.gov.uk. Medway Council. 27 May 2019. Retrieved 27 May 2019.
    89. Clark, Tom (26 May 2019). "European Parliamentary Election on Thursday 23 May 2019 Result of poll for the local counting area of Mid Sussex" (PDF). Mid Sussex District Council. Retrieved 8 June 2019.
    90. "Results Milton Keynes Council" (PDF). Milton Keynes Council. 26 May 2019. Archived from the original (PDF) on 17 December 2019. Retrieved 29 May 2019.
    91. "European Parliamentary Election 2019 - Mole Valley Results". Mole Valley District Council. 26 May 2019. Archived from the original on 19 December 2019. Retrieved 7 June 2019.
    92. Jackson, Robert (26 May 2019). "European Parliamentary Election on Thursday 23 May 2019 Result of poll for the local counting area of New Forest for the South East Region". New Forest District Council. Archived from the original on 17 December 2019. Retrieved 29 May 2019.
    93. "European Parliamentary Election Result - May 2019". Oxford City Council. 26 May 2019. Retrieved 29 May 2019.
    94. Williams, David (26 May 2019). "European Elections 2019 Form SE6 South East Region Local Authority Portsmouth Count Total" (PDF). Portsmouth City Council. Archived from the original (PDF) on 31 May 2019. Retrieved 31 May 2019.
    95. "European Parliamentary Election 2019" (PDF). Reading Borough Council. 26 May 2019. Archived from the original (PDF) on 29 May 2019. Retrieved 29 May 2019.
    96. "European Parliamentary Elections". Reigate & Banstead Borough Council. 26 May 2019. Archived from the original on 7 June 2019. Retrieved 7 June 2019.
    97. Johnston, Malcolm (26 May 2019). "European Parliamentary Election on Thursday 23 May 2019 Result of poll for the local counting area of South East Region". Rother District Council. Archived from the original on 19 December 2019. Retrieved 8 June 2019.
    98. "European Elections 2019 Form SE6 South East Region Local Authority Runnymede Count Total" (PDF). Runnymede Borough Council. 26 May 2019. Archived from the original (PDF) on 5 June 2019. Retrieved 5 June 2019.
    99. "European Parliamentary elections". Rushmoor Borough Council. 26 May 2019. Archived from the original on 30 May 2019. Retrieved 30 May 2019.
    100. Ramewal, Pav (26 May 2019). "European Parliamentary Election (South East Region) 2019 Local Counting Area :Sevenoaks District Council" (PDF). Sevenoaks District Council. Archived from the original (PDF) on 8 June 2019. Retrieved 8 June 2019.
    101. "2019 European Parliamentary Elections". Slough Borough Council. 26 May 2019. Archived from the original on 29 May 2019. Retrieved 29 May 2019.
    102. Heath, Mark (26 May 2019). "European Parliamentary Election South East Region of England Southampton City Council Local Counting Area 23rd May 2019" (PDF). Southampton City Council. Archived from the original (PDF) on 29 May 2019. Retrieved 29 May 2019.
    103. "South Bucks Local Count Result for the European Parliament Election 2019" (PDF). South Bucks District Council. 27 May 2019. Retrieved 27 May 2019.
    104. Reed, Margaret (26 May 2019). "European parliamentary elections". South Oxfordshire District Council. Retrieved 28 May 2019.
    105. "European Election results - 23 May 2019". Spelthorne Borough Council. 26 May 2019. Retrieved 5 June 2019.
    106. "European Parliamentary Elections - 23 May 2019". Surrey Heath Borough Council. 26 May 2019. Archived from the original on 5 June 2019. Retrieved 5 June 2019.
    107. "23 May European Union (EU) election results". Swale Borough Council. 26 May 2019. Archived from the original on 8 June 2019. Retrieved 8 June 2019.
    108. "European Elections 2019 Form SE6 South East Region Local Authority Tandridge Count Total" (PDF). Tandridge District Council. 26 May 2019. Retrieved 7 June 2019.
    109. Tetstall, Roger (26 May 2019). "European Parliamentary Election on Thursday 23 May 2019 Result of poll for the local counting area of Test Valley" (PDF). Test Valley Borough Council. Archived from the original (PDF) on 22 December 2019. Retrieved 29 May 2019.
    110. "European Election Results". Thanet District Council. 26 May 2019. Retrieved 8 June 2019.
    111. Beilby, Julie (26 May 2019). "European Elections Declaration of result of Poll" (PDF). Tonbridge & Malling Borough Council. Archived from the original (PDF) on 8 June 2019. Retrieved 8 June 2019.
    112. Benson, William (26 May 2019). "Date of Election: Thursday 23 May 2019" (PDF). Tunbridge Wells Borough Council. Archived from the original (PDF) on 8 June 2019. Retrieved 8 June 2019.
    113. Reed, Margaret (26 May 2019). "European parliamentary elections". Vale of White Horse District Council. Retrieved 28 May 2019.
    114. Horwood, Tom (28 May 2019). "European Parliamentary Election on Thursday 23 May 2019 Result of poll for the local counting area of Borough of Waverley Borough Council" (PDF). Waverley Borough Council. Archived from the original (PDF) on 5 June 2019. Retrieved 5 June 2019.
    115. Scott, Trevor (26 May 2019). "European Parliamentary Election on Thursday 23 May 2019 Result of poll for the local counting area of Wealden". Wealden District Council. Retrieved 8 June 2019.
    116. Carter, Nick (28 May 2019). "European Parliamentary Election on Thursday 23 May 2019 Result of poll for the local counting area of West Berkshire". West Berkshire Council. Retrieved 31 May 2019.
    117. Butler, Keith (26 May 2019). "European Parliamentary Election South East Region – West Oxfordshire Local Counting Area Date of Election: 23 May 2019" (PDF). West Oxfordshire District Council. Archived from the original (PDF) on 28 May 2019. Retrieved 28 May 2019.
    118. "European Parliamentary elections - 23 May 2019". Winchester City Council. 25 June 2019. Archived from the original on 5 July 2019. Retrieved 5 July 2019.
    119. "European Parliament Election Results". Royal Borough of Windsor and Maidenhead. 26 May 2019. Retrieved 29 May 2019.
    120. "European elections 2019: local results". Woking Borough Council. 26 May 2019. Retrieved 27 May 2019.
    121. Moulton, A.J. (26 May 2019). "European Elections 2019 Form SE6 South East Region Local Authority Wokingham Count Total". Wokingham Borough Council. Retrieved 29 May 2019.[ permanent dead link ]
    122. "European Parliamentary Elections". Wycombe District Council. 26 May 2019. Retrieved 29 May 2019.
    123. Farrant, Graham (23 May 2019). "Statement of parties and individual candidates nominated" (PDF). Exeter City Council.
    124. "Results of European Parliamentary Election 2019". live-bcpcouncil-bournemouth.cloud.contensis.com. Retrieved 27 May 2019.
    125. "EU election turnout figures up in the South West from 2014 - but Plymouth's turnout worst in the region". Devon Live. 25 May 2019. Retrieved 25 May 2019.
    126. Source: "European Election". Gibraltar Parliament. Archived from the original on 27 May 2019. Retrieved 27 May 2019.
    127. "Results of European Parliamentary Election 2019". live-bcpcouncil-bournemouth.cloud.contensis.com. Retrieved 27 May 2019.
    128. "2019 European elections: List of candidates for the West Midlands| BBC News". BBC News. 27 April 2019. Retrieved 28 April 2019.
    129. "Regional breakdown 2019" (PDF). Birmingham City Council. Retrieved 3 June 2019.
    130. "EU parliamentary elections". www.leeds.gov.uk. Archived from the original on 26 April 2019. Retrieved 26 April 2019.
    131. "Electoral region of Northern Ireland".
    132. "Who are the MEP candidates in Scotland?". BBC. 25 April 2019.
    133. "SNP reveal list for Euro elections as party go for three MEPs". The National. 20 April 2019.
    134. "Scottish Lib Dems unveil Euro election candidates". BBC News. Retrieved 19 April 2019.
    135. "The list of Conservative MEP candidates for Scotland". Conservative Home. 16 April 2019.
    136. "Scotland's main parties reveal candidates for European Parliament elections". The Scotsman. 19 April 2019.
    137. "EU candidates". UK Independence Party. Archived from the original on 5 August 2020. Retrieved 25 May 2019.
    138. 1 2 "Who are the MEP candidates in Scotland?". BBC News. 25 April 2019. Retrieved 26 April 2019.
    139. "European Parliamentary Elections 2019". East Dunbartonshire Council. Archived from the original on 20 December 2019. Retrieved 18 July 2019.
    140. Statement of Parties Nominated and Notice of Poll / Datganiad o’r Pleidiau a Enwebwyd a Rhybudd o Etholiad [ permanent dead link ] Cardiff City Council
    141. "European Parliamentary Elections 2019: Statement of Local Totals" (PDF). Isle of Anglesey County Council. Retrieved 13 June 2019.
    142. "European Parliamentary Elections 2019: Statement of Local Totals" (PDF). Blaenau Gwent County Borough Council. Archived from the original (PDF) on 28 October 2021. Retrieved 30 June 2019.
    143. "European Parliamentary Elections 2019: Verification Totals" (PDF). Blaenau Gwent County Borough Council. Archived from the original (PDF) on 28 October 2021. Retrieved 30 June 2019.
    144. "European Parliamentary Elections 2019: Statement of Local Totals" (PDF). Bridgend County Borough Council. Retrieved 30 June 2019.
    145. "European Parliamentary Elections 2019". Caerphilly County Borough Council. Retrieved 30 June 2019.
    146. "European Parliamentary - Thursday, 23rd May, 2019". Cardiff Council. 23 May 2019. Retrieved 30 June 2019.
    147. "European Parliamentary Election 2019". Carmarthenshire County Council. Archived from the original on 19 June 2019. Retrieved 4 June 2019.
    148. "2019 European Parliamentary Elections: Statement of Local Totals" (PDF). Ceredigion County Council. Retrieved 30 June 2019.
    149. "European Parliamentary - Thursday, 23rd May, 2019" (PDF). Ceredigion County Council. Retrieved 30 June 2019.
    150. "2019 European Parliamentary Elections: Statement of Local Totals" (PDF). Conwy County Borough. Retrieved 1 July 2019.
    151. "European elections - Conwy's verification statement" (PDF). Conwy County Borough. Retrieved 1 July 2019.
    152. "Election results by party". Denbighshire County Council. April 2013. Retrieved 1 July 2019.
    153. "European Parliamentary Elections 2019 – Statement of Local Totals" (PDF). Flintshire County Council. Retrieved 1 July 2019.
    154. "European Parliamentary Elections 2019 – Statement of Local Totals" (PDF). Gwynedd Council. Retrieved 1 July 2019.
    155. "European Parliamentary Elections 2019 – Statement of Local Totals" (PDF). Merthyr Tydfil Council. Archived from the original (PDF) on 1 July 2019. Retrieved 1 July 2019.
    156. "European Parliamentary Election - Wales". Merthyr TydfilCouncil. Archived from the original on 1 July 2019. Retrieved 1 July 2019.
    157. "Declaration of Result of Poll". Monmouthshire County Council. Retrieved 2 July 2019.
    158. "European Parliamentary Elections 2019 - Statement of Local Totals" (PDF). Neath Port Talbot Council. Archived from the original (PDF) on 19 June 2019. Retrieved 2 July 2019.
    159. "European elections: Newport City Council results". Newport City Council. Retrieved 2 July 2019.
    160. "European Parliament Election 2019". Pembrokeshire County Council. Retrieved 2 July 2019.
    161. "European Parliamentary Election 2019". Powys County Council. Archived from the original on 2 July 2019. Retrieved 2 July 2019.
    162. "Declaration of result - Statement of Local Totals" (PDF). Rhondda Cynon Taf County Borough Council. Retrieved 2 July 2019.
    163. "Swansea results - European Parliamentary election 2019". Swansea Borough Council. Archived from the original on 2 July 2019. Retrieved 2 July 2019.
    164. "European Parliamentary Elections 2019" (PDF). Torfaen County Borough. Retrieved 2 July 2019.
    165. "European Parliamentary Elections 2019 – Statement of Local Totals" (PDF). Vale of Glamorgan Council. Retrieved 3 July 2019.
    166. "European Parliamentary Elections 2019 – Verification Statement" (PDF). Vale of Glamorgan Council. Retrieved 3 July 2019.
    167. "European Parliamentary Elections 2019 – Statement of Local Totals" (PDF). Wrexham County Borough Council. Retrieved 3 July 2019.