36th Parliament | (1931) |
37th Parliament | (1935) |
38th Parliament | (1945) |
39th Parliament | (1950) |
40th Parliament | (1951) |
This is an incomplete alphabetical list of constituency election results to the 38th Parliament of the United Kingdom at the 1945 general election, held in July 1945.
Party | Candidate | Votes | % | ±% | |
---|---|---|---|---|---|
Labour | Richard Adams | 19,782 | 57.6 | +20.5 | |
Conservative | Walter Stanley Edgson | 14,552 | 42.4 | -20.5 | |
Majority | 5,230 | 15.2 | N/A | ||
Turnout | 34,334 | 70.9 | +14.1 | ||
Labour gain from Conservative | Swing | ||||
Party | Candidate | Votes | % | ±% | |
---|---|---|---|---|---|
Labour | Francis Douglas | 14,070 | 73.9 | +15.2 | |
Conservative | John Serocold Paget Mellor | 4,969 | 26.1 | −15.2 | |
Majority | 9,101 | 47.8 | +30.4 | ||
Turnout | 19,039 | 71.1 | +15.6 | ||
Labour hold | Swing | ||||
Party | Candidate | Votes | % | ±% | |
---|---|---|---|---|---|
Labour Co-op | Caroline Ganley | 19,275 | 61.53 | ||
Conservative | Ernest Partridge | 12,050 | 38.47 | ||
Majority | 7,225 | 23.06 | N/A | ||
Turnout | 31,325 | 73.04 | |||
Labour Co-op gain from Conservative | Swing | ||||
Party | Candidate | Votes | % | ±% | |
---|---|---|---|---|---|
Labour | Richard Sargood | 8,139 | 72.2 | +10.0 | |
National Liberal | W. Bernard Pemberton | 2,238 | 19.8 | -18.0 | |
Liberal | Francis Howard Collier | 903 | 8.0 | New | |
Majority | 5,901 | 52.4 | +28.0 | ||
Turnout | 17,004 | 66.3 | +0.5 | ||
Labour hold | Swing | +14.0 | |||
Party | Candidate | Votes | % | ±% | |
---|---|---|---|---|---|
Labour Co-op | Dan Chater | 7,696 | 59.9 | −3.6 | |
Liberal | Paul Wright | 3,979 | 30.9 | −5.6 | |
Conservative | William Sackville | 1,185 | 9.2 | New | |
Majority | 3,717 | 29.0 | +2.0 | ||
Turnout | 19,225 | 66.9 | +11.4 | ||
Labour Co-op hold | Swing | +1.0 | |||
Party | Candidate | Votes | % | ±% | |
---|---|---|---|---|---|
Labour Co-op | Percy Holman | 6,669 | 57.3 | +10.4 | |
Liberal | Percy Harris | 4,213 | 36.2 | -16.9 | |
National | O. Howard Leicester | 750 | 6.5 | New | |
Majority | 2,456 | 21.1 | N/A | ||
Turnout | 11,632 | ||||
Labour gain from Liberal | Swing | +13.6 | |||
Party | Candidate | Votes | % | ±% | |
---|---|---|---|---|---|
Labour | Charles Key | 10,982 | 84.1 | +7.1 | |
Conservative | Charles Kenneth Duthie | 2,075 | 15.9 | -7.1 | |
Majority | 8,907 | 68.2 | +14.2 | ||
Turnout | 13,057 | 62.7 | +3.2 | ||
Labour hold | |||||
Party | Candidate | Votes | % | ±% | |
---|---|---|---|---|---|
Labour | Marcus Lipton | 15,583 | 63.6 | +27.5 | |
Conservative | Nigel Colman | 8,928 | 36.4 | -21.2 | |
Majority | 6,655 | 27.2 | N/A | ||
Turnout | 37,493 | 65.4 | +6.9 | ||
Labour gain from Conservative | Swing | +24.4 | |||
Party | Candidate | Votes | % | ±% | |
---|---|---|---|---|---|
Labour | Cecil Manning | 7,186 | 76.6 | +11.9 | |
Conservative | Edward Rudolph Mayer | 1,394 | 14.9 | -17.9 | |
Independent National | Thomas Frederick Rhodes Disher | 794 | 8.5 | New | |
Majority | 5,792 | 61.7 | +29.8 | ||
Turnout | 15,506 | 60.5 | +4.9 | ||
Labour hold | Swing | ||||
Party | Candidate | Votes | % | ±% | |
---|---|---|---|---|---|
Labour | Freda Künzlen Corbet | 12,251 | 69.6 | +24.3 | |
Conservative | L. Avon May | 5,346 | 30.4 | -18.2 | |
Majority | 6,905 | 39.2 | N/A | ||
Turnout | 17,597 | 65.2 | +5.9 | ||
Labour gain from Conservative | Swing | +21.2 | |||
Party | Candidate | Votes | % | ±% | |
---|---|---|---|---|---|
Conservative | Allan Noble | 12,043 | 63.7 | -11.3 | |
Labour | Margaret Douglas Shufeldt | 5,874 | 31.1 | +6.0 | |
Common Wealth | Dorothy Anderton Sharpe | 984 | 5.2 | New | |
Majority | 6,169 | 32.6 | -17.3 | ||
Turnout | 30,095 | 62.8 | +1.1 | ||
Conservative hold | Swing | -8.6 | |||
Party | Candidate | Votes | % | ±% | |
---|---|---|---|---|---|
National | Andrew Duncan | 5,332 | 39.48 | N/A | |
Conservative | George Broadbridge | 5,309 | 39.31 | N/A | |
Liberal | Andrew McFadyean | 1,487 | 11.01 | New | |
Independent | S. W. Alexander | 1,379 | 10.21 | New | |
Majority | 3,822 | 28.30 | N/A | ||
Turnout | 10,851 | 63.9 | N/A | ||
Conservative hold | Swing | ||||
Party | Candidate | Votes | % | ±% | |
---|---|---|---|---|---|
Labour | John Battley | 15,205 | 54.17 | ||
Conservative | Roy Lucas Lowndes | 10,014 | 35.68 | ||
Liberal | Charles Erik Paterson | 2,850 | 10.15 | New | |
Majority | 5,191 | 18.49 | N/A | ||
Turnout | 28,069 | 70.78 | |||
Labour gain from Conservative | Swing | ||||
Party | Candidate | Votes | % | ±% | |
---|---|---|---|---|---|
Communist | Phil Piratin | 5,075 | 47.6 | new | |
Labour | Daniel Frankel | 3,861 | 36.2 | −21.0 | |
Conservative | Vernon Motion | 1,722 | 16.2 | −26.6 | |
Majority | 1,214 | 11.4 | n/a | ||
Turnout | 16,177 | 65.9 | +2.4 | ||
Communist gain from Labour | Swing | n/a | |||
Party | Candidate | Votes | % | ±% | |
---|---|---|---|---|---|
Labour | Noel Mason-Macfarlane | 16,638 | 61.2 | +26.8 | |
Conservative | Brendan Bracken | 10,093 | 37.1 | −22.3 | |
Socialist (GB) | Clifford Groves | 472 | 1.7 | new | |
Majority | 6,545 | 24.1 | n/a | ||
Turnout | 27,203 | 71.0 | +10.7 | ||
Labour gain from Conservative | Swing | ||||
Party | Candidate | Votes | % | ±% | |
---|---|---|---|---|---|
Conservative | Harold Webbe | 9,160 | 54.4 | −23.1 | |
Labour | Jeremy Hutchinson | 4,408 | 26.1 | +3.6 | |
Communist | Gabriel 'Billy' Carritt | 2,964 | 17.6 | n/a | |
Democratic | Norman Leith-Hay-Clark | 326 | 1.9 | n/a | |
Majority | 4,752 | 28.3 | −6.5 | ||
Turnout | 28,823 | 58.5 | +28.2 | ||
Conservative hold | Swing | n/a | |||
Party | Candidate | Votes | % | ±% | |
---|---|---|---|---|---|
Conservative | Arthur Howard | 13,086 | 67.2 | −17.4 | |
Common Wealth | Wilfred Brown | 5,314 | 27.3 | n/a | |
Independent | Dorothy Crisp | 1,069 | 5.5 | n/a | |
Majority | 7,772 | 39.9 | −29.3 | ||
Turnout | 19,469 | 57.2 | +2.0 | ||
Conservative hold | Swing | n/a | |||
Party | Candidate | Votes | % | ±% | |
---|---|---|---|---|---|
Labour | Julian Snow | 14,745 | 55.3 | +25.4 | |
Conservative | Ralph Beaumont | 11,345 | 42.6 | −17.4 | |
Democratic | Walter Robert C Foster | 561 | 2.1 | n/a | |
Majority | 3,400 | 12.7 | 42.8 | ||
Turnout | 73.5 | +2.4 | |||
Labour gain from Conservative | Swing | +21.4 | |||
Party | Candidate | Votes | % | ±% | |
---|---|---|---|---|---|
Labour | Donald Bruce | 15,352 | 51.1 | +17.7 | |
Conservative | Greville Howard | 14,310 | 47.6 | −19.0 | |
Democratic | John Edward Vincent Keast | 388 | 1.3 | n/a | |
Majority | 1,042 | 3.5 | 36.7 | ||
Turnout | 75.4 | +10.5 | |||
Labour gain from Conservative | Swing | +18.3 | |||
Party | Candidate | Votes | % | ±% | |
---|---|---|---|---|---|
Conservative | Peter Roberts | 18,120 | 54.0 | −19.4 | |
Common Wealth | Sydney Checkland | 12,045 | 35.9 | n/a | |
Liberal | Philip Rodney Nightingale | 3,391 | 10.1 | n/a | |
Majority | 6,075 | 18.1 | −29.1 | ||
Turnout | 75.6 | −4.6 | |||
Conservative hold | Swing | n/a | |||
Party | Candidate | Votes | % | ±% | |
---|---|---|---|---|---|
Conservative | Oliver Lyttelton | 19,456 | 57.4 | −16.0 | |
Common Wealth | Tom Wintringham | 14,435 | 42.6 | n/a | |
Majority | 5,021 | 14.8 | −32.0 | ||
Turnout | 33,891 | 69.2 | n/a | ||
Conservative hold | Swing | n/a | |||
Party | Candidate | Votes | % | ±% | |
---|---|---|---|---|---|
Conservative | Roger Conant | 17,393 | 55.0 | n/a | |
Liberal | Gerald Samson | 14,223 | 45.0 | n/a | |
Majority | 3,170 | 10.0 | n/a | ||
Turnout | 31,616 | 67.5 | n/a | ||
Conservative hold | Swing | ||||
Party | Candidate | Votes | % | ±% | |
---|---|---|---|---|---|
Independent Progressive | Vernon Bartlett | 17,937 | 45.8 | n/a | |
Conservative | Gerald Wills | 15,625 | 39.9 | −17.0 | |
Labour | Norman Corkhill | 5,613 | 14.3 | −5.5 | |
Majority | 2,312 | 5.9 | |||
Turnout | 39,175 | 72.7 | −0.0 | ||
Independent Progressive hold | Swing | ||||
Party | Candidate | Votes | % | ±% | |
---|---|---|---|---|---|
Liberal | George Wadsworth | 15,934 | 51.5 | +6.6 | |
Conservative | Albert Braithwaite | 14,985 | 48.5 | −6.6 | |
Majority | 949 | 3.0 | n/a | ||
Turnout | 30,919 | 71.9 | −6.5 | ||
Liberal gain from Conservative | Swing | +6.6 | |||
Party | Candidate | Votes | % | ±% | |
---|---|---|---|---|---|
Common Wealth | Ernest Millington | 27,309 | 46.7 | n/a | |
Conservative | Hubert Ashton | 25,229 | 43.2 | −27.6 | |
Liberal | Hilda Buckmaster | 5,909 | 10.1 | n/a | |
Majority | 2,080 | 3.6 | |||
Turnout | 73.4 | +8.0 | |||
Common Wealth gain from Conservative | Swing | ||||
Party | Candidate | Votes | % | ±% | |
---|---|---|---|---|---|
Ind. Conservative | Daniel Lipson | 16,081 | 43.3 | n/a | |
Labour | Phyllis Maude Warner | 11,095 | 29.9 | +0.4 | |
Conservative | W. W. Hicks Beach | 9,972 | 26.8 | −45.7 | |
Majority | 4,986 | 13.4 | −27.6 | ||
Turnout | 37,148 | 75.4 | +5.0 | ||
Ind. Conservative hold | Swing | +7.6 | |||
Party | Candidate | Votes | % | ±% | |
---|---|---|---|---|---|
Conservative | Lancelot Joynson-Hicks | 30,989 | 54.6 | −23.7 | |
Labour | Rosalie Francesca Chamberlayne | 13,670 | 24.1 | +2.4 | |
Liberal | Gerald Kidd | 11,345 | 20.0 | n/a | |
National | Michael Henry Woodard | 625 | 1.1 | n/a | |
Democratic | Paul Tracy Carter | 118 | 0.2 | n/a | |
Majority | 17,319 | 30.5 | −26.1 | ||
Turnout | 68.2 | +8.7 | |||
Conservative hold | Swing | −13.0 | |||
Party | Candidate | Votes | % | ±% | |
---|---|---|---|---|---|
Liberal | Frank Byers | 14,444 | 53.7 | +15.8 | |
Conservative | Richard Glyn | 12,479 | 46.3 | −3.8 | |
Majority | 1,965 | 7.40 | n/a | ||
Turnout | 26,923 | 75.04 | −4.9 | ||
Liberal gain from Conservative | Swing | ||||
Party | Candidate | Votes | % | ±% | |
---|---|---|---|---|---|
Labour | William Proctor | 23,008 | 51.1 | +3.8 | |
Conservative | Robert Cary | 15,562 | 34.6 | −18.1 | |
Liberal | Arthur Gerald Pollitt | 6,215 | 13.8 | new | |
Independent Progressive | Aubrey Bernard Brocklehurst | 211 | 0.5 | new | |
Majority | 7,446 | 16.5 | n/a | ||
Turnout | 44,996 | ||||
Labour gain from Conservative | Swing | +10.9 | |||
Party | Candidate | Votes | % | ±% | |
---|---|---|---|---|---|
Labour | Evan Durbin | 33,163 | 68.2 | +13.0 | |
Conservative | Geoffrey Maber Sparrow | 14,094 | 29.0 | −15.8 | |
Independent Progressive | John Alfred Ward | 1,382 | 2.8 | new | |
Majority | 19,069 | 39.2 | +28.8 | ||
Turnout | 48,639 | 69.0 | +4.5 | ||
Labour hold | Swing | ||||
Party | Candidate | Votes | % | ±% | |
---|---|---|---|---|---|
Conservative | Rupert De la Bère | 17,835 | 53.4 | −11.7 | |
Liberal | Duncan McGuffie | 7,849 | 23.5 | +10.4 | |
Common Wealth | Desmond Donnelly | 7,727 | 23.1 | n/a | |
Majority | 9,986 | 29.9 | −13.4 | ||
Turnout | 63.3 | −3.1 | |||
Conservative hold | Swing | −11.1 | |||
Party | Candidate | Votes | % | ±% | |
---|---|---|---|---|---|
Independent | Denis Kendall | 27,719 | 58.2 | n/a | |
Conservative | George Arthur Worth | 12,206 | 25.6 | −32.5 | |
Labour | Thomas Sansby Bavin | 7,728 | 16.2 | −25.7 | |
Majority | 15,513 | 32.6 | n/a | ||
Turnout | 47,653 | 75.9 | +1.7 | ||
Independent hold | Swing | ||||
Party | Candidate | Votes | % | ±% | |
---|---|---|---|---|---|
Conservative | Neill Cooper-Key | 14,105 | 51.8 | −17.2 | |
Labour | Lewis Gassman | 10,580 | 38.8 | +7.8 | |
Independent Progressive | Sydney Muller Parkman | 2,564 | 9.4 | new | |
Majority | 3,525 | 13.0 | −25.0 | ||
Turnout | 27,249 | 74.9 | +8.4 | ||
Conservative hold | Swing | ||||
Party | Candidate | Votes | % | ±% | |
---|---|---|---|---|---|
Conservative | Alfred Bossom | 21,320 | 53.3 | −19.2 | |
Labour | Otto Leslie Shaw | 18,295 | 45.7 | +18.2 | |
Democratic | George Murray | 416 | 1.0 | n/a | |
Majority | 3,025 | 7.6 | −37.4 | ||
Turnout | 71.0 | +3.6 | |||
Conservative hold | Swing | −18.7 | |||
Party | Candidate | Votes | % | ±% | |
---|---|---|---|---|---|
Conservative | George Jeffreys | 20,838 | 58.4 | −20.7 | |
Liberal | Basil Goldstone | 8,269 | 23.2 | n/a | |
Common Wealth | Thomas Sargant | 6,600 | 18.5 | n/a | |
Majority | 12,569 | 35.2 | −22.9 | ||
Turnout | 64.4 | +1.0 | |||
Conservative hold | Swing | n/a | |||
Party | Candidate | Votes | % | ±% | |
---|---|---|---|---|---|
Independent | William Brown | 18,615 | 40.4 | n/a | |
Conservative | John Lakin | 17,049 | 37.0 | −24.6 | |
Labour | Ronald Lewis | 10,470 | 22.7 | −15.8 | |
Majority | 1,566 | 3.4 | n/a | ||
Turnout | 46,144 | 73.6 | −0.2 | ||
Independent gain from Conservative | Swing | ||||
Party | Candidate | Votes | % | ±% | |
---|---|---|---|---|---|
Conservative | Robert Turton | 20,483 | 60.1 | n/a | |
Common Wealth | Edward Moeran | 13,572 | 39.8 | n/a | |
Majority | 6,911 | 20.3 | n/a | ||
Turnout | 65.5 | n/a | |||
Conservative hold | Swing | n/a | |||
Party | Candidate | Votes | % | ±% | |
---|---|---|---|---|---|
Conservative | Ernest Marples | 18,448 | 42.94 | +9.74 | |
Independent | George Reakes | 14,638 | 34.07 | −24.53 | |
Labour Co-op | Thomas Findley | 9,879 | 22.99 | −9.57 | |
Majority | 3,810 | 8.87 | |||
Turnout | 42,965 | 75.23 | |||
Conservative gain from Independent | Swing | 17.13 | |||
Party | Candidate | Votes | % | ±% | |
---|---|---|---|---|---|
Labour | Hector Hughes | 26,753 | 69.7 | +21.0 | |
Unionist | Grant of Monymusk | 9,623 | 25.1 | −15.1 | |
SNP | Austin William Walker | 2,021 | 5.3 | n/a | |
Majority | 17,130 | 44.6 | +36.1 | ||
Turnout | 67.5 | +1.6 | |||
Labour hold | Swing | +18.0 | |||
Party | Candidate | Votes | % | ±% | |
---|---|---|---|---|---|
Labour | Frederick Pethick-Lawrence | 19,300 | 56.4 | +13.2 | |
Unionist | William Angus Sinclair | 12,771 | 37.3 | −2.3 | |
SNP | Frederick Cameron Yeaman | 2,149 | 6.3 | n/a | |
Majority | 6,529 | 19.1 | +15.5 | ||
Turnout | 69.6 | +1.0 | |||
Labour hold | Swing | +7.7 | |||
Party | Candidate | Votes | % | ±% | |
---|---|---|---|---|---|
Labour | John Williams | 12,273 | 46.0 | −2.1 | |
Unionist | Walter Elliot | 12,185 | 45.7 | −3.0 | |
SNP | Hugh MacDiarmid | 1,314 | 4.9 | n/a | |
Liberal | Charles John Edwin Morgan | 919 | 3.4 | +0.2 | |
Majority | 88 | 0.3 | +0.9 | ||
Turnout | 61.7 | −10.8 | |||
Labour gain from Unionist | Swing | +0.4 | |||
Party | Candidate | Votes | % | ±% | |
---|---|---|---|---|---|
Labour | Thomas Hubbard | 15,401 | 45.0 | −11.3 | |
Unionist | Christopher Guest | 10,099 | 29.5 | −14.2 | |
SNP | Douglas Young | 5,811 | 17.0 | n/a | |
Communist | John McArthur | 2,898 | 8.47 | n/a | |
Majority | 5,302 | 15.5 | +2.9 | ||
Turnout | 34,209 | 76.4 | −3.5 | ||
Labour hold | Swing | +1.4 | |||
Party | Candidate | Votes | % | ±% | |
---|---|---|---|---|---|
Ind. Unionist | John Mackie | 13,647 | 40.7 | n/a | |
Labour | Robert Neale Hales | 11,822 | 35.3 | new | |
Unionist | Bernard Edward Fergusson | 8,032 | 24.0 | ||
Majority | 1,825 | 5.4 | n/a | ||
Turnout | 33,501 | 70.1 | |||
Ind. Unionist gain from Unionist | Swing | ||||
Party | Candidate | Votes | % | ±% | |
---|---|---|---|---|---|
Communist | Willie Gallacher | 17,636 | 42.1 | +4.7 | |
Labour | Willie Hamilton | 15,580 | 37.3 | +1.6 | |
National Liberal | Robert Scott Stevenson | 8,597 | 20.6 | −6.3 | |
Majority | 2,056 | 4.8 | +3.1 | ||
Turnout | 41,813 | 75.4 | −2.4 | ||
Communist hold | Swing | ||||
Party | Candidate | Votes | % | ±% | |
---|---|---|---|---|---|
Labour | Alexander Anderson | 15,831 | 52.7 | +2.0 | |
SNP | Robert McIntyre | 8,022 | 26.7 | n/a | |
Unionist | John d'Henin Hamilton | 6,197 | 20.6 | −28.7 | |
Majority | 7,809 | 26.0 | +24.7 | ||
Turnout | 72.8 | −3.1 | |||
Labour hold | Swing | n/a | |||
Party | Candidate | Votes | % | ±% | |
---|---|---|---|---|---|
Unionist | Alan Gomme-Duncan | 22,484 | 63.1 | −10.6 | |
Labour | William Hughes | 11,617 | 32.6 | +6.3 | |
SNP | James Blair Brown | 1,547 | 4.3 | n/a | |
Majority | 10,867 | 30.5 | +16.9 | ||
Turnout | 65.7 | +1.6 | |||
Unionist hold | Swing | −8.5 | |||
Party | Candidate | Votes | % | ±% | |
---|---|---|---|---|---|
Labour | Thomas Scollan | 15,050 | 48.9 | +10.1 | |
Unionist | Henry Scrymgeour-Wedderburn | 13,836 | 44.9 | −4.8 | |
SNP | Robert Blair Wilkie | 1,995 | 6.3 | −5.2 | |
Majority | 1,214 | 3.9 | 14.8 | ||
Turnout | 30,841 | 70.0 | −11.2 | ||
Labour gain from Unionist | Swing | +7.4 | |||
Party | Candidate | Votes | % | ±% | |
---|---|---|---|---|---|
Conservative | David Price-White | 11,432 | 32.9 | −0.5 | |
Liberal | Seaborne Davies | 11,096 | 32.0 | −34.6 | |
Labour | Elwyn Jones | 10,625 | 30.6 | n/a | |
Plaid Cymru | John Edward Daniel | 1,560 | 4.5 | n/a | |
Majority | 336 | 0.9 | 34.1 | ||
Turnout | 34,713 | 73.8 | +15.0 | ||
Conservative gain from Liberal | Swing | ||||
Party | Candidate | Votes | % | ±% | |
---|---|---|---|---|---|
Labour | Goronwy Roberts | 22,043 | 55.3 | +10.8 | |
Liberal | Goronwy Owen | 15,637 | 39.3 | −9.3 | |
Plaid Cymru | Ambrose Bebb | 2,152 | 5.4 | −1.5 | |
Majority | 6,406 | 16.1 | 20.1 | ||
Turnout | 77.7 | +2.8 | |||
Labour gain from Liberal | Swing | +10.0 | |||
Party | Candidate | Votes | % | ±% | |
---|---|---|---|---|---|
Liberal | Rhys Hopkin Morris | 19,783 | 51.7 | +17.9 | |
Labour | Moelwyn Hughes | 18,504 | 48.3 | +0.8 | |
Majority | 1,279 | 3.4 | n/a | ||
Turnout | 38,286 | 76.1 | −3.2 | ||
Liberal gain from Labour | Swing | ||||
Party | Candidate | Votes | % | ±% | |
---|---|---|---|---|---|
Liberal | Emrys Roberts | 8,495 | 35.8 | −4.2 | |
Labour | Huw Morris Jones | 8,383 | 35.4 | +0.2 | |
Conservative | Craig Parry Hughes | 4,374 | 18.5 | −6.3 | |
Plaid Cymru | Gwynfor Evans | 2,448 | 10.3 | n/a | |
Majority | 112 | 0.4 | −4.5 | ||
Turnout | 82.2 | +0.6 | |||
Liberal hold | Swing | −2.2 | |||
Party | Candidate | Votes | % | ±% | |
---|---|---|---|---|---|
Labour | D. J. Williams | 37,957 | 75.8 | n/a | |
National Liberal | David J Bowen | 8,466 | 16.9 | n/a | |
Plaid Cymru | Wynne Samuel | 3,659 | 7.3 | n/a | |
Majority | 29,491 | 58.9 | n/a | ||
Turnout | 75.7 | n/a | |||
Labour hold | Swing | n/a | |||
Party | Candidate | Votes | % | ±% | |
---|---|---|---|---|---|
Labour | Edward Williams | 32,715 | 76.4 | n/a | |
National | Owen Glyndwr Davies | 7,712 | 18.0 | n/a | |
Plaid Cymru | Trefor Richard Morgan | 2,379 | 5.6 | n/a | |
Majority | 25,003 | 58.4 | n/a | ||
Turnout | 75.7 | n/a | |||
Labour hold | Swing | n/a | |||
Party | Candidate | Votes | % | ±% | |
---|---|---|---|---|---|
Labour | William Mainwaring | 16,733 | 48.4 | −13.4 | |
Communist | Harry Pollitt | 15,761 | 45.5 | + 7.3 | |
Plaid Cymru | James Kitchener Davies | 2,123 | 6.1 | n/a | |
Majority | 972 | 2.9 | −20.7 | ||
Turnout | 82.8 | + 2.0 | |||
Labour hold | Swing | −10.3 | |||
Party | Candidate | Votes | % | ±% | |
---|---|---|---|---|---|
UUP | Conolly Gage | 24,282 | 52.2 | n/a | |
Commonwealth Labour | Harry Midgley | 14,096 | 30.3 | new | |
NI Labour | James Morrow | 8,166 | 17.5 | new | |
Majority | 10,186 | 21.9 | n/a | ||
Turnout | 46,544 | 66.4 | n/a | ||
UUP hold | Swing | n/a | |||
Party | Candidate | FPv% | Count | ||||
---|---|---|---|---|---|---|---|
1 | 2 | 3 | 4 | ||||
Conservative | Kenneth Pickthorn | 46.18 | 10,202 | ||||
Independent | Wilson Harris | 16.18 | 3,574 | 4,709 | 5,185 | 6,556 | |
Independent Progressive | J. B. Priestley | 22.82 | 5,041 | 5,128 | 5,238 | 5,745 | |
Independent | Charles Hill | 10.13 | 2,238 | 3,092 | 3,595 | eliminated | |
National | Ernest Leslie Howard-Williams | 4.69 | 1,036 | 1,798 | eliminated | – | |
Electorate: 42,012 Valid: 22,091 Quota: 7,364 Turnout: 52.58 |
Party | Candidate | FPv% | Count | |||||
---|---|---|---|---|---|---|---|---|
1 | 2 | 3 | 4 | 5 | ||||
Independent Progressive | Eleanor Rathbone | 53.3 | 11,176 | |||||
Independent | Kenneth Lindsay | 9.2 | 1,923 | 3,503 | 3,856 | 4,528 | 5,826 | |
Independent Labour | Stanley Wormald | 15.3 | 3,212 | 3,973 | 4,081 | 4,473 | 4,675 | |
National | Eric Cuthbert Arden | 11.6 | 2,433 | 3,073 | 3,389 | 3,829 | eliminated | |
Independent | John Henry Richardson | 5.3 | 1,124 | 1,995 | 2,341 | eliminated | ||
Independent | A. Russell Foxall | 5.3 | 1,105 | 1,437 | eliminated | |||
Electorate: 41,976 Valid: 20,973 Quota: 6,992 Turnout: 50.0 |
Party | Candidate | Votes | % | ±% | |
---|---|---|---|---|---|
National | Ernest Graham-Little | 7,618 | 50.5 | −19.1 | |
Independent Progressive | Mary Stocks | 7,469 | 49.5 | new | |
Majority | 149 | 1.0 | −38.2 | ||
Turnout | 15,087 | 63.0 | −8.7 | ||
National hold | Swing | n/a | |||
Party | Candidate | Votes | % | ±% | |
---|---|---|---|---|---|
Liberal | William John Gruffydd | 5,239 | 75.5 | +4.2 | |
Plaid Cymru | Gwenan Jones | 1,696 | 24.5 | n/a | |
Majority | 3,543 | 51.0 | +28.4 | ||
Turnout | 6,935 | 58.5 | −3.8 | ||
Liberal hold | Swing | n/a | |||
Eastbourne is a constituency for the House of Commons of the UK Parliament. It was created as one of nine in Sussex in 1885, since when it has reduced in geographic size reflecting the growth of its main settlement, Eastbourne.
Dewsbury is a constituency created in 1868. This seat is represented in the House of Commons of the United Kingdom Parliament since 2019 by Mark Eastwood of the Conservative Party.
Lichfield is a constituency in Staffordshire represented in the House of Commons of the UK Parliament since its 1997 recreation by Michael Fabricant, a Conservative.
Fareham is a constituency in Hampshire represented in the House of Commons of the UK Parliament. Since 2015, it has been represented by Suella Braverman of the Conservative Party.
New Forest and Christchurch was a county constituency in Hampshire which elected one Member of Parliament (MP) to the House of Commons of the Parliament of the United Kingdom. It was created for the 1918 general election, partially replacing the previous New Forest constituency, and was abolished for the 1950 general election, when it was partially replaced by a recreated New Forest constituency.
Rhondda East was a parliamentary constituency which returned one Member of Parliament (MP) to the House of Commons of the Parliament of the United Kingdom from 1918 until 1974. Along with Rhondda West it was formed by dividing the old Rhondda constituency.
Grantham was a Parliamentary constituency in Lincolnshire, England.
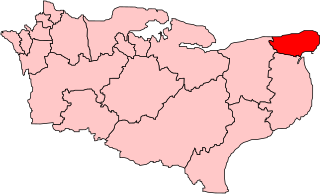
Isle of Thanet was a county constituency which returned one Member of Parliament (MP) to the House of Commons of the Parliament of the United Kingdom from 1885, until it was abolished for the February 1974 general election.
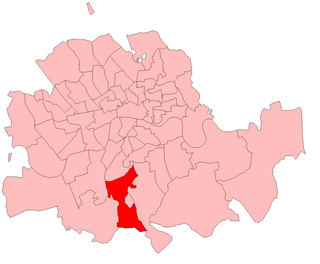
Norwood was a parliamentary constituency in south London which returned one Member of Parliament (MP) to the House of Commons of the Parliament of the United Kingdom by the first past the post system.
Leek was a parliamentary constituency in Staffordshire which returned one Member of Parliament (MP) to the House of Commons of the Parliament of the United Kingdom.
Hornsey was a constituency that returned one Member of Parliament (MP) to the House of Commons of the UK Parliament, 1885 — 1983. It was then largely replaced by Hornsey & Wood Green. Its voters using the first-past-the-post system elected the Conservative Party candidate at each election. Its closest result was a 1.29% majority at the 1966 election which saw the start of the Second Wilson Ministry. From 1945 onwards the runners-up in the seat were the Labour Party candidates.
Kingston or Kingston-upon-Thames was a parliamentary constituency which covered the emerging southwest, outer London suburb of Kingston upon Thames and which existed between 1885 and 1997 and returned one Member of Parliament (MP) to the House of Commons of the UK Parliament. The Conservative candidate won each election during its 112-year existence.
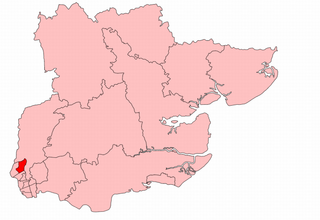
Holland with Boston was a county constituency represented in the House of Commons of the Parliament of the United Kingdom from 1918 to 1997. It elected one Member of Parliament (MP) by the first past the post system of election.
Walthamstow East was a parliamentary constituency in what was then the Municipal Borough of Walthamstow in east London. It returned one Member of Parliament (MP) to the House of Commons of the Parliament of the United Kingdom, elected by the first-past-the-post voting system.
Liverpool East Toxteth was a borough constituency represented in the House of Commons of the Parliament of the United Kingdom. It elected one Member of Parliament (MP) by the first past the post system of election.
Harrow was a constituency of the House of Commons of the UK Parliament 1885—1945 in Middlesex, a traditional county; it covered an area forming part of the north-west of today's Greater London. It returned one Member of Parliament (MP).
Bury was a borough constituency centred on the town of Bury in Lancashire. It returned one Member of Parliament (MP) to the House of Commons of the Parliament of the United Kingdom.
Rhondda West was a parliamentary constituency centred on the Rhondda district of Wales. It returned one Member of Parliament (MP) to the House of Commons of the Parliament of the United Kingdom, elected by the first past the post system. Along with Rhondda East it was formed by dividing the old Rhondda constituency.
Horsham and Worthing was a county constituency in West Sussex, centred on the towns of Horsham and Worthing in West Sussex. It returned one Member of Parliament (MP) to the House of Commons of the Parliament of the United Kingdom, elected by the first past the post system.
Winston Churchill, who served in a multitude of ministerial positions between 1908 and 1952, including as Prime Minister of the United Kingdom from 1940 to 1945 and again from 1951 to 1955, and as a Member of Parliament (MP) for five different constituencies between 1900 and 1964, except for a break in 1922–24.