| | ||||||||||||||||||||||||||||||||||||||||||||||||||||||||||||||||
| ||||||||||||||||||||||||||||||||||||||||||||||||||||||||||||||||
All 650 seats in the House of Commons of the United Kingdom 326 seats needed for a majority | ||||||||||||||||||||||||||||||||||||||||||||||||||||||||||||||||
| Turnout | 65.1% | |||||||||||||||||||||||||||||||||||||||||||||||||||||||||||||||
|---|---|---|---|---|---|---|---|---|---|---|---|---|---|---|---|---|---|---|---|---|---|---|---|---|---|---|---|---|---|---|---|---|---|---|---|---|---|---|---|---|---|---|---|---|---|---|---|---|---|---|---|---|---|---|---|---|---|---|---|---|---|---|---|---|
This lists parties that won seats. See the complete results below.
| ||||||||||||||||||||||||||||||||||||||||||||||||||||||||||||||||

This is the results breakdown of the 2010 United Kingdom general election.
| | ||||||||||||||||||||||||||||||||||||||||||||||||||||||||||||||||
| ||||||||||||||||||||||||||||||||||||||||||||||||||||||||||||||||
All 650 seats in the House of Commons of the United Kingdom 326 seats needed for a majority | ||||||||||||||||||||||||||||||||||||||||||||||||||||||||||||||||
| Turnout | 65.1% | |||||||||||||||||||||||||||||||||||||||||||||||||||||||||||||||
|---|---|---|---|---|---|---|---|---|---|---|---|---|---|---|---|---|---|---|---|---|---|---|---|---|---|---|---|---|---|---|---|---|---|---|---|---|---|---|---|---|---|---|---|---|---|---|---|---|---|---|---|---|---|---|---|---|---|---|---|---|---|---|---|---|
This lists parties that won seats. See the complete results below.
| ||||||||||||||||||||||||||||||||||||||||||||||||||||||||||||||||
This is the results breakdown of the 2010 United Kingdom general election.
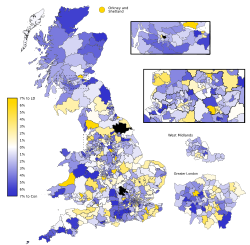
The election was marked by no uniform national swing, with suburban and rural constituencies showing large swings from Labour to the Conservatives, but urban seats showing much smaller swings. Scotland recorded a small swing back to Labour.


The following table is a complete list of seats changing hands as a result of the election based on the notional results of the 2005 election, notwithstanding the results of by-elections to the 54th Parliament. [1]
The Conservatives gained more seats than at any other general election since their landslide result in 1931. Labour lost a total of 94 seats, the second most seats it had lost in a single election.
Of the 533 seats in England, 532 were contested on the day of the general election. Polling in Thirsk and Malton was delayed until 27 May due to the death of the UKIP candidate. [2] The Conservatives won an absolute majority of seats in England with 61 seats more than all other parties combined, and securing an average swing of 5.6% from Labour. [3]
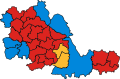
Geographical representations of seats coloured by winning party can be misleading to the eye. Boundaries are drawn by number of electors not geography. This results in rural seats having a large area due to lower population density, while urban seats, with a high density of voters, are geographically quite small. A pure geographical representation of seats coloured by party can make parties with rural seats seem far more popular than urban ones. To counter this bias, the BBC published a map where each seat was an equal size hexagon. [4] [5]
| Party | Seats | Seats change | Votes | % | % change | |
|---|---|---|---|---|---|---|
| Conservative | 297 [6] | +92 | 9,908,169 | 39.5 | +3.8 | |
| Labour | 191 | −87 | 7,042,398 | 28.1 | −7.4 | |
| Liberal Democrats | 43 | −4 | 6,076,189 | 24.2 | +1.3 | |
| Green | 1 | +1 | 258,954 | 1.0 | −0.1 | |
| Speaker | 1 | 0 | 22,860 | 0.09 | ||
| Turnout: | 25,047,355 | 65.5 | ||||
Details of results are given below:


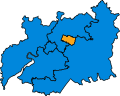


There were 40 seats contested in Wales. The number of Conservative seats rose from three to eight – the party gained one seat from the Liberal Democrats and four from Labour. Welsh nationalist party Plaid Cymru retained three MPs, including Arfon which the boundary changes had notionally given to Labour. Overall, Labour lost four seats but held on to its remaining 26.
| Party | Seats | Seats change | Votes | % | % change | |
|---|---|---|---|---|---|---|
| Labour | 26 | −4 | 531,601 | 36.2 | −6.5 | |
| Conservative | 8 | +5 | 382,730 | 26.1 | +4.7 | |
| Liberal Democrats | 3 | −1 | 295,164 | 20.1 | +1.7 | |
| Plaid Cymru | 3 | 0 | 165,394 | 11.3 | −1.3 | |
| Turnout: | 1,446,690 | 64.9 | ||||

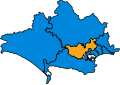
There were 59 seats contested in Scotland. Every constituency in Scotland was won by the party that had won it at the 2005 election, with Labour regaining the two seats they lost in by-elections since 2005. There was a swing to Labour from the Conservatives of 0.8% (with Labour increasing its share of the vote by 2.5% and the Conservatives increasing by just 0.9%), this left the Conservatives with just a single MP representing a Scottish constituency.
For Scottish results in full, see 2010 United Kingdom general election results in Scotland
| Party | Seats | Seats change | Votes | % | % change | |
|---|---|---|---|---|---|---|
| Labour | 41 | 0 | 1,035,528 | 42.0 | +2.5 | |
| Liberal Democrats | 11 | 0 | 465,471 | 18.9 | −3.7 | |
| SNP | 6 | 0 | 491,386 | 19.9 | +2.3 | |
| Conservative | 1 | 0 | 412,855 | 16.7 | +0.9 | |
| Turnout: | 2,465,722 | 63.8 | ||||

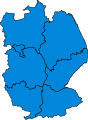
There were 18 seats contested in Northern Ireland. Both Irish nationalist parties, Sinn Féin and SDLP, held their seats. The unionist parties, DUP and UUP (the latter contested the election as UCUNF—an electoral pact with the Conservatives), lost one seat each. The DUP lost Belfast East to the Alliance and in North Down the UUP's Sylvia Hermon left the party over the alliance with the Conservatives and retained her seat as an independent. This left the nationalist parties with eight seats, the unionist parties with eight seats (all DUP), the Alliance with one seat and an independent with one seat. It is the first time since the Partition of Ireland that unionist parties failed to secure a majority of Northern Ireland's Westminster seats in a general election. It was also the first time since Partition that a Nationalist party, Sinn Féin, topped the popular vote at a Westminster election, though winning three fewer seats than the DUP.
Sinn Féin, as an Irish republican party, refuse to take their seats at Westminster (see abstentionism). This leaves 645 MPs to take their seats at Westminster (after the Thirsk and Malton poll), reducing the effective threshold for a parliamentary majority from 326 to 323.[ citation needed ]
| Party | Seats | Seats change | Votes | % | % change | |
|---|---|---|---|---|---|---|
| DUP | 8 | −1 | 168,216 | 25.0 | −8.7 | |
| Sinn Féin | 5 | 0 | 171,942 | 25.5 | +1.2 | |
| SDLP | 3 | 0 | 110,970 | 16.5 | −1.0 | |
| Alliance | 1 | +1 | 42,762 | 6.3 | +2.4 | |
| Independent - Sylvia Hermon | 1 | +1 | 21,181 | 3.1 | — | |
| UCU-NF | 0 | −1 | 102,361 | 15.2 | −2.6 | |
| Turnout: | 673,871 | 57.6 | −7.8 | |||


The 2003 Northern Ireland Assembly election was held on Wednesday, 26 November 2003, after being suspended for just over a year. It was the second election to take place since the devolved assembly was established in 1998. Each of Northern Ireland's eighteen Westminster Parliamentary constituencies elected six members by single transferable vote, giving a total of 108 Members of the Legislative Assembly (MLAs). The election was contested by 18 parties and many independent candidates.

The 2004 European Parliament election was the United Kingdom's part of the wider 2004 European Parliament election which was held between 10 and 13 June 2004 in the 25 member states of the European Union. The United Kingdom's part of this election was held on Thursday 10 June 2004. The election also coincided with the 2004 local elections and the London Assembly and mayoral elections. In total, 78 Members of the European Parliament were elected from the United Kingdom using proportional representation.

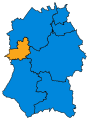
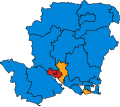
Mid Ulster is a parliamentary constituency in the UK House of Commons. The current MP is Cathal Mallaghan, of Sinn Féin, who was first elected at the 2024 election.

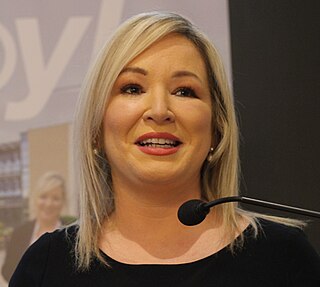
Fermanagh and South Tyrone is a Northern Irish parliamentary constituency in the British House of Commons. It is currently represented by Pat Cullen of Sinn Féin.

East Antrim is a parliamentary constituency in the United Kingdom House of Commons. It is currently represented by Sammy Wilson of the Democratic Unionist Party.

Belfast North is a parliamentary constituency in the United Kingdom House of Commons. The current MP is John Finucane.

Belfast South was a parliamentary constituency in the United Kingdom House of Commons.

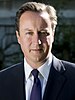
The 2010 United Kingdom general election was held on Thursday 6 May 2010, to elect Members of Parliament to the House of Commons. The election took place in 650 constituencies across the United Kingdom under the first-past-the-post system. The election resulted in a large swing to the opposition Conservative Party led by David Cameron similar to that seen in 1979, the last time a Conservative opposition had ousted a Labour government. The governing Labour Party led by the prime minister Gordon Brown lost the 66-seat majority it had previously enjoyed, but no party achieved the 326 seats needed for a majority. The Conservatives won the most votes and seats, but still fell 20 seats short. This resulted in a hung parliament where no party was able to command a majority in the House of Commons. This was only the second general election since the Second World War to return a hung parliament, the first being the February 1974 election. This election marked the start of Conservative government for the next 14 years.
The 2007 Northern Ireland Assembly election was held on Wednesday, 7 March 2007. It was the third election to take place since the devolved assembly was established in 1998. The election saw endorsement of the St Andrews Agreement and the two largest parties, the Democratic Unionist Party (DUP) and Sinn Féin, along with the Alliance Party, increase their support, with falls in support for the Ulster Unionist Party (UUP) and the Social Democratic and Labour Party (SDLP).

The 2011 Northern Ireland Assembly election took place on Thursday, 5 May, following the dissolution of the Northern Ireland Assembly at midnight on 24 March 2011. It was the fourth election to take place since the devolved assembly was established in 1998.
This is the results breakdown of the 2005 general election.
The 2010 United Kingdom general election in Northern Ireland occurred on 6 May 2010 and all 18 seats in Northern Ireland were contested. 1,169,184 people were eligible to vote, up 29,191 from the 2005 general election. 57.99% of eligible voters turned out, down 5.5 percentage points from the last general election.
The 2005 United Kingdom general election in Northern Ireland was held on 5 May 2005 and all 18 seats in Northern Ireland were contested. 1,139,993 people were eligible to vote, down 51,016 from the 2001 general election. 63.49% of eligible voters turned out, down 5.1 percentage points from the last general election.

A by-election for the UK House of Commons constituency of Mid Ulster in Northern Ireland was held on 7 March 2013. The election was triggered by the resignation of Martin McGuinness, who had been elected to the seat in 1997 as the Sinn Féin candidate. The election was won by Francie Molloy, also of Sinn Féin.
The 2015 United Kingdom general election in Northern Ireland was held on 7 May 2015 and all 18 seats were contested. 1,236,765 people were eligible to vote, up 67,581 from the 2010 general election. 58.45% of eligible voters turned out, an increase of half a percentage point from the last general election. This election saw the return of Ulster Unionists to the House of Commons, after they targeted 4 seats but secured 2.

The 2017 Northern Ireland Assembly election was held on Thursday, 2 March 2017. The election was held to elect members (MLAs) following the resignation of deputy First Minister Martin McGuinness in protest over the Renewable Heat Incentive scandal. McGuinness' position was not filled, and thus by law his resignation triggered an election.
The 2022 Northern Ireland Assembly election was held on 5 May 2022. It elected 90 members to the Northern Ireland Assembly. It was the seventh assembly election since the establishment of the assembly in 1998. The election was held three months after the Northern Ireland Executive collapsed due to the resignation of the First Minister, Paul Givan of the Democratic Unionist Party (DUP), in protest against the Northern Ireland Protocol.
The 2017 United Kingdom general election in Northern Ireland was held on 8 June 2017. All 18 seats in Northern Ireland were contested. 1,242,698 people were eligible to vote, up 5,933 from the 2015 general election. 65.6% of eligible voters turned out, an increase of 7.2 percentage points from the last general election.
The 2019 United Kingdom general election was held on 12 December 2019 to elect all 650 members of the House of Commons, including 18 seats in Northern Ireland. 1,293,971 people were eligible to vote, up 51,273 from the 2017 general election. 62.09% of eligible voters turned out, down 3.5 percentage points from the last general election. For the first time in history, nationalist parties won more seats than unionist parties.

The 2024 general election in Northern Ireland was held on 4 July 2024, with all 18 Northern Irish seats in the House of Commons contested. The general election occurred after the recently completed constituency boundaries review.