2010 United Kingdom general election in England

Last updated

2010 United Kingdom general election in England [1]
Flag of England.svg
  2005 6 May 2010 (2010-05-06) 2015  

All 533 English seats to the House of Commons
 First partySecond partyThird party
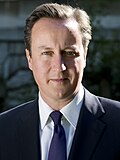
  David Cameron official.jpg Gordon Brown (2008).jpg Nick Clegg by the 2009 budget cropped.jpg
Leader David Cameron Gordon Brown Nick Clegg
Party Conservative Labour Liberal Democrats
Leader since 6 December 2005 24 June 2007 18 December 2007
Last election198 seats, 35.7%285 seats, 35.4%47 seats, 22.9%
Seats before20627847
Seats won297*19143
Seat changeIncrease2.svg91Decrease2.svg87Decrease2.svg4
Popular vote9,908,1697,042,3986,076,189
Percentage39.5%28.1%24.2%
SwingIncrease2.svg3.8%Decrease2.svg7.4%Increase2.svg1.3%

2010UKElectionMapEngland.svg
A map of English parliamentary constituencies
*Seat figure does not include the Speaker of the House of Commons, John Bercow, who was included in the Conservative seat total by some media outlets.
Owing to electoral boundaries changing, this figure is notional.

These are the results of the 2010 United Kingdom general election in England. The election was held on 6 May 2010 and all 533 seats in England were contested. The Conservative Party achieved a complete majority of English seats, but fared less well in Scotland and Wales, so a coalition government was subsequently formed between the Conservatives and the Liberal Democrats.
Contents

Results table

Party [2] SeatsVotes
TotalGainsLossesNet +/-% seatsTotal votes% votesChange
Conservative 297954Increase2.svg9155.79,908,16939.5Increase2.svg3.8
Labour 191289Decrease2.svg8735.87,042,39828.1Decrease2.svg7.4
Liberal Democrats 43812Decrease2.svg48.16,076,18924.2Increase2.svg1.3
UKIP 000Steady2.svg866,6333.5Increase2.svg0.9
BNP 000Steady2.svg532,3332.1Increase2.svg1.3
Green 100Increase2.svg10.2258,9541.0Decrease2.svg0.1
English Democrat 000Steady2.svg64,8260.3Increase2.svg0.2
Respect 000Decrease2.svg133,2510.1Decrease2.svg0.2
Speaker 110Increase2.svg10.222,8600.1Steady2.svg
Health Concern 000Decrease2.svg116,1500.1Steady2.svg
Christian 000015,8410.1N/A
National Front 000010,4000.0Steady2.svg
TUSC 00008,4040.0N/A
Socialist Labour 00004,3680.0Steady2.svg
Other parties0000224,3410.9Steady2.svg
25,085,09765.5Increase2.svg4.5
Popular vote
Conservative
39.5%
Labour
28.1%
Liberal Democrats
24.2%
UKIP
3.5%
BNP
2.1%
Greens
1.0%
Other
1.5%
Parliament seats
Conservative
55.7%
Labour
35.8%
Liberal Democrats
8.1%
Greens
0.2%
Speaker
0.2%

Regional results

Regional vote shares and changes are sourced from the BBC. [3]

East Midlands

PartySeatsVotes
TotalGainedLostNetTotal%Change (%)
Conservative 3112-+12915,93341.2+4.1
Labour 15112-11661,81329.8-9.2
Liberal Democrats --1-1462,98820.8+2.4
UKIP ----72,6593.3+0.6
BNP ----69,7063.1+2.6
 Others----41,0441.8
Total46Turnout2,224,14366.5

East of England

PartySeatsVotes
TotalGainedLostNetTotal%Change (%)
Conservative 5210-+101,356,73947.1+3.8
Liberal Democrats 41-+1692,93224.1+2.2
Labour 2-11-11564,58119.6-10.2
UKIP ---123,2374.3+1.1
 Others----141,6384.9
Total58Turnout2,879,11767.3

London

PartySeatsVotes
TotalGainedLostNetTotal%Change (%)
Labour 3817-61,245,63736.6-2.3
Conservative 287-+71,174,56834.5+2.6
Liberal Democrats 711-751,56122.1+0.2
UKIP ---59,4521.7+0.3
Green ---54,3161.6-1.1
BNP ---52,0951.5+0.9
Respect --1-117,3680.5-0.9
 Others----46,3201.3
Total73Turnout3,401,31764.6

North East

PartySeatsVotes
TotalGainedLostNetTotal%Change (%)
Labour 25-2-2518,26143.6-9.3
Conservative 21-+1282,34723.7+4.2
Liberal Democrats 21-+1280,46823.6+0.2
BNP ---51,9404.4+3.5
 Others----56,9074.7
Total29Turnout1,189,92360.9

North West

PartySeatsVotes
TotalGainedLostNetTotal%Change (%)
Labour 47-13-131,292,97839.5-5.6
Conservative 2212-+121,038,96731.7+3.0
Liberal Democrats 61-+1707,77021.6+0.2
UKIP ---103,7823.2+1.2
 Others----132,7334.0
Total75Turnout3,276,23063.6

South East

PartySeatsVotes
TotalGainedLostNetTotal%Change (%)
Conservative 75151+142,140,89549.9+4.9
Liberal Democrats 413-21,124,78626.2+0.8
Labour 4-13-13697,56716.2-8.1
Green 11-162,1241.4+0.1
UKIP ----177,2694.1+1.0
 Others----91,5992.2
Total84Turnout4,294,24068.0

South West

PartySeatsVotes
TotalGainedLostNetTotal%Change (%)
Conservative 36121+111,187,63742.8+4.2
Liberal Democrats 1514-3962,95434.7+2.2
Labour 4-8-8426,91015.4-7.4
UKIP ----123,9754.5+0.7
 Others----71,9672.6
Total55Turnout2,773,44369.1

West Midlands

PartySeatsVotes
TotalGainedLostNetTotal%Change (%)
Conservative 33161+151,044,08139.5+4.5
Labour 24-14-14808,11430.6-8.9
Liberal Democrats 211-540,16020.5+1.9
UKIP ---105,6854.0+0.8
BNP ----73,3942.8+1.0
Health Concern --1-116,1500.6-0.2
 Others----52,8812.1
Total59Turnout2,640,46564.6

Yorkshire and Humber

PartySeatsVotes
TotalGainedLostNetTotal%Change (%)
Labour 32-9-9821,36834.7-9.3
Conservative 1810-+10769,89532.5+3.9
Liberal Democrats 312-1543,68423.0+2.2
BNP ----104,1774.4+1.6
 Others----129,1535.4
Total53Turnout2,368,27763.2

See also

Related Research Articles

<span class="mw-page-title-main">2001 United Kingdom general election</span>

The 2001 United Kingdom general election was held on Thursday 7 June 2001, four years after the previous election on 1 May 1997, to elect 659 members to the House of Commons. The governing Labour Party was re-elected to serve a second term in government with another landslide victory with a 167 majority, returning 412 members of Parliament versus 418 from the 1997 general election, a net loss of six seats, though with a significantly lower turnout than before—59.4%, compared to 71.6% at the previous election. The number of votes Labour received fell by nearly three million. Tony Blair went on to become the only Labour Prime Minister to serve two consecutive full terms in office. As Labour retained almost all of their seats won in the 1997 landslide victory, the media dubbed the 2001 election "the quiet landslide".

<span class="mw-page-title-main">Politics of the United Kingdom</span> Political system of the United Kingdom of Great Britain and Northern Ireland

The United Kingdom is a unitary state with devolution that is governed within the framework of a parliamentary democracy under a constitutional monarchy in which the monarch, currently Charles III, King of the United Kingdom, is the head of state while the Prime Minister of the United Kingdom, Rishi Sunak, is the head of government. Executive power is exercised by the British government, on behalf of and by the consent of the monarch, and the devolved governments of Scotland, Wales and Northern Ireland. Legislative power is vested in the two chambers of the Parliament of the United Kingdom, the House of Commons and the House of Lords, as well as in the Scottish, Northern Irish and Welsh parliaments.

<span class="mw-page-title-main">1999 European Parliament election in the United Kingdom</span>

The 1999 European Parliament election was the United Kingdom's part of the European Parliament election 1999. It was held on 10 June 1999. Following the European Parliamentary Elections Act 1999, it was the first European election to be held in the United Kingdom where the whole country used a system of proportional representation. In total, 87 Members of the European Parliament were elected from the United Kingdom across twelve new regional constituencies.

<span class="mw-page-title-main">2004 European Parliament election in the United Kingdom</span> Election

The 2004 European Parliament election was the United Kingdom's part of the wider 2004 European Parliament election which was held between 10 and 13 June 2004 in the 25 member states of the European Union. The United Kingdom's part of this election was held on Thursday 10 June 2004. The election also coincided with the 2004 local elections and the London Assembly and mayoral elections. In total, 78 Members of the European Parliament were elected from the United Kingdom using proportional representation.

<span class="mw-page-title-main">Unionism in Scotland</span> Overview of unionism in Scotland

Unionism in Scotland is a political movement which favours the continuation of the political union between Scotland and the other countries of the United Kingdom, and hence is opposed to Scottish independence. Scotland is one of four countries of the United Kingdom which has its own devolved government and Scottish Parliament, as well as representation in the UK Parliament. There are many strands of political Unionism in Scotland, some of which have ties to Unionism and Loyalism in Northern Ireland. The two main political parties in the UK — the Conservatives support Scotland remaining part of the UK.

<span class="mw-page-title-main">2005 United Kingdom general election</span>

The 2005 United Kingdom general election was held on Thursday 5 May 2005, to elect 646 members to the House of Commons. The Labour Party, led by Tony Blair, won its third consecutive victory, with Blair becoming the second Labour leader after Harold Wilson to form three majority governments. However, its majority fell to 66 seats compared to the 167-seat majority it had won four years before. This was the first time the Labour Party had won a third consecutive election, and remains the party's most recent general election victory.

<span class="mw-page-title-main">2010 United Kingdom general election</span> General election held in the United Kingdom

The 2010 United Kingdom general election was held on Thursday 6 May 2010, with 45,597,461 registered voters entitled to vote to elect members to the House of Commons. The election took place in 650 constituencies across the United Kingdom under the first-past-the-post system.

<span class="mw-page-title-main">Scottish Conservatives</span> Part of the British Conservative Party

The Scottish Conservative & Unionist Party, often known simply as the Scottish Conservatives and colloquially as the Scottish Tories, is a centre-right political party in Scotland. It is the second-largest party in the Scottish Parliament and the third-largest in Scottish local government. The party has the second-largest number of Scottish MPs in the House of Commons of the United Kingdom and the seventh overall.

<span class="mw-page-title-main">2009 European Parliament election in the United Kingdom</span> European Parliament elections in the United Kingdom

The 2009 European Parliament election was the United Kingdom's component of the 2009 European Parliament election, the voting for which was held on Thursday 4 June 2009. The election was held concurrently with the 2009 local elections in England. In total, 72 Members of the European Parliament were elected from the United Kingdom using proportional representation.

This is the results breakdown of the 2010 United Kingdom general election.

<span class="mw-page-title-main">2011 United Kingdom local elections</span>

The 2011 United Kingdom local elections were held on Thursday 5 May 2011. In England, direct elections were held in all 36 Metropolitan boroughs, 194 Second-tier district authorities, 49 unitary authorities and various mayoral posts, meaning local elections took place in all parts of England with the exception of seven unitary authorities, and seven districts and boroughs. For the majority of English districts and the 25 unitary authorities that are elected "all out" these were the first elections since 2007. In Northern Ireland, there were elections to all 26 local councils. Elections also took place to most English parish councils.

<span class="mw-page-title-main">2005 United Kingdom general election in Scotland</span>

A general election was held in the United Kingdom on 5 May 2005 and all 59 seats in Scotland were contested. This was the first election to occur under the new boundaries which reduced the number of Scottish seats from 72 to 59. Previously, Scotland had a greater number of MPs per person than the rest of the UK to compensate for its distinct political nature and distance from Westminster. With the introduction of the Scottish Parliament, Scottish constituencies were brought into line with those found in the rest of the UK, so that they had similar electorates.

<span class="mw-page-title-main">2005 United Kingdom general election in Wales</span>

These are the results of the 2005 United Kingdom general election in Wales. The election was held on 5 May 2005 and all 40 seats in Wales were contested.

<span class="mw-page-title-main">2014 European Parliament election in the United Kingdom</span> Election

The 2014 European Parliament election was the United Kingdom's component of the 2014 European Parliament election, held on Thursday 22 May 2014, coinciding with the 2014 local elections in England and Northern Ireland. In total, 73 Members of the European Parliament were elected from the United Kingdom using proportional representation. England, Scotland and Wales use a closed-list party list system of PR, while Northern Ireland used the single transferable vote (STV).

<span class="mw-page-title-main">2015 United Kingdom general election</span> General election held in the United Kingdom

The 2015 United Kingdom general election was held on Thursday, 7 May 2015 to elect 650 Members of Parliament to the House of Commons. It was the only general election held under the rules of the Fixed-term Parliaments Act 2011. Local elections took place in most areas on the same day.

This is the results breakdown of the 2015 United Kingdom general election.

<span class="mw-page-title-main">2016 United Kingdom local elections</span>

The 2016 United Kingdom local elections held on Thursday 5 May 2016 were a series of local elections which were held in 124 local councils and also saw 4 mayoral elections in England which also coincided with elections to the Scottish Parliament, the Welsh Assembly, the Northern Ireland Assembly, the London Assembly, the London mayoral election and the England and Wales Police and crime commissioners. By-elections for the Westminster seats of Ogmore and Sheffield Brightside and Hillsborough were also held. These proved to be David Cameron's last local elections as leader of the Conservative Party and Prime Minister as he resigned two months later following the defeat of Remain in the referendum on Britain's continuing membership of the European Union which was held seven weeks later.

<span class="mw-page-title-main">2017 United Kingdom general election in Wales</span>

The 2017 United Kingdom general election in Wales was held on 8 June 2017; all 40 seats in Wales were contested. The election for each seat was conducted on the basis of first-past-the-post.

Opinion polling for the next United Kingdom general election is continually being carried out by various organisations to gauge voting intention. Most of the polling companies listed are members of the British Polling Council (BPC) and abide by its disclosure rules. The dates for these opinion polls range from the 2019 general election on 12 December to the present day.

<span class="mw-page-title-main">2019 United Kingdom general election in Scotland</span> United Kingdom general election held in Scotland

The 2019 United Kingdom general election was held on Thursday 12 December 2019, two and a half years after the previous general election in June 2017. The Scottish National Party (SNP) received the most votes and won 48 out of 59 seats—a gain of 13 over those won in 2017, and 81% of the Scottish seats in the House of Commons.

References

  1. Election 2010 United Kingdom - National Results BBC News
  2. Election 2010 Results England BBC News
  3. "Election 2010 - Results - United Kingdom - National Results". BBC.