Dewsbury | |
---|---|
County constituency for the House of Commons | |
County | West Yorkshire |
Electorate | 81,912 (December 2019) [1] |
Major settlements | Dewsbury, Mirfield, Kirkburton, Denby Dale |
Current constituency | |
Created | 1868 |
Member of Parliament | Mark Eastwood (Conservative) |
Seats | One |
Created from | Northern West Riding of Yorkshire |
Dewsbury is a constituency [n 1] created in 1868. This seat is represented in the House of Commons of the United Kingdom Parliament since 2019 by Mark Eastwood of the Conservative Party. [n 2]
Further to the completion of the 2023 Periodic Review of Westminster constituencies, the seat will be subject to major boundary changes which will involve the loss of largely rural areas to the south, offset by the addition of the town of Batley. As a consequence, it will be renamed Dewsbury and Batley , to be first contested at the next general election. [2]
Dewsbury's seat dates back to 1868 and the electorate has usually given the winning MP marginal majorities which means it is a marginal seat. Labour MPs served the seat from 1935 until 1983 and again from 1987. In 2010 it was gained by Simon Reevell, a Conservative.
One of the five other parties' candidates standing in 2015 kept their deposit, by winning more than 5% of the vote in 2015, UKIP's Thackray, who emulated the national swing of +9.5% by an entry candidature, polling 12.4% of the vote.
Turnout since 1918 has ranged between 87.9% of the vote in 1950, to 58.8% in 2001.
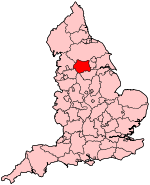
1868–1885: The townships of Dewsbury, Batley, and Soothill. [3]
1918–1950: The County Borough of Dewsbury.
1950–1955: The County Borough of Dewsbury, the Municipal Borough of Ossett, and the Urban Districts of Heckmondwike and Mirfield.
1955–1983: The County Borough of Dewsbury, the Municipal Borough of Ossett, and the Urban District of Mirfield.
1983–1997: The Borough of Kirklees wards of Denby Dale, Dewsbury East, Dewsbury West, Kirkburton, Mirfield, and Thornhill.
1997–2010: The Borough of Kirklees wards of Dewsbury East, Dewsbury West, Heckmondwike, Mirfield, and Thornhill.
2010–present: The Borough of Kirklees wards of Denby Dale, Dewsbury East, Dewsbury South, Dewsbury West, Kirkburton, and Mirfield.
The constituency covers the towns of Dewsbury and Mirfield, and the surrounding areas.
In the 2010 redistribution, the constituency lost the Labour-leaning ward of Heckmondwike, but gained the Conservative-leaning wards of Denby Dale and Kirkburton.
The seat has a substantial Muslim population in the town of Dewsbury (particularly the Savile Town district), combined a few suburban and rural affluent parts such as Denby Dale, Mirfield, and Kirkburton. The town of Dewsbury itself is strongly Labour, and the remaining wards mostly Conservative. Overall the seat has close to national average income and several developments have desirable views as the upland town cuts into the Pennines. Relatively few people rely upon social housing, however the Dewsbury East ward contains a high proportion of social housing in the Chickenley estate, while Dewsbury South contains the Thornhill area, where the local school was the subject of the acclaimed Educating Yorkshire series. In the light of increasing concern over Muslim extremism, the Labour Party candidate Shahid Malik enjoyed a fairly large public media profile after his victory in 2005, with various TV appearances and interviews, strongly denouncing believers in and adherents of such views; however, this has also been a strong area for the British National Party, who obtained their highest vote in Britain (13.1%) in the 2005 general election, much of it taken at the Labour Party's expense. They have also had a substantial vote at local level, when in 2006 for the first time in the UK the BNP polled more votes than any other party standing. However, at the 2010 general election, the BNP's popularity in Dewsbury fell (despite a substantial nationwide rise in support for the party compared to five years previously) and they gained a mere 6% of the vote. [4]
Party | Candidate | Votes | % | ±% | |
---|---|---|---|---|---|
Conservative | Mark Eastwood | 26,179 | 46.4 | +1.3 | |
Labour | Paula Sherriff | 24,618 | 43.7 | −7.3 | |
Liberal Democrats | John Rossington | 2,406 | 4.3 | +2.2 | |
Brexit Party | Philip James | 1,874 | 3.3 | New | |
Green | Simon Cope | 1,060 | 1.9 | +0.1 | |
Monster Raving Loony | Sir Archibald Earl Eaton Stanton | 252 | 0.4 | New | |
Majority | 1,561 | 2.7 | N/A | ||
Turnout | 56,389 | 69.4 | −0.1 | ||
Conservative gain from Labour | Swing | +4.3 | |||
Party | Candidate | Votes | % | ±% | |
---|---|---|---|---|---|
Labour | Paula Sherriff | 28,814 | 51.0 | +9.2 | |
Conservative | Beth Prescott | 25,493 | 45.1 | +6.0 | |
Liberal Democrats | Ednan Hussain | 1,214 | 2.1 | −1.5 | |
Green | Simon Cope | 1,024 | 1.8 | −0.7 | |
Majority | 3,321 | 5.9 | +3.2 | ||
Turnout | 56,545 | 69.5 | +2.3 | ||
Labour hold | Swing | +1.6 | |||
Party | Candidate | Votes | % | ±% | |
---|---|---|---|---|---|
Labour | Paula Sherriff | 22,406 | 41.8 | +9.6 | |
Conservative | Simon Reevell | 20,955 | 39.1 | +4.1 | |
UKIP | Mark Thackray | 6,649 | 12.4 | New | |
Liberal Democrats | Ednan Hussain | 1,924 | 3.6 | −13.3 | |
Green | Adrian Cruden | 1,366 | 2.5 | +0.9 | |
Yorkshire First | Richard Carter | 236 | 0.4 | New | |
CPA | Steve Hakes | 94 | 0.2 | New | |
Majority | 1,451 | 2.7 | N/A | ||
Turnout | 53,630 | 67.2 | −1.3 | ||
Labour gain from Conservative | Swing | +2.8 | |||
Party | Candidate | Votes | % | ±% | |
---|---|---|---|---|---|
Conservative | Simon Reevell | 18,898 | 35.0 | +3.3 | |
Labour | Shahid Malik | 17,372 | 32.2 | −8.4 | |
Liberal Democrats | Andrew Hutchinson | 9,150 | 16.9 | +3.2 | |
Independent | Khizar Iqbal | 3,813 | 7.1 | New | |
BNP | Roger Roberts | 3,265 | 6.0 | −7.1 | |
Green | Adrian Cruden | 849 | 1.6 | +0.1 | |
English Democrat | Michael Felse | 661 | 1.2 | New | |
Majority | 1,526 | 2.8 | N/A | ||
Turnout | 54,008 | 68.5 | +6.5 | ||
Conservative gain from Labour | Swing | -4.6 | |||
Party | Candidate | Votes | % | ±% | |
---|---|---|---|---|---|
Labour | Shahid Malik | 15,807 | 41.0 | −9.5 | |
Conservative | Sayeeda Warsi | 11,192 | 29.0 | −1.2 | |
Liberal Democrats | Kingsley Hill | 5,624 | 14.6 | +2.6 | |
BNP | David Exley | 5,066 | 13.1 | +8.6 | |
Green | Brenda Smithson | 593 | 1.5 | 0.0 | |
Independent | Alan Girvan | 313 | 0.8 | New | |
Majority | 3,615 | 12.0 | −8.3 | ||
Turnout | 38,595 | 62.0 | +3.2 | ||
Labour hold | Swing | −4.2 | |||
Party | Candidate | Votes | % | ±% | |
---|---|---|---|---|---|
Labour | Ann Taylor | 18,524 | 50.5 | +1.1 | |
Conservative | Robert Cole | 11,075 | 30.2 | +0.1 | |
Liberal Democrats | Ian Cuthbertson | 4,382 | 12.0 | +1.7 | |
BNP | Russell Smith | 1,632 | 4.5 | −0.7 | |
Green | Brenda Smithson | 560 | 1.5 | +0.6 | |
UKIP | David Peace | 478 | 1.3 | New | |
Majority | 7,449 | 20.3 | +1.0 | ||
Turnout | 36,651 | 58.8 | -11.2 | ||
Labour hold | Swing | +0.5 | |||
Party | Candidate | Votes | % | ±% | |
---|---|---|---|---|---|
Labour | Ann Taylor | 21,286 | 49.4 | +2.1 | |
Conservative | Paul McCormick | 12,963 | 30.1 | −9.9 | |
Liberal Democrats | Kingsley Hill | 4,422 | 10.3 | +0.4 | |
BNP | Frances Taylor | 2,232 | 5.2 | +4.1 | |
Referendum | Wendy Golf | 1,019 | 2.4 | New | |
Independent Labour | David Daniel | 770 | 1.8 | New | |
Green | Ian McCourtie | 383 | 0.9 | +0.1 | |
Majority | 8,323 | 19.3 | +18.2 | ||
Turnout | 43,975 | 70.0 | -10.2 | ||
Labour hold | Swing | +9.2 | |||
Party | Candidate | Votes | % | ±% | |
---|---|---|---|---|---|
Labour | Ann Taylor | 25,596 | 43.8 | +1.4 | |
Conservative | John Whitfield | 24,962 | 42.7 | +1.1 | |
Liberal Democrats | Robert Meadowcroft | 6,570 | 11.3 | -4.7 | |
BNP | Jane Birdwood | 660 | 1.1 | New | |
Green | Neil Denby | 471 | 0.8 | New | |
Natural Law | Janet Marsden | 146 | 0.3 | New | |
Majority | 634 | 1.1 | +0.3 | ||
Turnout | 58,402 | 80.2 | +2.4 | ||
Labour hold | Swing | +0.2 | |||
Party | Candidate | Votes | % | ±% | |
---|---|---|---|---|---|
Labour | Ann Taylor | 23,668 | 42.4 | +7.1 | |
Conservative | John Whitfield | 23,223 | 41.6 | +2.2 | |
SDP | Alan Mills | 8,907 | 16.0 | −9.3 | |
Majority | 445 | 0.8 | N/A | ||
Turnout | 55,798 | 78.8 | +8.0 | ||
Labour gain from Conservative | Swing | +2.4 | |||
Party | Candidate | Votes | % | ±% | |
---|---|---|---|---|---|
Conservative | John Whitfield | 20,297 | 39.4 | +1.6 | |
Labour | Denis Ripley | 18,211 | 35.3 | −11.4 | |
SDP | David Ginsburg | 13,065 | 25.3 | +9.8 | |
Majority | 2,086 | 4.1 | N/A | ||
Turnout | 51,573 | 70.8 | −6.3 | ||
Conservative gain from Labour | Swing | +6.5 | |||
Party | Candidate | Votes | % | ±% | |
---|---|---|---|---|---|
Labour | David Ginsburg | 22,829 | 46.7 | +1.3 | |
Conservative | Roy Galley | 18,448 | 37.8 | +7.7 | |
Liberal | Neil Philip Derbyshire | 7,580 | 15.5 | −9.0 | |
Majority | 4,381 | 8.9 | −6.4 | ||
Turnout | 48,857 | 77.1 | +4.2 | ||
Labour hold | Swing | −3.2 | |||
Party | Candidate | Votes | % | ±% | |
---|---|---|---|---|---|
Labour | David Ginsburg | 20,378 | 45.4 | +2.9 | |
Conservative | Marguerite Elizabeth Liversidge Wood | 13,477 | 30.1 | −1.5 | |
Liberal | Alan Allsop | 10,991 | 24.5 | −1.4 | |
Majority | 6,901 | 15.3 | +4.4 | ||
Turnout | 44,846 | 72.9 | -8.9 | ||
Labour hold | Swing | +2.3 | |||
Party | Candidate | Votes | % | ±% | |
---|---|---|---|---|---|
Labour | David Ginsburg | 21,186 | 42.5 | −6.2 | |
Conservative | Ivor James Humphrey | 15,774 | 31.6 | −7.1 | |
Liberal | Alan Allsop | 12,889 | 25.9 | +13.3 | |
Majority | 5,412 | 10.9 | +0.9 | ||
Turnout | 49,859 | 81.8 | +7.3 | ||
Labour hold | Swing | +0.4 | |||
Party | Candidate | Votes | % | ±% | |
---|---|---|---|---|---|
Labour | David Ginsburg | 22,015 | 48.7 | −4.9 | |
Conservative | John M. Stanfield | 17,468 | 38.7 | +9.9 | |
Liberal | Alan Allsop | 5,688 | 12.6 | −5.1 | |
Majority | 4,547 | 10.0 | -14.8 | ||
Turnout | 45,171 | 74.5 | -3.4 | ||
Labour hold | Swing | -7.4 | |||
Party | Candidate | Votes | % | ±% | |
---|---|---|---|---|---|
Labour | David Ginsburg | 23,027 | 53.6 | +5.2 | |
Conservative | Donald H Haynes | 12,361 | 28.8 | -5.4 | |
Liberal | Alan Allsop | 7,593 | 17.7 | +0.2 | |
Majority | 10,666 | 24.8 | +10.6 | ||
Turnout | 42,981 | 77.9 | -1.6 | ||
Labour hold | Swing | +5.3 | |||
Party | Candidate | Votes | % | ±% | |
---|---|---|---|---|---|
Labour | David Ginsburg | 21,284 | 48.4 | +2.4 | |
Conservative | Barbara M Garden | 15,046 | 34.2 | -3.7 | |
Liberal | Alan Allsop | 7,679 | 17.5 | +1.4 | |
Majority | 6,238 | 14.2 | +6.1 | ||
Turnout | 44,009 | 79.5 | -3.2 | ||
Labour hold | Swing | +3.1 | |||
Party | Candidate | Votes | % | ±% | |
---|---|---|---|---|---|
Labour | David Ginsburg | 20,870 | 46.0 | -6.1 | |
Conservative | Marcus Fox | 17,201 | 37.9 | +2.4 | |
Liberal | John M McLusky | 7,321 | 16.1 | +3.7 | |
Majority | 3,669 | 7.1 | -8.5 | ||
Turnout | 45,392 | 82.7 | +1.9 | ||
Labour hold | Swing | -4.3 | |||
Party | Candidate | Votes | % | ±% | |
---|---|---|---|---|---|
Labour | William Paling | 23,286 | 52.1 | -1.2 | |
Conservative | Michael Shaw | 15,869 | 35.5 | -0.9 | |
Liberal | Joseph Snowden | 5,516 | 12.4 | +2.0 | |
Majority | 7,417 | 16.6 | -0.3 | ||
Turnout | 44,671 | 80.8 | -5.0 | ||
Labour hold | Swing | ||||
Party | Candidate | Votes | % | ±% | |
---|---|---|---|---|---|
Labour | William Paling | 28,650 | 53.3 | -0.3 | |
National Liberal | James Ramsden | 19,562 | 36.4 | +3.4 | |
Liberal | Joseph Snowden | 5,584 | 10.4 | -3.0 | |
Majority | 9,088 | 16.9 | -3.7 | ||
Turnout | 53,796 | 85.8 | -2.1 | ||
Labour hold | Swing | ||||
Party | Candidate | Votes | % | ±% | |
---|---|---|---|---|---|
Labour | William Paling | 29,341 | 53.6 | -2.7 | |
Conservative | James Ramsden | 18,076 | 33.0 | +3.1 | |
Liberal | Granville Slack | 7,323 | 13.4 | -0.5 | |
Majority | 11,265 | 20.6 | -5.8 | ||
Turnout | 54,740 | 87.9 | +7.6 | ||
Labour hold | Swing | -2.9 | |||
Party | Candidate | Votes | % | ±% | |
---|---|---|---|---|---|
Labour | William Paling | 16,330 | 56.3 | +9.1 | |
National Liberal | Ernest Eric Ritchie Kilner | 8,674 | 29.9 | New | |
Liberal | Thomas Mercer Banks | 4,023 | 13.9 | -9.4 | |
Majority | 7,656 | 26.4 | +8.7 | ||
Turnout | 29,027 | 80.3 | -0.5 | ||
Labour hold | Swing | ||||
General Election 1939–40:
Another General Election was due to take place before the end of 1940. The political parties had been making preparations for an election to take place from 1939 and by the end of this year, the following candidates had been selected:
Party | Candidate | Votes | % | ±% | |
---|---|---|---|---|---|
Labour | Benjamin Riley | 14,066 | 47.21 | +10.89 | |
National Labour | John Fennell | 8,798 | 29.53 | New | |
Liberal | Walter Rea | 6,933 | 23.27 | -40.41 | |
Majority | 5,268 | 17.68 | N/A | ||
Turnout | 29,797 | 80.81 | -3.42 | ||
Labour gain from Liberal | Swing | ||||
Party | Candidate | Votes | % | ±% | |
---|---|---|---|---|---|
Liberal | Walter Rea | 19,463 | 63.68 | +29.68 | |
Labour | Benjamin Riley | 11,101 | 36.32 | -9.88 | |
Majority | 8,362 | 27.36 | N/A | ||
Turnout | 30,564 | 84.23 | -1.88 | ||
Liberal gain from Labour | Swing | ||||
Party | Candidate | Votes | % | ±% | |
---|---|---|---|---|---|
Labour | Benjamin Riley | 14,420 | 46.2 | +5.1 | |
Liberal | Ronald Walker | 10,607 | 34.0 | +6.2 | |
Unionist | JWW Shuttleworth | 6,175 | 19.8 | -11.3 | |
Majority | 3,813 | 12.2 | +2.2 | ||
Turnout | 36,250 | 86.1 | +1.8 | ||
Labour hold | Swing | ||||
Party | Candidate | Votes | % | ±% | |
---|---|---|---|---|---|
Labour | Benjamin Riley | 9,941 | 41.1 | -3.3 | |
Unionist | Frederick Walter Skelsey | 7,516 | 31.1 | New | |
Liberal | Edmund Harvey | 6,723 | 27.8 | -27.8 | |
Majority | 2,425 | 10.0 | N/A | ||
Turnout | 28,677 | 84.3 | +13.6 | ||
Labour gain from Liberal | Swing | ||||
Party | Candidate | Votes | % | ±% | |
---|---|---|---|---|---|
Liberal | Edmund Harvey | 11,179 | 55.6 | +21.5 | |
Labour | Benjamin Riley | 8,923 | 44.4 | +13.1 | |
Majority | 2,256 | 11.2 | N/A | ||
Turnout | 20,102 | 70.7 | -13.2 | ||
Liberal gain from Labour | Swing | ||||
Party | Candidate | Votes | % | ±% | |
---|---|---|---|---|---|
Labour | Benjamin Riley | 8,821 | 37.3 | +7.2 | |
Liberal | Edmund Harvey | 8,065 | 34.1 | +5.5 | |
Unionist | Osbert Peake | 6,744 | 28.5 | -13.8 | |
Majority | 756 | 3.2 | N/A | ||
Turnout | 23,630 | 83.9 | +16.6 | ||
Labour gain from Unionist | Swing | ||||
Party | Candidate | Votes | % | ±% | |
---|---|---|---|---|---|
C | Unionist | Emil Pickering | 7,853 | 42.3 | +5.9 |
Labour | Benjamin Riley | 5,596 | 30.1 | New | |
Liberal | Walter Runciman | 5,130 | 27.6 | −36.0 | |
Majority | 2,257 | 12.2 | N/A | ||
Turnout | 18,579 | 67.3 | −9.8 | ||
Registered electors | 27,592 | ||||
Unionist gain from Liberal | Swing | +21.0 | |||
Cindicates candidate endorsed by the coalition government. |
Party | Candidate | Votes | % | ±% | |
---|---|---|---|---|---|
Liberal | Walter Runciman | 7,061 | 63.6 | +1.2 | |
Conservative | Edward Overend Simpson | 4,033 | 36.4 | −1.2 | |
Majority | 3,028 | 27.2 | +2.4 | ||
Turnout | 11,094 | 77.1 | −10.7 | ||
Registered electors | 14,389 | ||||
Liberal hold | Swing | +1.2 | |||
Party | Candidate | Votes | % | ±% | |
---|---|---|---|---|---|
Liberal | Walter Runciman | 7,882 | 62.4 | +7.7 | |
Conservative | B. Dent | 4,747 | 37.6 | +13.6 | |
Majority | 3,315 | 24.8 | −5.9 | ||
Turnout | 12,629 | 87.8 | −0.7 | ||
Liberal hold | Swing | −3.1 | |||
Party | Candidate | Votes | % | ±% | |
---|---|---|---|---|---|
Liberal | Walter Runciman | 5,594 | 46.1 | −8.6 | |
Conservative | W. B. Boyd-Carpenter | 4,078 | 33.7 | +9.7 | |
Labour | Ben Turner | 2,446 | 20.2 | −1.1 | |
Majority | 1,516 | 12.4 | −18.3 | ||
Turnout | 12,118 | 86.2 | −2.3 | ||
Registered electors | 14,056 | ||||
Liberal hold | Swing | −9.2 | |||
Party | Candidate | Votes | % | ±% | |
---|---|---|---|---|---|
Liberal | Walter Runciman | 6,764 | 54.7 | −6.1 | |
Conservative | W. B. Boyd-Carpenter | 2,959 | 24.0 | −15.2 | |
Labour Repr. Cmte. | Ben Turner | 2,629 | 21.3 | New | |
Majority | 3,805 | 30.7 | +9.1 | ||
Turnout | 12,352 | 88.5 | +13.7 | ||
Registered electors | 13,951 | ||||
Liberal hold | Swing | +4.6 | |||
Party | Candidate | Votes | % | ±% | |
---|---|---|---|---|---|
Liberal | Walter Runciman | 5,660 | 48.1 | −12.7 | |
Conservative | Joe Haley | 4,512 | 38.3 | −0.9 | |
Social Democratic Federation | Harry Quelch | 1,597 | 13.6 | New | |
Majority | 1,148 | 9.8 | −11.8 | ||
Turnout | 11,769 | 87.3 | +12.5 | ||
Registered electors | 13,476 | ||||
Liberal hold | Swing | −5.9 | |||
Party | Candidate | Votes | % | ±% | |
---|---|---|---|---|---|
Liberal | Mark Oldroyd | 6,045 | 60.8 | +8.8 | |
Conservative | Forbes St John Morrow | 3,897 | 39.2 | +1.7 | |
Majority | 2,148 | 21.6 | +7.1 | ||
Turnout | 9,942 | 74.8 | −10.1 | ||
Registered electors | 13,296 | ||||
Liberal hold | Swing | +3.6 | |||
Party | Candidate | Votes | % | ±% | |
---|---|---|---|---|---|
Liberal | Mark Oldroyd | 5,379 | 52.0 | −9.1 | |
Conservative | Henry Cautley | 3,875 | 37.5 | −1.4 | |
Ind. Labour Party | Edward Hartley | 1,080 | 10.5 | New | |
Majority | 1,504 | 14.5 | −7.7 | ||
Turnout | 10,334 | 84.9 | +4.8 | ||
Registered electors | 12,167 | ||||
Liberal hold | Swing | −3.9 | |||
Party | Candidate | Votes | % | ±% | |
---|---|---|---|---|---|
Liberal | Mark Oldroyd | 5,759 | 61.1 | −3.9 | |
Conservative | Henry Cautley | 3,670 | 38.9 | +3.9 | |
Majority | 2,089 | 22.2 | −7.8 | ||
Turnout | 9,429 | 80.1 | +11.2 | ||
Registered electors | 11,768 | ||||
Liberal hold | Swing | −3.9 | |||
Party | Candidate | Votes | % | ±% | |
---|---|---|---|---|---|
Liberal | Mark Oldroyd | 6,071 | 60.5 | −4.5 | |
Liberal Unionist | H. O. Arnold-Forster | 3,969 | 39.5 | +4.5 | |
Majority | 2,102 | 21.0 | −9.0 | ||
Turnout | 10,040 | 85.3 | +16.4 | ||
Registered electors | 11,767 | ||||
Liberal hold | Swing | −4.5 | |||
Party | Candidate | Votes | % | ±% | |
---|---|---|---|---|---|
Liberal | John Simon | 5,118 | 65.0 | +2.4 | |
Conservative | Joseph Samuel Colefax [34] | 2,759 | 35.0 | −2.4 | |
Majority | 2,359 | 30.0 | +4.8 | ||
Turnout | 7,877 | 68.9 | −16.7 | ||
Registered electors | 11,439 | ||||
Liberal hold | Swing | +2.4 | |||
Party | Candidate | Votes | % | ±% | |
---|---|---|---|---|---|
Liberal | John Simon | 6,124 | 62.6 | +20.0 | |
Conservative | Joseph Fox [35] | 3,664 | 37.4 | +18.6 | |
Majority | 2,460 | 25.2 | +21.2 | ||
Turnout | 9,788 | 85.6 | +0.9 | ||
Registered electors | 11,439 | ||||
Liberal hold | Swing | +0.7 | |||
Party | Candidate | Votes | % | ±% | |
---|---|---|---|---|---|
Liberal | John Simon | 3,599 | 42.6 | −10.3 | |
Liberal | William Hoyle [37] | 3,254 | 38.6 | −8.1 | |
Conservative | Alfred Austin [38] | 1,586 | 18.8 | +18.4 | |
Majority | 345 | 4.0 | −2.2 | ||
Turnout | 8,439 | 84.7 | +5.1 | ||
Registered electors | 9,960 | ||||
Liberal hold | Swing | −1.1 | |||
Party | Candidate | Votes | % | ±% | |
---|---|---|---|---|---|
Liberal | John Simon | 3,706 | 52.9 | −0.8 | |
Liberal | John Charles Cox [39] | 3,272 | 46.7 | +0.4 | |
Conservative | William Henry Colbeck [40] | 26 | 0.4 | New | |
Majority | 434 | 6.2 | −1.2 | ||
Turnout | 7,004 | 79.6 | −9.7 | ||
Registered electors | 8,803 | ||||
Liberal hold | Swing | −0.6 | |||
Party | Candidate | Votes | % | ±% | |
---|---|---|---|---|---|
Liberal | John Simon | 3,392 | 53.7 | ||
Liberal | Handel Cossham | 2,923 | 46.3 | ||
Majority | 469 | 7.4 | |||
Turnout | 6,315 | 89.3 | |||
Registered electors | 7,072 | ||||
Liberal win (new seat) |
Kirklees is a metropolitan borough of West Yorkshire, England. The borough comprises the ten towns of Batley, Birstall, Cleckheaton, Dewsbury, Heckmondwike, Holmfirth, Huddersfield, Meltham, Mirfield and Slaithwaite. It is governed by Kirklees Council. Kirklees had a population of 422,500 in 2011; it is the third-largest metropolitan district in England by area size, behind Doncaster and Leeds.
Great Yarmouth is a constituency represented in the House of Commons of the Parliament of the United Kingdom since the 2010 general election by Sir Brandon Lewis, a Conservative.
Leigh is a constituency in Greater Manchester represented in the House of Commons of the UK Parliament since 2019 by James Grundy of the Conservative Party.
St Albans is a constituency represented in the House of Commons of the UK Parliament since 2019 by Daisy Cooper, a Liberal Democrat.
Birmingham Edgbaston is a constituency, represented in the House of Commons of the UK Parliament since 2017 by Preet Gill, a Labour Co-op MP.
South Shields is a borough constituency represented in the House of Commons of the Parliament of the United Kingdom. It elects one Member of Parliament (MP) by the first past the post system of election. It has been represented by Emma Lewell-Buck of the Labour Party since 2013.
Bradford North was a borough constituency represented in the House of Commons of the Parliament of the United Kingdom. Until it was abolished for the 2010 general election, it elected one Member of Parliament (MP) by the first past the post system of election.
Batley and Spen is a constituency in the House of Commons of the UK Parliament. The current MP is Kim Leadbeater, a Labour politician, elected in a 2021 by-election by a 323-vote margin. The seat has returned Labour MPs since the 1997 general election.
Pudsey is a constituency represented in the House of Commons of the UK Parliament since 2010 by Stuart Andrew, a Conservative.
Wakefield is a constituency created in 1832, represented by Simon Lightwood of the Labour Party since 2022.
Leeds East is a constituency represented in the House of Commons of the UK Parliament since 2015 by Richard Burgon of the Labour Party.
Huddersfield is a constituency in West Yorkshire represented in the House of Commons of the UK Parliament since 1983 by Barry Sheerman of Labour Co-op.
Birmingham Perry Barr is a constituency in the West Midlands, represented in the House of Commons of the UK Parliament since 2001 by Khalid Mahmood of the Labour Party.
Dagenham was a borough constituency represented in the House of Commons of the UK Parliament that elected one Member of Parliament (MP) by the first past the post system of election. It was replaced at the 2010 general election largely by Dagenham and Rainham.
Putney is a constituency created in 1918. It is currently represented in the House of Commons of the UK Parliament since 2019 by Fleur Anderson of the Labour Party. Putney was the only seat that Labour gained during the 2019 general election.
Gillingham was a constituency represented in the House of Commons of the Parliament of the United Kingdom. It elected one Member of Parliament (MP) by the first past the post system of election.
Batley and Morley was a parliamentary constituency centred on the towns of Batley and Morley in West Yorkshire. It returned one Member of Parliament (MP) to the House of Commons of the Parliament of the United Kingdom.
Mark Simon Eastwood is a British Conservative Party politician who was elected as the Member of Parliament (MP) for Dewsbury in the 2019 general election.
Craig, F. W. S. (1983). British parliamentary election results 1918–1949 (3 ed.). Chichester: Parliamentary Research Services. ISBN 0-900178-06-X.