2009 European Parliament election in Gibraltar

Last updated

2009 European Parliament election in Gibraltar
Flag of Gibraltar.svg
  2004 4 June 2009 2014  

Contributes towards 6 seats to the European Parliament
 First partySecond partyThird party
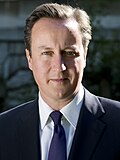
  David Cameron official.jpg Gordon Brown (2008).jpg Nick Clegg by the 2009 budget cropped.jpg
Leader David Cameron Gordon Brown Nick Clegg
Party Conservative Labour Liberal Democrats
Alliance Social Democrats Socialist Labour Liberal
Leader since6 December 200524 June 200718 December 2007
Popular vote3,7211,3281,269
Percentage53.30%19.02%18.18%
SwingDecrease2.svg17.37ppIncrease2.svg9.42ppIncrease2.svg10.47pp

European Parliament elections were held in the British Overseas Territory of Gibraltar (which formed part of the European Parliament constituency of South West England and Gibraltar) on 4 June 2009, with the results announced on 7 June 2009. The Conservatives won with 51% of the votes. [1] Turnout was 35% in Gibraltar, below the 39% for the electoral region as a whole. The turnout in the territory was significantly lower than the percentage from 2004, which was 58%. [1]
Results

PartyVotes%
Conservative Party 3,72153.30
Labour Party 1,32819.02
Liberal Democrats 1,26918.18
Green Party 2243.21
UKIP 1001.43
British National Party 941.35
Christian Party 701.00
Socialist Labour Party 560.80
English Democrats 370.53
Pensioners Party 260.37
Independent – Katie Hopkins 150.21
No2EU 120.17
Mebyon Kernow 80.11
Fair Pay Fair Trade80.11
Jury Team 60.09
Wai D Your Decision40.06
Pro Democracy 30.04
Total6,981100.00
Valid votes6,98197.42
Invalid/blank votes1852.58
Total votes7,166100.00
Registered voters/turnout20,41335.11
Source: Gibraltar Chronicle, Parliament

References

  1. 1 2 Reyes, Brian (8 June 2009). "LANDSLIDE FOR TORIES DISAPPOINTMENT FOR LABOUR". Gibraltar Chronicle. Archived from the original on 10 June 2009. Retrieved 8 June 2009.