| |||||||||||||||||
One third of seats (22 of 66) to Barnsley Metropolitan Borough Council 34 seats needed for a majority | |||||||||||||||||
---|---|---|---|---|---|---|---|---|---|---|---|---|---|---|---|---|---|
| |||||||||||||||||
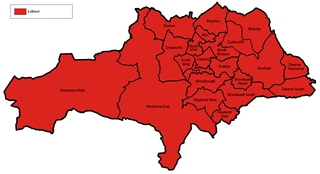
Map showing the results of the 1999 Barnsley council elections. | |||||||||||||||||
|
The 1999 Barnsley Metropolitan Borough Council election took place on 6 May 1999 to elect members of Barnsley Metropolitan Borough Council in South Yorkshire, England. Prior to the election, the Liberal Democrats had gained a seat in Wombwell North from Labour. One third of the council was up for election and the Labour party stayed in overall control of the council. [1] [2] [3] [4]
Party | Seats | Gains | Losses | Net gain/loss | Seats % | Votes % | Votes | +/− | |
---|---|---|---|---|---|---|---|---|---|
Labour | 19 | 0 | 3 | -3 | 86.4 | 54.4 | 21,806 | -16.4% | |
Liberal Democrats | 1 | 1 | 0 | +1 | 4.5 | 22.7 | 9,089 | +15.0% | |
Conservative | 1 | 1 | 0 | +1 | 4.5 | 10.7 | 4,279 | -0.1% | |
Independent | 1 | 1 | 0 | +1 | 4.5 | 5.2 | 2,066 | +1.0% | |
Independent Labour | 0 | 0 | 0 | 0 | 0 | 3.2 | 1,274 | +3.2% | |
Socialist Labour | 0 | 0 | 0 | 0 | 0 | 2.7 | 1,094 | -2.0% | |
Green | 0 | 0 | 0 | 0 | 0 | 0.8 | 307 | -0.5% | |
Socialist Alternative | 0 | 0 | 0 | 0 | 0 | 0.4 | 151 | -0.2% | |
This resulted in the following composition of the council: [3] [4] [5]
Party | Previous council | New council | |||
---|---|---|---|---|---|
Labour | 62 | 59 | |||
Independent | 2 | 3 | |||
Conservatives | 1 | 2 | |||
Liberal Democrats | 1 | 2 | |||
Total | 66 | 66 | |||
Working majority | 58 | 52 |
+/- figures represent changes from the last time these wards were contested.
Party | Candidate | Votes | % | ±% | |
---|---|---|---|---|---|
Labour | S Redford | 819 | 59.9 | -9.4 | |
Liberal Democrats | H Harding | 320 | 23.4 | +12.8 | |
Socialist Labour | S Logan | 142 | 10.4 | -1.1 | |
Conservative | M Cale-Morgan | 86 | 6.3 | -2.3 | |
Majority | 499 | 36.5 | -21.3 | ||
Turnout | 1,367 | 19.3 | +3.6 | ||
Labour hold | Swing | -11.1 | |||
Party | Candidate | Votes | % | ±% | |
---|---|---|---|---|---|
Labour | M Woodhead | 858 | 75.7 | -9.6 | |
Liberal Democrats | M Wright | 199 | 17.6 | +7.6 | |
Conservative | T Allerton | 43 | 3.8 | +3.8 | |
Socialist Labour | P Robinson | 33 | 2.9 | -1.8 | |
Majority | 659 | 58.2 | -17.1 | ||
Turnout | 1,133 | 18.7 | -0.4 | ||
Labour hold | Swing | -8.6 | |||
Party | Candidate | Votes | % | ±% | |
---|---|---|---|---|---|
Labour | A Vodden | 1,132 | 67.8 | -1.5 | |
Socialist Labour | J Simmons | 242 | 14.5 | +1.7 | |
Conservative | D Beaumont-Schofield | 197 | 11.8 | -6.2 | |
Liberal Democrats | S Brook | 98 | 5.9 | +5.9 | |
Majority | 890 | 53.3 | +2.0 | ||
Turnout | 1,669 | 24.5 | +4.8 | ||
Labour hold | Swing | -1.6 | |||
Party | Candidate | Votes | % | ±% | |
---|---|---|---|---|---|
Liberal Democrats | I Guest | 1,074 | 50.4 | +14.9 | |
Labour | R Fisher | 927 | 43.5 | -9.9 | |
Socialist Labour | S Yoxall | 68 | 3.2 | -3.4 | |
Conservative | J Carrington | 61 | 2.9 | -1.5 | |
Majority | 147 | 6.9 | -11.0 | ||
Turnout | 2,130 | 25.7 | +6.4 | ||
Liberal Democrats gain from Labour | Swing | +12.4 | |||
Party | Candidate | Votes | % | ±% | |
---|---|---|---|---|---|
Labour | J Hayward | 1,269 | 72.4 | -10.7 | |
Liberal Democrats | R Arundell | 296 | 16.9 | +9.7 | |
Conservative | A Campbell | 134 | 7.6 | +1.0 | |
Socialist Labour | M Stannard | 54 | 3.1 | +0.0 | |
Majority | 973 | 55.5 | -20.4 | ||
Turnout | 1,753 | 23.2 | +1.8 | ||
Labour hold | Swing | -10.2 | |||
Party | Candidate | Votes | % | ±% | |
---|---|---|---|---|---|
Labour | G Bates | 1,261 | 66.6 | -6.7 | |
Liberal Democrats | M Brown | 474 | 25.0 | +13.2 | |
Conservative | P Stubbins | 158 | 8.3 | -3.5 | |
Majority | 787 | 41.6 | -19.9 | ||
Turnout | 1,893 | 24.3 | +2.3 | ||
Labour hold | Swing | -9.9 | |||
Party | Candidate | Votes | % | ±% | |
---|---|---|---|---|---|
Labour | T Cullum | 1,330 | 60.9 | -11.5 | |
Liberal Democrats | J Hollingsworth | 604 | 27.7 | +27.7 | |
Conservative | J Smith | 207 | 9.5 | -11.5 | |
Socialist Labour | S Robinson | 43 | 2.0 | -4.5 | |
Majority | 726 | 33.2 | -18.2 | ||
Turnout | 2,184 | 20.5 | +2.3 | ||
Labour hold | Swing | -19.6 | |||
Party | Candidate | Votes | % | ±% | |
---|---|---|---|---|---|
Labour | A Cross | 1,248 | 70.3 | -5.6 | |
Liberal Democrats | Sharron Brook | 454 | 25.6 | +1.5 | |
Conservative | E Croft | 74 | 4.2 | +4.2 | |
Majority | 794 | 44.7 | -7.1 | ||
Turnout | 1,776 | 20.0 | -1.4 | ||
Labour hold | Swing | -3.5 | |||
Party | Candidate | Votes | % | ±% | |
---|---|---|---|---|---|
Labour | A Gardiner | 1,115 | 76.9 | -0.3 | |
Liberal Democrats | H Newton | 272 | 18.8 | +1.6 | |
Conservative | G Wilkinson | 63 | 4.3 | -1.4 | |
Majority | 843 | 58.1 | -1.9 | ||
Turnout | 1,450 | 19.0 | +0.8 | ||
Labour hold | Swing | -0.9 | |||
Party | Candidate | Votes | % | ±% | |
---|---|---|---|---|---|
Labour | P Lofts | 1,033 | 40.3 | -23.2 | |
Independent Labour | M Walsh | 525 | 20.5 | +20.5 | |
Liberal Democrats | J Earnshaw | 399 | 15.6 | +15.6 | |
Green | D Jones | 307 | 12.0 | -9.3 | |
Conservative | G Hill | 248 | 9.7 | -2.2 | |
Socialist Labour | L Heppenstall | 49 | 1.9 | -1.4 | |
Majority | 508 | 19.8 | -22.4 | ||
Turnout | 2,561 | 25.2 | +4.9 | ||
Labour hold | Swing | -21.8 | |||
Party | Candidate | Votes | % | ±% | |
---|---|---|---|---|---|
Labour | P Wordsworth | 1,102 | 57.4 | -31.4 | |
Independent Labour | B Maguire | 390 | 20.3 | +20.3 | |
Liberal Democrats | C Stimson | 234 | 12.2 | +12.2 | |
Conservative | M West | 147 | 7.7 | +7.7 | |
Socialist Labour | M Smith | 46 | 2.4 | -8.8 | |
Majority | 712 | 37.1 | -40.5 | ||
Turnout | 1,919 | 23.9 | +3.0 | ||
Labour hold | Swing | -25.8 | |||
Party | Candidate | Votes | % | ±% | |
---|---|---|---|---|---|
Labour | A Schofield | 937 | 51.5 | -28.5 | |
Independent | Les Levitt | 453 | 24.9 | +24.9 | |
Liberal Democrats | B Martin | 277 | 15.2 | +15.2 | |
Conservative | H Jobling | 115 | 6.3 | -7.1 | |
Socialist Labour | G Pickering | 36 | 2.0 | -4.6 | |
Majority | 484 | 26.6 | -40.0 | ||
Turnout | 1,818 | 28.0 | +4.0 | ||
Labour hold | Swing | -26.7 | |||
Party | Candidate | Votes | % | ±% | |
---|---|---|---|---|---|
Labour | M Sheard | 806 | 41.4 | -35.6 | |
Independent | G Brown | 800 | 41.1 | +41.1 | |
Liberal Democrats | D McVey | 239 | 12.3 | +0.4 | |
Conservative | S Wilkinson | 102 | 5.2 | -1.5 | |
Majority | 6 | 0.3 | -64.8 | ||
Turnout | 1,947 | 23.4 | +6.1 | ||
Labour hold | Swing | -38.3 | |||
Party | Candidate | Votes | % | ±% | |
---|---|---|---|---|---|
Labour | M Cawthorne | 678 | 53.3 | -13.6 | |
Liberal Democrats | J Ingram | 326 | 25.6 | +12.3 | |
Conservative | C Carrington | 240 | 18.9 | +2.2 | |
Socialist Labour | K Elbourne | 27 | 2.1 | -1.1 | |
Majority | 352 | 27.7 | -22.5 | ||
Turnout | 1,271 | 17.8 | -0.7 | ||
Labour hold | Swing | -12.9 | |||
Party | Candidate | Votes | % | ±% | |
---|---|---|---|---|---|
Labour | P Leigh | 710 | 65.3 | -19.1 | |
Liberal Democrats | P Durie | 226 | 20.8 | +20.8 | |
Conservative | W Barkworth | 92 | 8.5 | -1.6 | |
Socialist Labour | N Wragg | 59 | 5.4 | -0.1 | |
Majority | 484 | 44.5 | -29.8 | ||
Turnout | 1,087 | 19.5 | +5.0 | ||
Labour hold | Swing | -19.9 | |||
Party | Candidate | Votes | % | ±% | |
---|---|---|---|---|---|
Conservative | D Toon | 1,029 | 39.7 | +0.6 | |
Labour | T Shepherd | 1,027 | 39.6 | -21.3 | |
Liberal Democrats | T Arundell | 536 | 20.7 | +20.7 | |
Majority | 2 | 0.1 | -21.7 | ||
Turnout | 2,592 | 33.6 | +7.5 | ||
Conservative gain from Labour | Swing | +10.9 | |||
Party | Candidate | Votes | % | ±% | |
---|---|---|---|---|---|
Labour | J Unsworth | 900 | 42.7 | +9.8 | |
Liberal Democrats | M Wilkinson | 732 | 34.7 | +34.7 | |
Conservative | D Plotts | 478 | 22.7 | +22.7 | |
Majority | 168 | 8.0 | -26.2 | ||
Turnout | 2,110 | 24.3 | -1.1 | ||
Labour hold | Swing | -12.4 | |||
Party | Candidate | Votes | % | ±% | |
---|---|---|---|---|---|
Labour | H Lavender | 1,103 | 58.9 | -18.0 | |
Liberal Democrats | E Gouthwaite | 604 | 32.3 | +20.6 | |
Conservative | K Leeds | 113 | 6.0 | -1.7 | |
Socialist Labour | O Robinson | 52 | 2.8 | -0.9 | |
Majority | 499 | 26.7 | -38.5 | ||
Turnout | 1,872 | 21.5 | +1.1 | ||
Labour hold | Swing | -19.3 | |||
Party | Candidate | Votes | % | ±% | |
---|---|---|---|---|---|
Independent | M Hall | 813 | 40.8 | +40.8 | |
Labour | C Henshaw | 483 | 24.3 | -46.0 | |
Conservative | J Wilson | 398 | 20.0 | -3.1 | |
Liberal Democrats | D Hutton | 275 | 13.8 | +13.8 | |
Socialist Labour | G Holt | 22 | 1.1 | -5.5 | |
Majority | 330 | 16.6 | -30.6 | ||
Turnout | 1,991 | 27.0 | +7.7 | ||
Independent gain from Labour | Swing | +43.4 | |||
Party | Candidate | Votes | % | ±% | |
---|---|---|---|---|---|
Labour | R Wraith | 781 | 49.1 | -25.6 | |
Liberal Democrats | C Harding | 754 | 47.4 | +35.7 | |
Socialist Alternative | M Forster | 29 | 1.8 | -5.3 | |
Conservative | N Grace | 28 | 1.8 | -4.7 | |
Majority | 27 | 1.7 | -61.3 | ||
Turnout | 1,592 | 31.3 | +12.9 | ||
Labour hold | Swing | -30.6 | |||
Party | Candidate | Votes | % | ±% | |
---|---|---|---|---|---|
Labour | J Wake | 1,244 | 64.5 | -8.4 | |
Liberal Democrats | W Millard | 421 | 21.8 | +11.1 | |
Conservative | H Oldfield | 143 | 7.4 | -1.7 | |
Socialist Alternative | A Waller | 122 | 6.3 | -1.0 | |
Majority | 823 | 42.6 | -19.6 | ||
Turnout | 1,930 | 24.0 | +2.5 | ||
Labour hold | Swing | -9.7 | |||
Party | Candidate | Votes | % | ±% | |
---|---|---|---|---|---|
Labour | F Wright | 1,043 | 51.6 | -23.5 | |
Independent Labour | D Wood | 359 | 17.8 | +17.8 | |
Liberal Democrats | M Newton | 275 | 13.6 | +13.6 | |
Socialist Labour | T Robinson | 221 | 10.9 | -4.1 | |
Conservative | E Elders | 123 | 6.1 | -3.8 | |
Majority | 684 | 33.8 | -26.3 | ||
Turnout | 2,021 | 26.7 | +5.4 | ||
Labour hold | Swing | -20.6 | |||
Party | Candidate | Votes | % | ±% | |
---|---|---|---|---|---|
Labour | T Shepherd | 626 | 72.0 | +2.4 | |
Liberal Democrats | B Martin | 150 | 17.2 | +5.0 | |
Conservative | R Morrell | 93 | 10.7 | +3.0 | |
Majority | 476 | 54.8 | +17.7 | ||
Turnout | 869 | 10.8 | -13.1 | ||
Labour hold | Swing | +4.8 | |||
Party | Candidate | Votes | % | ±% | |
---|---|---|---|---|---|
Independent | S Birkinshaw | 686 | 43.2 | +2.4 | |
Labour | S Henshaw | 407 | 25.6 | +1.3 | |
Liberal Democrats | D Hutton | 286 | 18.0 | +4.2 | |
Conservative | J Wilson | 210 | 13.2 | -6.8 | |
Majority | 279 | 17.6 | +1.0 | ||
Turnout | 1,589 | 21.3 | -5.7 | ||
Independent gain from Labour | Swing | +0.5 | |||
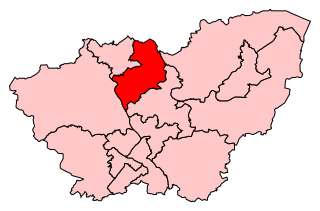
Barnsley East is a constituency in South Yorkshire, represented since 2017 by Stephanie Peacock of the Labour Party.
Kirklees Council is the local authority for the metropolitan borough of Kirklees in West Yorkshire, England. Since the last boundary changes in 2004, the council has comprised 69 councillors representing 23 wards. Elections are held three years out of four, with one third of the councillors elected each time for a four-year term.
Elections to Barnsley Metropolitan Borough Council were held on 7 May 1998. One third of the council was up for election and the Labour party kept overall control of the council.
The 2008 Barnsley Metropolitan Borough Council election took place on 1 May 2008 to elect members of Barnsley Metropolitan Borough Council in South Yorkshire, England. One third of the council, alongside an additional vacancy in Old Town was up for election. Prior to the election the defending councillor in Penistone West, having earlier defected from Conservative to the Barnsley Independent Group, fought the election as an Independent. The Labour party stayed in overall control of the council.
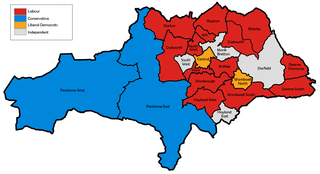
The 2000 Barnsley Metropolitan Borough Council election took place on 4 May 2000 to elect members of Barnsley Metropolitan Borough Council in South Yorkshire, England. Prior to the election, Labour has suffered a by-election loss in South West and two defections to Independent. One third of the council was up for election and the Labour party stayed in overall control of the council.
The 2002 Barnsley Metropolitan Borough Council election took place on 2 May 2002 to elect members of Barnsley Metropolitan Borough Council in South Yorkshire, England. One third of the council was up for election and the Labour party stayed in overall control of the council.
The 2003 Barnsley Metropolitan Borough Council election took place on 1 May 2003 to elect members of Barnsley Metropolitan Borough Council in South Yorkshire, England. One third of the council was up for election and the Labour party stayed in overall control of the council.
The 2006 Barnsley Metropolitan Borough Council election took place on 4 May 2006 to elect members of Barnsley Metropolitan Borough Council in South Yorkshire, England. One third of the council was up for election, with an extra vacancy in Penistone East caused by a resignation, and the Labour party stayed in overall control of the council.
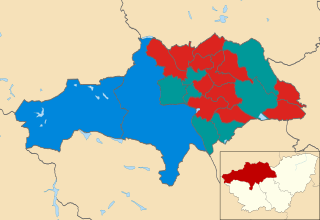
The 2007 Barnsley Metropolitan Borough Council election took place on 3 May 2007 to elect members of Barnsley Metropolitan Borough Council in South Yorkshire, England. One third of the council was up for election and the Labour party stayed in overall control of the council.
Elections to Barnsley Metropolitan Borough Council were held on 5 May 1983. One third of the council was up for election. Prior to the election the defending councillor in Darton had defected to Independent Labour from Residents. The election resulted in Labour retaining control of the council.
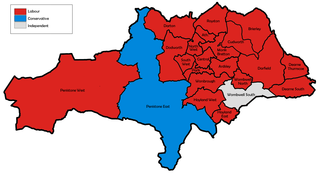
Elections to Barnsley Metropolitan Borough Council were held on 3 May 1984, with one third of the council up for election. Prior to the election, a Residents councillor in Dudsworth had defected to Labour. The election resulted in Labour retaining control of the council.
Elections to Barnsley Metropolitan Borough Council were held on 8 May 1986, with one third of the council up for election as well as vacancies in Athersley and South West wards. Prior to the election Labour gained a seat from Alliance in a Penistone East by-election. The election resulted in Labour retaining control of the council.
Elections to Barnsley Metropolitan Borough Council were held on 7 May 1987, with one third of the council up for election. Prior to the election, the defending councillor in Ardsley had won the seat for Labour in an uncontested by-election and subsequently defected to Independent Labour The election resulted in Labour retaining control of the council.
Elections to Barnsley Metropolitan Borough Council were held on 5 May 1988, with one third of the council and an additional vacancy in Dearne Thurnscoe up for election. Prior to the election, the defending councillor in Darton had defected from Labour to Independent. The election resulted in Labour retaining control of the council.
Elections to Barnsley Metropolitan Borough Council were held on 4 May 1990, with one third of the council up for election. The election resulted in Labour retaining control of the council.
Elections to Barnsley Metropolitan Borough Council were held on 7 May 1992, with one third of the council up for election. The election resulted in Labour retaining control of the council.
Elections to Barnsley Metropolitan Borough Council were held on 5 May 1994, with one third of the council up for election. The election resulted in Labour retaining control of the council.
Elections to Barnsley Metropolitan Borough Council were held on 5 May 1995, with one third of the council up for election. The election resulted in Labour retaining control of the council.
Elections to Barnsley Metropolitan Borough Council were held on 3 May 1996, with one third of the council up for election. The election resulted in Labour retaining control of the council.
The 2022 Barnsley Metropolitan Borough Council election took place on 5 May 2022. One third of councillors — 21 out of 63 — were elected. The election took place alongside the 2022 South Yorkshire mayoral election and other local elections across the United Kingdom.