| |||||||||||||||||
One third of seats (22 of 66) to Barnsley Metropolitan Borough Council 34 seats needed for a majority | |||||||||||||||||
---|---|---|---|---|---|---|---|---|---|---|---|---|---|---|---|---|---|
| |||||||||||||||||
Map showing the results of the 2002 Barnsley council elections. | |||||||||||||||||
|
The 2002 Barnsley Metropolitan Borough Council election took place on 2 May 2002 to elect members of Barnsley Metropolitan Borough Council in South Yorkshire, England. One third of the council was up for election and the Labour party stayed in overall control of the council. [1] [2] [3]
The results saw Labour keep a large majority despite losing seats to independents. [4] Overall turnout in the election was 26%. [5]
Party | Seats | Gains | Losses | Net gain/loss | Seats % | Votes % | Votes | +/− | |
---|---|---|---|---|---|---|---|---|---|
Labour | 17 | 1 | 4 | -3 | 77.3 | 50.7 | 22,043 | +5.1% | |
Independent | 4 | 3 | 1 | +2 | 18.2 | 22.1 | 9,596 | +3.9% | |
Conservative | 1 | 1 | 0 | +1 | 4.5 | 8.2 | 3,547 | -5.9% | |
Liberal Democrats | 0 | 0 | 0 | 0 | 0 | 17.6 | 7,655 | -0.5% | |
Socialist Labour | 0 | 0 | 0 | 0 | 0 | 1.1 | 477 | +0.9% | |
Socialist Alliance | 0 | 0 | 0 | 0 | 0 | 0.4 | 163 | +0.4% | |
This resulted in the following composition of the council: [2] [3] [7]
Party | Previous council | New council | |||
---|---|---|---|---|---|
Labour | 52 | 49 | |||
Independent | 8 | 10 | |||
Conservatives | 3 | 4 | |||
Liberal Democrats | 3 | 3 | |||
Total | 66 | 66 | |||
Working majority | 38 | 32 |
+/- figures represent changes from the last time these wards were contested.
Party | Candidate | Votes | % | ±% | |
---|---|---|---|---|---|
Labour | Karen Dyson | 708 | 46.3 | -18.4 | |
Independent | Trevor Hutchinson | 606 | 39.6 | +39.6 | |
Liberal Democrats | Hazel Harding | 118 | 7.7 | -16.3 | |
Conservative | Marjorie Cale-Morgan | 72 | 4.7 | -6.6 | |
Socialist Labour | Margaret Holderness | 26 | 1.7 | +1.7 | |
Majority | 102 | 6.7 | -34.0 | ||
Turnout | 1,530 | 23.2 | +7.6 | ||
Labour hold | Swing | -29.0 | |||
Party | Candidate | Votes | % | ±% | |
---|---|---|---|---|---|
Labour | Leonard Picken | 759 | 60.8 | +2.1 | |
Independent | Jack Brown | 313 | 25.1 | -2.3 | |
Liberal Democrats | Jean Roberts | 118 | 9.5 | -0.2 | |
Conservative | William Barkworth | 32 | 2.6 | -1.6 | |
Socialist Alliance | James White | 26 | 2.1 | +2.1 | |
Majority | 446 | 35.7 | +4.4 | ||
Turnout | 1,248 | 20.0 | +2.8 | ||
Labour hold | Swing | +2.2 | |||
Party | Candidate | Votes | % | ±% | |
---|---|---|---|---|---|
Independent | Peter Middleton | 838 | 41.8 | +41.8 | |
Labour | Christopher Sykes | 832 | 41.5 | -9.8 | |
Independent | Kenneth Collins | 180 | 9.0 | -19.2 | |
Conservative | Peter Murray | 72 | 3.6 | -7.1 | |
Liberal Democrats | James McCready | 68 | 3.4 | -6.3 | |
Socialist Labour | Olga Robinson | 16 | 0.8 | +0.8 | |
Majority | 6 | 0.3 | -22.8 | ||
Turnout | 2,006 | 30.5 | +8.6 | ||
Independent gain from Labour | Swing | +25.8 | |||
Party | Candidate | Votes | % | ±% | |
---|---|---|---|---|---|
Labour | Michael Stokes | 921 | 48.6 | +9.8 | |
Liberal Democrats | Dawn Jaques | 765 | 40.4 | -14.1 | |
Conservative | Gordon Wilkinson | 103 | 5.4 | -1.3 | |
Socialist Alliance | David Gibson | 68 | 3.6 | +3.6 | |
Socialist Labour | Steven Yoxall | 38 | 2.0 | +2.0 | |
Majority | 156 | 8.2 | -7.4 | ||
Turnout | 1,895 | 23.0 | +2.2 | ||
Labour hold | Swing | +11.9 | |||
Party | Candidate | Votes | % | ±% | |
---|---|---|---|---|---|
Labour | Charles Wraith | 1,343 | 69.5 | +18.8 | |
Independent | Pamela Staley | 341 | 17.7 | -21.4 | |
Liberal Democrats | Riannon Rees | 151 | 7.8 | +2.5 | |
Conservative | Anne Campbell | 96 | 5.0 | +0.2 | |
Majority | 1,002 | 51.9 | +40.6 | ||
Turnout | 1,931 | 25.0 | -2.1 | ||
Labour hold | Swing | +20.1 | |||
Party | Candidate | Votes | % | ±% | |
---|---|---|---|---|---|
Labour | Terence Dixon | 1,109 | 49.1 | +9.5 | |
Independent | Trevor Smith | 874 | 38.7 | -11.7 | |
Liberal Democrats | Teresa Arundel | 131 | 5.8 | +1.1 | |
Conservative | Richard Morrell | 122 | 5.4 | +0.1 | |
Socialist Labour | Eric Mountain | 22 | 1.0 | +1.0 | |
Majority | 235 | 10.4 | -0.5 | ||
Turnout | 2,258 | 28.7 | -2.8 | ||
Labour hold | Swing | +10.6 | |||
Party | Candidate | Votes | % | ±% | |
---|---|---|---|---|---|
Labour | John Parkinson | 1,416 | 54.2 | +2.9 | |
Independent | John Moore | 618 | 23.6 | -1.1 | |
Liberal Democrats | Paul Jaques | 366 | 14.0 | +3.1 | |
Conservative | Michael Toon | 214 | 8.2 | -5.0 | |
Majority | 798 | 30.5 | +3.9 | ||
Turnout | 2,614 | 24.1 | +1.3 | ||
Labour hold | Swing | +2.0 | |||
Party | Candidate | Votes | % | ±% | |
---|---|---|---|---|---|
Labour | Kenneth Sanderson | 1,544 | 54.5 | +1.5 | |
Independent | Peter Stuart | 625 | 22.1 | +22.1 | |
Liberal Democrats | Sharron Brook | 621 | 21.9 | -20.9 | |
Conservative | Mavis Lockwood | 41 | 1.4 | -2.9 | |
Majority | 919 | 32.5 | +22.3 | ||
Turnout | 2,831 | 32.5 | +8.0 | ||
Labour gain from Independent | Swing | -10.3 | |||
Party | Candidate | Votes | % | ±% | |
---|---|---|---|---|---|
Labour | Alan Hancock | 1,289 | 79.0 | +6.2 | |
Liberal Democrats | Michael Newton | 343 | 21.0 | +2.6 | |
Majority | 946 | 58.0 | +3.6 | ||
Turnout | 1,632 | 21.0 | +4.2 | ||
Labour hold | Swing | +1.8 | |||
Party | Candidate | Votes | % | ±% | |
---|---|---|---|---|---|
Labour | Christopher Jenkinson | 1,306 | 55.2 | +31.6 | |
Liberal Democrats | Brian Roberts | 552 | 23.4 | +12.0 | |
Conservative | George Hill | 410 | 17.3 | +3.4 | |
Socialist Labour | Paul Hardman | 96 | 4.1 | +4.1 | |
Majority | 754 | 31.9 | +7.0 | ||
Turnout | 2,364 | 22.3 | +0.6 | ||
Labour hold | Swing | +9.8 | |||
Party | Candidate | Votes | % | ±% | |
---|---|---|---|---|---|
Independent | Dennis Hawkins | 934 | 41.0 | -16.6 | |
Labour | Timothy Shepherd | 876 | 38.4 | +8.2 | |
Liberal Democrats | John Lopscombe | 339 | 14.9 | +8.3 | |
Conservative | Marion Allerton | 103 | 4.5 | -1.1 | |
Socialist Labour | Mary Smith | 28 | 1.2 | +1.2 | |
Majority | 58 | 2.5 | -24.9 | ||
Turnout | 2,280 | 28.4 | +2.0 | ||
Independent gain from Labour | Swing | -12.4 | |||
Party | Candidate | Votes | % | ±% | |
---|---|---|---|---|---|
Labour | James Andrews | 1,075 | 62.6 | +3.0 | |
Liberal Democrats | John Knight | 298 | 17.3 | -7.6 | |
Conservative | Elizabeth Hill | 162 | 9.4 | -6.1 | |
Independent | Kenneth Pickering | 135 | 7.9 | +7.9 | |
Socialist Labour | Geoffrey Pickering | 48 | 2.8 | +2.8 | |
Majority | 777 | 45.2 | +10.5 | ||
Turnout | 1,718 | 26.4 | +3.8 | ||
Labour hold | Swing | +5.3 | |||
Party | Candidate | Votes | % | ±% | |
---|---|---|---|---|---|
Labour | Roy Robinson | 1,020 | 59.2 | +19.0 | |
Independent | Miles Staley | 374 | 21.7 | -24.1 | |
Liberal Democrats | Sally Brook | 181 | 10.5 | +2.2 | |
Conservative | Stuart Wilkinson | 110 | 6.4 | +0.8 | |
Socialist Labour | Maureen Stannard | 39 | 2.3 | +2.3 | |
Majority | 646 | 37.5 | +31.9 | ||
Turnout | 1,724 | 21.1 | -3.1 | ||
Labour hold | Swing | +21.5 | |||
Party | Candidate | Votes | % | ±% | |
---|---|---|---|---|---|
Labour | Philip Davies | 703 | 40.8 | -9.3 | |
Liberal Democrats | Anthony Conway | 468 | 27.2 | +1.2 | |
Independent | William Gaunt | 382 | 22.2 | +22.2 | |
Conservative | Clive Watkinson | 103 | 6.0 | -17.8 | |
Socialist Labour | Philip Thompson | 66 | 3.8 | +3.8 | |
Majority | 235 | 13.6 | -10.5 | ||
Turnout | 1,722 | 25.0 | +6.9 | ||
Labour hold | Swing | -5.2 | |||
Party | Candidate | Votes | % | ±% | |
---|---|---|---|---|---|
Labour | Alice Wade | 568 | 45.3 | -18.0 | |
Independent | Malcolm Price | 339 | 27.0 | +27.0 | |
Liberal Democrats | Pietro Politano | 204 | 16.3 | -8.3 | |
Conservative | Geoffrey Turvey | 74 | 5.9 | -6.2 | |
Socialist Alliance | Susan Wild | 69 | 5.5 | +5.5 | |
Majority | 229 | 18.3 | -20.4 | ||
Turnout | 1,254 | 23.5 | +5.6 | ||
Labour hold | Swing | -22.5 | |||
Party | Candidate | Votes | % | ±% | |
---|---|---|---|---|---|
Conservative | John Smith | 1,107 | 39.9 | -9.1 | |
Labour | Peter Starling | 879 | 31.7 | -1.3 | |
Liberal Democrats | Patrick Hensby | 785 | 28.3 | +10.3 | |
Majority | 228 | 8.2 | -7.8 | ||
Turnout | 2,771 | 34.7 | +3.1 | ||
Conservative gain from Labour | Swing | -3.9 | |||
Party | Candidate | Votes | % | ±% | |
---|---|---|---|---|---|
Independent | George Punt | 1,788 | 68.9 | +68.9 | |
Labour | Linda Hutchinson | 499 | 19.2 | -6.2 | |
Liberal Democrats | Jean Knight | 309 | 11.9 | +3.5 | |
Majority | 1,289 | 49.7 | +19.6 | ||
Turnout | 2,596 | 29.0 | +1.5 | ||
Independent hold | Swing | +37.5 | |||
Party | Candidate | Votes | % | ±% | |
---|---|---|---|---|---|
Labour | Graham Kyte | 1,415 | 67.8 | +16.8 | |
Liberal Democrats | Edward Gouthwaite | 498 | 23.9 | -0.4 | |
Conservative | Kathleen Leeds | 174 | 8.3 | +2.0 | |
Majority | 917 | 43.9 | +17.2 | ||
Turnout | 2,087 | 22.9 | +0.7 | ||
Labour hold | Swing | +8.6 | |||
Party | Candidate | Votes | % | ±% | |
---|---|---|---|---|---|
Independent | Philip Birkinshaw | 1,046 | 54.6 | -9.8 | |
Labour | Robert Hannaghan | 566 | 29.5 | +9.4 | |
Liberal Democrats | Yvonne Marrison | 165 | 8.6 | +1.8 | |
Conservative | John Wilson | 139 | 7.3 | -1.5 | |
Majority | 480 | 25.1 | -19.2 | ||
Turnout | 1,916 | 26.7 | +0.8 | ||
Independent gain from Labour | Swing | -9.6 | |||
Party | Candidate | Votes | % | ±% | |
---|---|---|---|---|---|
Labour | Arthur Hall | 676 | 47.0 | +8.7 | |
Liberal Democrats | Christopher Harding | 519 | 36.1 | -22.8 | |
Independent | Angela Thorp | 203 | 14.1 | +14.1 | |
Conservative | Nancy Cuss | 40 | 2.8 | +0.0 | |
Majority | 157 | 10.9 | -9.6 | ||
Turnout | 1,438 | 29.0 | -1.2 | ||
Labour hold | Swing | +15.7 | |||
Party | Candidate | Votes | % | ±% | |
---|---|---|---|---|---|
Labour | Trevor Naylor | 1,329 | 71.1 | +16.2 | |
Liberal Democrats | William Millard | 352 | 18.8 | +5.7 | |
Conservative | Howard Oldfield | 187 | 10.0 | +1.6 | |
Majority | 977 | 52.3 | +17.4 | ||
Turnout | 1,868 | 23.3 | -1.2 | ||
Labour hold | Swing | +5.2 | |||
Party | Candidate | Votes | % | ±% | |
---|---|---|---|---|---|
Labour | Terence Bristowe | 1,210 | 67.3 | +5.7 | |
Liberal Democrats | Patricia Durie | 304 | 16.9 | +3.2 | |
Conservative | Elizabeth Elders | 186 | 10.3 | +0.1 | |
Socialist Labour | Terence Robinson | 98 | 5.5 | +0.3 | |
Majority | 906 | 50.4 | +2.5 | ||
Turnout | 1,798 | 24.2 | +0.5 | ||
Labour hold | Swing | +1.2 | |||
The Metropolitan Borough of Wirral is a metropolitan borough of Merseyside, in North West England. It has a population of 322,453 (2022), and encompasses 62 square miles (161 km2) of the northern part of the Wirral Peninsula. Major settlements include Birkenhead, Wallasey, Bebington, Heswall, Hoylake and West Kirby. Wirral is England's westernmost metropolitan borough, faced by the city of Liverpool to the northeast over the River Mersey.
The City of Doncaster is a metropolitan borough with city status in South Yorkshire, England. It is named after its principal settlement, Doncaster, and includes the surrounding suburbs of Doncaster as well as numerous towns and villages. The district has large amounts of countryside; at 219 square miles (570 km2), it is the largest metropolitan borough in England by area.
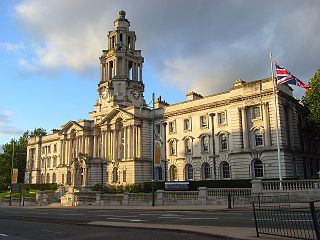
The Metropolitan Borough of Stockport is a metropolitan borough of Greater Manchester in England. It is south-east of central Manchester and south of Tameside. As well as the towns of Stockport, Bredbury and Marple, it includes the outlying villages and suburbs of Hazel Grove, Bramhall, Cheadle, Cheadle Hulme, Gatley, Reddish, Woodley and Romiley. In 2022, it had a population of 297,107, making it the fourth-most populous borough of Greater Manchester.
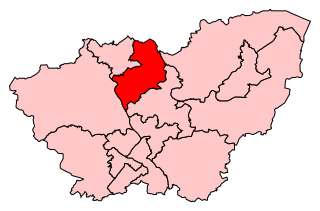
Barnsley East is a constituency in South Yorkshire, represented since 2017 by Stephanie Peacock of the Labour Party.
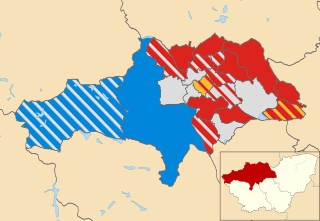
The 2004 Barnsley Metropolitan Borough Council election took place on 10 June 2004 to elect members of Barnsley Metropolitan Borough Council in South Yorkshire, England. The whole council was up for election with boundary changes since the last election in 2003 reducing the number of seats by 3. The Labour party stayed in overall control of the council.
Elections to Barnsley Metropolitan Borough Council were held on 7 May 1998. One third of the council was up for election and the Labour party kept overall control of the council.
Rotherham Metropolitan Borough Council is the local authority for Rotherham in South Yorkshire, England. The council is elected every four years. Since the last boundary changes in 2004, 63 councillors have been elected from 21 wards.
The 2008 Barnsley Metropolitan Borough Council election took place on 1 May 2008 to elect members of Barnsley Metropolitan Borough Council in South Yorkshire, England. One third of the council, alongside an additional vacancy in Old Town was up for election. Prior to the election the defending councillor in Penistone West, having earlier defected from Conservative to the Barnsley Independent Group, fought the election as an Independent. The Labour party stayed in overall control of the council.
This article lists the British National Party's election results in the UK parliamentary, Scottish parliamentary and Welsh Assembly elections, as well as in the European Parliament elections and at a local level.
Redcar and Cleveland Borough Council is the local authority for the unitary authority of Redcar and Cleveland in North Yorkshire, England. Until 1 April 1996 it was a non-metropolitan district in Cleveland, called Langbaurgh.
The 2010 Barnsley Metropolitan Borough Council election took place on 6 May 2010 to elect members of Barnsley Metropolitan Borough Council in South Yorkshire, England. One third of the council was up for election and the Labour party stayed in overall control of the council.
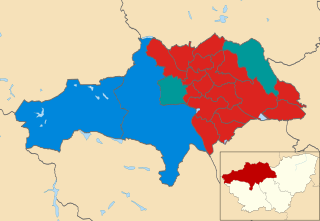
The 2011 Barnsley Metropolitan Borough Council election took place on 5 May 2011 to elect members of Barnsley Metropolitan Borough Council in South Yorkshire, England. One third of the council was up for election and the Labour party stayed in overall control of the council.
The 1999 Barnsley Metropolitan Borough Council election took place on 6 May 1999 to elect members of Barnsley Metropolitan Borough Council in South Yorkshire, England. Prior to the election, the Liberal Democrats had gained a seat in Wombwell North from Labour. One third of the council was up for election and the Labour party stayed in overall control of the council.
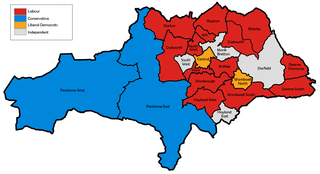
The 2000 Barnsley Metropolitan Borough Council election took place on 4 May 2000 to elect members of Barnsley Metropolitan Borough Council in South Yorkshire, England. Prior to the election, Labour has suffered a by-election loss in South West and two defections to Independent. One third of the council was up for election and the Labour party stayed in overall control of the council.
The 2003 Barnsley Metropolitan Borough Council election took place on 1 May 2003 to elect members of Barnsley Metropolitan Borough Council in South Yorkshire, England. One third of the council was up for election and the Labour party stayed in overall control of the council.
The 2006 Barnsley Metropolitan Borough Council election took place on 4 May 2006 to elect members of Barnsley Metropolitan Borough Council in South Yorkshire, England. One third of the council was up for election, with an extra vacancy in Penistone East caused by a resignation, and the Labour party stayed in overall control of the council.
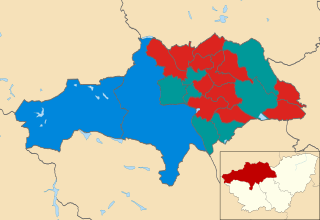
The 2007 Barnsley Metropolitan Borough Council election took place on 3 May 2007 to elect members of Barnsley Metropolitan Borough Council in South Yorkshire, England. One third of the council was up for election and the Labour party stayed in overall control of the council.
The 2002 Walsall Metropolitan Borough Council election took place on 2 May 2002 to elect members of Walsall Metropolitan Borough Council in the West Midlands, England. One third of the council was up for election and the council stayed under no overall control.
Barnsley Metropolitan Borough Council is the local authority of the Metropolitan Borough of Barnsley in South Yorkshire, England. Barnsley is a metropolitan borough, one of four in South Yorkshire, and provides the majority of local government services in Barnsley. The council is a constituent member of the South Yorkshire Mayoral Combined Authority.
Wirral Council is the local authority of the Metropolitan Borough of Wirral in Merseyside, England. Wirral is a metropolitan borough, one of five in Merseyside, and provides the majority of local government services in Wirral. The council is a constituent member of the Liverpool City Region Combined Authority.