![]() | |||||||||||||||||
| |||||||||||||||||
All 38 seats to Havant Borough Council 20 seats needed for a majority | |||||||||||||||||
---|---|---|---|---|---|---|---|---|---|---|---|---|---|---|---|---|---|
| |||||||||||||||||
![]() Results by Ward | |||||||||||||||||
|
The 2002 Havant Borough Council election took place on 2 May 2002 to elect members of Havant Borough Council in Hampshire, England. The whole council was up for election after boundary changes reduced the number of seats by 4. [1] The Conservative Party gained overall control of the council from no overall control. [2]
The Conservatives won a majority on the council, taking 23 of the 38 seats on the council. [3] Labour dropped from 11 to 9 seats, while the Liberal Democrats fell to 6 seats from 8 previously. [3] The 3 Independent councillors had stood down at the election, while the boundary changes were reported to have cost Labour 4 seats. [3] Turnout was up on the 2000 election, but dropped to a low of just 14.6% in Warren Park ward. [3]
Party | Seats | Gains | Losses | Net gain/loss | Seats % | Votes % | Votes | +/− | |
---|---|---|---|---|---|---|---|---|---|
Conservative | 23 | +3 | 60.5 | 52.6 | 34,315 | +2.4% | |||
Labour | 9 | -2 | 23.7 | 19.7 | 12,822 | +3.8% | |||
Liberal Democrats | 6 | -2 | 15.8 | 24.1 | 15,693 | -5.2% | |||
Green | 0 | 0 | 0 | 3.2 | 2,077 | +3.2% | |||
Independent | 0 | -3 | 0 | 0.4 | 289 | -4.0% | |||
Party | Candidate | Votes | % | ±% | |
---|---|---|---|---|---|
Labour | Ralph Cousins | 416 | |||
Labour | Ronald Hoyle | 406 | |||
Liberal Democrats | Peter Lake | 235 | |||
Conservative | Sheila Culley | 195 | |||
Conservative | Carol Wynne | 164 | |||
Turnout | 1,416 | 18.9 |
Party | Candidate | Votes | % | ±% | |
---|---|---|---|---|---|
Labour | June Hanan | 529 | |||
Labour | Paul Hansford | 476 | |||
Conservative | Jane Rayner | 267 | |||
Conservative | Ian Beagley | 238 | |||
Liberal Democrats | Cecil Sargent | 212 | |||
Turnout | 1,722 | 20.3 |
Party | Candidate | Votes | % | ±% | |
---|---|---|---|---|---|
Liberal Democrats | Ronald Bellinger | 1,408 | |||
Liberal Democrats | Stephen Marshall | 1,224 | |||
Liberal Democrats | Anthony Welch | 1,134 | |||
Conservative | Kenneth Harris | 1,127 | |||
Conservative | Angela Guest | 1,111 | |||
Conservative | Mark Ward | 1,066 | |||
Labour | William Fish | 285 | |||
Labour | Carl Roberts | 258 | |||
Labour | John Jackson | 254 | |||
Green | Terry Mitchell | 140 | |||
Turnout | 8,007 | 40.9 |
Party | Candidate | Votes | % | ±% | |
---|---|---|---|---|---|
Labour | Barry Gardner | 803 | |||
Labour | Terence Hart | 741 | |||
Conservative | Mary Brown | 226 | |||
Conservative | Jennifer Wride | 209 | |||
Liberal Democrats | Valerie Gatenby | 187 | |||
Turnout | 2,166 | 23.6 |
Party | Candidate | Votes | % | ±% | |
---|---|---|---|---|---|
Conservative | Anthony Briggs | 1,170 | |||
Conservative | David Keast | 1,056 | |||
Conservative | Marjorie Smallcorn | 999 | |||
Liberal Democrats | Valerie Hartridge | 961 | |||
Liberal Democrats | Flora Ponsonby | 766 | |||
Turnout | 4,952 | 27.9 |
Party | Candidate | Votes | % | ±% | |
---|---|---|---|---|---|
Conservative | David Gillett | 1,842 | |||
Conservative | David Colson | 1,788 | |||
Conservative | Virginia Wilson-Smith | 1,727 | |||
Liberal Democrats | Hugh Benzie | 1,056 | |||
Liberal Democrats | Gillian Cosslett | 849 | |||
Liberal Democrats | John Cosslett | 803 | |||
Labour | Anna Fitter | 429 | |||
Labour | William Gilchrist | 412 | |||
Labour | Phillip Rees | 308 | |||
Green | Michael Wood | 243 | |||
Turnout | 9,457 | 42.8 |
Party | Candidate | Votes | % | ±% | |
---|---|---|---|---|---|
Liberal Democrats | Ronald Purkis | 896 | |||
Liberal Democrats | Sheila Troke | 875 | |||
Conservative | Leonard Shaw | 800 | |||
Conservative | Jacqueline Branson | 758 | |||
Liberal Democrats | Christine Pylee | 750 | |||
Conservative | Gopa Chakrabarti | 673 | |||
Independent | Kevin Ratcliffe | 289 | |||
Turnout | 5,041 | 25.0 |
Party | Candidate | Votes | % | ±% | |
---|---|---|---|---|---|
Conservative | Gordon Erlebach | 1,381 | |||
Conservative | David Collins | 1,311 | |||
Conservative | Sheila Pearce | 1,311 | |||
Labour | Michael Clarke | 561 | |||
Labour | Lesley Marsden | 519 | |||
Labour | Sheila Mealy | 500 | |||
Liberal Democrats | John Clouting | 355 | |||
Green | Frederick Gibson | 289 | |||
Turnout | 6,227 | 32.8 |
Party | Candidate | Votes | % | ±% | |
---|---|---|---|---|---|
Conservative | Francis Pearce | 1,590 | |||
Conservative | Victor Pierce-Jones | 1,565 | |||
Conservative | David Weymouth | 1,426 | |||
Labour | Susan Underwood | 433 | |||
Labour | Graham Manning | 425 | |||
Labour | Andrew Stacey | 409 | |||
Liberal Democrats | Jill Allum | 390 | |||
Green | Gillian Leek | 286 | |||
Turnout | 6,524 | 34.6 |
Party | Candidate | Votes | % | ±% | |
---|---|---|---|---|---|
Conservative | Gwendoline Blackett | 1,500 | |||
Conservative | David Farrow | 1,413 | |||
Conservative | Hilary Farrow | 1,312 | |||
Labour | William Wheeler | 485 | |||
Labour | Howard Sherlock | 478 | |||
Liberal Democrats | Rodney Crawford | 467 | |||
Labour | Nicola Sherlock | 458 | |||
Turnout | 6,113 | 30.8 |
Party | Candidate | Votes | % | ±% | |
---|---|---|---|---|---|
Conservative | June Fulcher | 1,531 | |||
Conservative | David Guest | 1,393 | |||
Conservative | Raymond Bolton | 1,389 | |||
Liberal Democrats | Dennis West | 949 | |||
Liberal Democrats | Liam Hutchings | 926 | |||
Green | Timothy Dawes | 726 | |||
Liberal Democrats | Roy Middleton | 692 | |||
Labour | Beryl Francis | 430 | |||
Labour | Alan Price | 341 | |||
Labour | Derek Smith | 279 | |||
Turnout | 8,656 | 45.4 |
Party | Candidate | Votes | % | ±% | |
---|---|---|---|---|---|
Conservative | Olwyn Kennedy | 747 | |||
Conservative | Nigel Tarrant | 688 | |||
Labour | Margaret Beauvoisin | 634 | |||
Liberal Democrats | Leslie Voice | 428 | |||
Green | Kevin Jacks | 393 | |||
Labour | Kim Vassallo | 385 | |||
Labour | Ronald Russell | 379 | |||
Turnout | 3,654 | 21.4 |
Party | Candidate | Votes | % | ±% | |
---|---|---|---|---|---|
Labour | Richard Brown | 407 | |||
Labour | Virginia Steel | 382 | |||
Conservative | Thelma Carpenter | 178 | |||
Conservative | Clive Colson | 164 | |||
Liberal Democrats | Michael Ponsonby | 130 | |||
Turnout | 1,261 | 14.6 |
Party | Candidate | Votes | % | ±% | |
---|---|---|---|---|---|
Liberal Democrats | Catherine Cole | unopposed | |||
Conservative | Kenneth Moss | unopposed | |||
Conservative | Geoffrey Tart | unopposed | |||
The 2004 Wokingham District Council election took place on 10 June 2004 to elect members of Wokingham Unitary Council in Berkshire, England. The whole council was up for election with boundary changes since the last election in 2003. The Conservative Party stayed in overall control of the council.
The 2002 Fareham Council election took place on 2 May 2002 to elect members of Fareham Borough Council in Hampshire, England. The whole council was up for election with ward boundary changes since the last election in 2000 reducing the number of seats by 11. The Conservative Party stayed in overall control of the council.
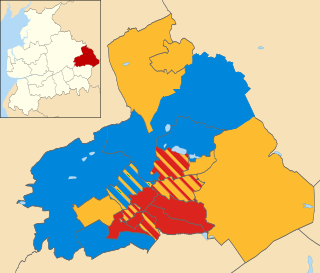
The 2004 Solihull Metropolitan Borough Council election took place on 10 June 2004 to elect members of Solihull Metropolitan Borough Council in the West Midlands, England. The whole council was up for election with boundary changes since the last election in 2003. The Conservative Party stayed in overall control of the council.
The 2002 Harrogate Council election took place on 2 May 2002 to elect members of Harrogate Borough Council in North Yorkshire, England. The whole council was up for election with boundary changes since the last election in 2000 reducing the number of seats by 5. The Liberal Democrats lost overall control of the council to no overall control.
The 2002 Pendle Borough Council election took place on 2 May 2002 to elect members of Pendle Borough Council in Lancashire, England. The whole council was up for election with boundary changes since the last election in 2000 reducing the number of seats by 2. The council stayed under no overall control.
The 2004 Sandwell Metropolitan Borough Council election took place on 10 June 2004 to elect members of Sandwell Metropolitan Borough Council in the West Midlands, England. The whole council was up for election with boundary changes since the last election in 2003. The Labour Party stayed in overall control of the council.
The 2002 Basingstoke and Deane Council election took place on 2 May 2002 to elect members of Basingstoke and Deane Borough Council in Hampshire, England. The whole council was up for election with boundary changes since the last election in 2000 increasing the number of seats by 3. The council stayed under no overall control.
The 2002 Islington Council election took place on 2 May 2002 to elect members of Islington London Borough Council in London, England. The whole council was up for election with boundary changes since the last election in 1998 reducing the number of seats by 4. The Liberal Democrats stayed in overall control of the council.
The 2000 Havant Borough Council election took place on 4 May 2000 to elect members of Havant Borough Council in Hampshire, England. One third of the council was up for election and the council stayed under no overall control.
The 2003 Havant Borough Council election took place on 1 May 2003 to elect members of Havant Borough Council in Hampshire, England. One third of the council was up for election and the Conservative Party stayed in overall control of the council.
The 2004 Havant Borough Council election took place on 10 June 2004 to elect members of Havant Borough Council in Hampshire, England. One third of the council was up for election and the Conservative Party stayed in overall control of the council.
The 2006 Havant Borough Council election took place on 4 May 2006 to elect members of Havant Borough Council in Hampshire, England. One third of the council was up for election and the Conservative Party stayed in overall control of the council.
The 2007 Havant Borough Council election took place on 3 May 2007 to elect members of Havant Borough Council in Hampshire, England. One third of the council was up for election and the Conservative Party stayed in overall control of the council.
The 2008 Havant Borough Council election took place on 1 May 2008 to elect members of Havant Borough Council in Hampshire, England. One third of the council was up for election and the Conservative Party stayed in overall control of the council.
The 2010 Havant Borough Council election took place on 6 May 2010 to elect members of Havant Borough Council in Hampshire, England. One third of the council was up for election and the Conservative Party stayed in overall control of the council.
The 2011 Havant Borough Council election took place on 5 May 2011 to elect members of Havant Borough Council in Hampshire, England. One third of the council was up for election and the Conservative Party stayed in overall control of the council.
The 2012 Havant Borough Council election took place on 3 May 2012 to elect members of Havant Borough Council in Hampshire, England. One third of the council was up for election and the Conservative Party stayed in overall control of the council.
The 2014 Havant Borough Council election took place on 22 May 2014 to elect members of Havant Borough Council in Hampshire, England. One third of the council was up for election and the Conservative Party stayed in overall control of the council.
The 2002 Brent London Borough Council election took place on 2 May 2002 to elect members of Brent London Borough Council in London, England. The whole council was up for election with boundary changes since the last election in 1998 reducing the number of seats by 3. The Labour Party stayed in overall control of the council.
The 2018 United Kingdom local elections were held on Thursday 3 May 2018, with local council elections taking place in all 32 London boroughs, 34 metropolitan boroughs, 67 district and borough councils and 17 unitary authorities. There were also direct elections for the mayoralties of Hackney, Lewisham, Newham, Tower Hamlets and Watford.