2013 Hampshire County Council election

Last updated

2013 Hampshire County Council election
County Flag of Hampshire.svg
  2009 2 May 2013 2017  

All 78 seats to Hampshire County Council
40 seats needed for a majority
 First partySecond party
 
Party Conservative Liberal Democrats
Seats won4517
Seat changeDecrease2.svg6Decrease2.svg7
Popular vote124,88672,273
Percentage37.5121.71
SwingDecrease2.svg10.21ppDecrease2.svg11.18pp

 Third partyFourth party
 
Party UKIP Labour
Seats won104
Seat changeIncrease2.svg10Increase2.svg3
Popular vote81,93035,228
Percentage24.6110.58
SwingIncrease2.svg18.69ppIncrease2.svg3.51pp

Hampshire UK local election 2013 map.svg
Map showing the results of the 2013 Hampshire County Council election. Striped electoral divisions have mixed representation.

Council control before election

Conservative

Council control after election

Conservative

An election to Hampshire County Council took place on 2 May 2013 as part of the 2013 United Kingdom local elections. [1] 78 councillors were elected from 75 electoral divisions, which returned either one or two county councillors each by first-past-the-post voting for a four-year term of office. The electoral divisions were the same as those of the previous election in 2009. No elections were held in Portsmouth and Southampton, which are unitary authorities outside the area covered by the County Council. The election saw the Conservative Party retain overall control of the council, with a reduced majority of five councillors.

Contents

All locally registered electors (British, Irish, Commonwealth and European Union citizens) who were aged 18 or over on Thursday 2 May 2013 were entitled to vote in the local elections. Those who were temporarily away from their ordinary address (for example, away working, on holiday, in student accommodation or in hospital) were also entitled to vote in the local elections, [2] although those who had moved abroad and registered as overseas electors cannot vote in the local elections. It is possible to register to vote at more than one address (such as a university student who had a term-time address and lives at home during holidays) at the discretion of the local Electoral Register Office, but it remains an offence to vote more than once in the same local government election. [3]

Summary

The elections saw the Conservative Party retain overall control of the council, though with their majority reduced from 24 seats to five. The largest opposition party continued to be the Liberal Democrats, despite a net loss of seven seats. Having been reduced to just one seat in the previous election, the Labour Party gained three more seats including two which had been lost in 2009. The election saw an electoral breakthrough by the UK Independence Party, who won their first seats on the council and became the third-largest party.

The local Community Campaign in Hart successfully defended its councillor's seat in Church Crookham and Ewshot, which was the only seat it fought. An independent candidate gained a seat in Lymington from the Conservatives. Alan Weeks, the sole Green Party incumbent who had defected from the Liberal Democrats, lost his Totton North seat to UKIP.

Candidates

The Conservatives and Labour both obtained local nominations for all divisions, while UKIP had no candidates in six divisions and the Liberal Democrats had no candidate in one. The Green Party fielded 30 candidates, six short of half of the council divisions. The next highest total share of votes was won by the six independent candidates. None of the other parties, local or national achieved more than 0.71% of the vote.

Results

Hampshire County Council election, 2013 [4]
PartySeatsGainsLossesNet gain/lossSeats %Votes %Votes+/−
  Conservative 4539657.6937.51124,88610.21%
  Liberal Democrats 1718721.7921.7172,27311.18%
  UKIP 10100+1012.8224.6181,930+18.69%
  Labour 430+35.1310.5835,228 [lower-alpha 1] +3.51%
  Independent 110+11.281.896,292 [lower-alpha 2] 0.46%
  CCH 10001.280.712,3670.24%
  Green 001102.789,247+1.06%
  BNP 000000.092830.25%
  Christian 000000.06191N/A
  TUSC 000000.04117N/A
  Monster Raving Loony 000000.0392N/A
  English Democrat 0000000 [lower-alpha 3] 1.04%
  1. Includes Labour Co-op
  2. Includes 'No Party'
  3. No candidates stood in 2013

Results by electoral division

Hampshire County Council is divided into 11 districts, which are split further into electoral divisions.

Basingstoke and Deane (10 seats)

Basingstoke and Deane Basingstoke and Deane UK locator map.svg
Basingstoke and Deane
Basingstoke Central
PartyCandidateVotes%±%
Labour Criss Connor140836.83
UKIP Duncan Stone99826.11
Liberal Democrats John Shaw72919.07
Conservative Laura Edwards68818.00
Majority
Turnout
Labour gain from Liberal Democrats Swing
Basingstoke North
PartyCandidateVotes%±%
Labour Jane Frankum181354.54
UKIP Michael Tatam83925.24
Conservative John Holley48214.50
Liberal Democrats Doris Jones1905.72
Majority
Turnout
Labour hold Swing
Basingstoke North West
PartyCandidateVotes%±%
Conservative Stephen Reid118637.98
Labour Sean Keating103733.21
UKIP Harold Robinson79425.42
Liberal Democrats Richard Whitechurch1063.39
Majority
Turnout
Conservative hold Swing
Basingstoke South East
PartyCandidateVotes%±%
Liberal Democrats Brian Gurden127834.66
UKIP David Watson98426.69
Labour David Eyre82322.32
Conservative Ian Smith60216.33
Majority
Turnout
Liberal Democrats hold Swing
Basingstoke South West
PartyCandidateVotes%±%
Conservative Rita Burgess188249.06
UKIP Philip Heath112729.38
Labour Paul Frankum50813.24
Liberal Democrats Madeline Hussey3198.32
Majority
Turnout
Conservative hold Swing
Calleva and Kingsclere
PartyCandidateVotes%±%
Conservative Keith Chapman244257.91
UKIP Stan Oram91821.77
Labour John Rodway47911.36
Liberal Democrats Janice Spalding3788.96
Majority
Turnout
Conservative hold Swing
Candovers
PartyCandidateVotes%±%
Conservative Anna McNair Scott167439.57
UKIP Peter Johnson100823.82
Independent Ian Tilbury100223.68
Labour Yegor Ryazanov2896.83
Liberal Democrats Jeff Teagle2586.10
Majority
Turnout
Conservative hold Swing
Loddon
PartyCandidateVotes%±%
Conservative Elaine Still212049.56
UKIP Alan Stone111426.04
Independent Genni Touzin3899.09
Labour George Severs3798.86
Liberal Democrats Stephen Day2766.45
Majority
Turnout
Conservative hold Swing
Tadley and Baughurst
PartyCandidateVotes%±%
Liberal Democrats Warwick Lovegrove132636.39
Conservative Marilyn Tucker116331.92
UKIP Stephen West92425.36
Labour Stephen Rothman2316.34
Majority
Turnout
Liberal Democrats gain from Conservative Swing
Whitchurch and Clere
PartyCandidateVotes%±%
Conservative Tom Thacker184449.20
UKIP George Garton86523.08
Liberal Democrats Steven Neilson70418.78
Labour David Foden3358.94
Majority
Turnout
Conservative hold Swing

East Hampshire (7 seats)

East Hampshire East Hampshire UK locator map.svg
East Hampshire
Alton Rural
PartyCandidateVotes%±%
Conservative Mark Kemp-Gee276256.04
UKIP Rigby Andrews118824.10
Liberal Democrats Maureen Comber55011.16
Labour Jan Treacher4298.70
Majority
Turnout 492935.378.00
Conservative hold Swing
Alton Town
PartyCandidateVotes%±%
Conservative Andrew Joy171543.11
UKIP Andrew Walters95524.01
Liberal Democrats Diane McKay79920.09
Labour Barbara Burfoot50912.80
Majority
Turnout 397829.645.36
Conservative hold Swing
Bordon, Whitehill and Lindford
PartyCandidateVotes%±%
Liberal Democrats Adam Carew114143.20
UKIP Don Jerrard80230.37
Conservative Ken Carter50118.97
Labour Keith Budden1977.46
Majority
Turnout 264122.784.99
Liberal Democrats hold Swing
Catherington
PartyCandidateVotes%±%
Conservative Marge Harvey172543.49%
UKIP David Alexander96424.31%
Liberal Democrats Steve Protheroe84921.41%
Labour Katie Green2536.38%
Green Caroline Footman1754.41%
Majority
Turnout 396631.619.91
Conservative gain from Liberal Democrats Swing
Headley
PartyCandidateVotes%±%
Conservative Ferris Cowper212057.04
UKIP Derrick Ismay89324.02
Liberal Democrats Michael Croucher3719.98
Labour John Tough3338.96
Majority
Turnout 371728.496.80
Conservative hold Swing
Petersfield Butser
PartyCandidateVotes%±%
Conservative John West161838.71
UKIP Steve Marston94022.49
Liberal Democrats Byron Grainger-Jones87720.98
Labour Bill Organ3869.23
Green Bill Enstone3598.59
Majority
Turnout 418031.567.53
Conservative hold Swing
Petersfield Hangers
PartyCandidateVotes%±%
Conservative Vaughan Clarke215053.05
UKIP Stephen Coles77519.12
Liberal Democrats Roger Mullenger46511.47
Labour Co-op Howard Linsley3739.20
Green Adam Harper2907.16
Majority
Turnout 405334.596.90
Conservative hold Swing

Eastleigh (7 seats)

[5]

Eastleigh Eastleigh UK locator map.svg
Eastleigh
Bishopstoke and Fair Oak
PartyCandidateVotes%±%
UKIP Martin Lyon182440.1525.71
Liberal Democrats Angela Roling165736.47-10.63
Conservative Colin Atterbury65614.44-12.96
Labour Mary Shephard4068.941.71
Majority1673.68
Turnout 454333.64-3.48
UKIP gain from Liberal Democrats Swing
Botley and Hedge End
PartyCandidateVotes%±%
Liberal Democrats Rupert Kyrle180636.01-12.07
UKIP Steve Robinson-Grindey165232.9422.21
Conservative Ian Bennett126325.18-13.3
Labour Andrew Helps2945.863.15
Majority1543.07
Turnout 501534.61-9.12
Liberal Democrats hold Swing
Chandler’s Ford
PartyCandidateVotes%±%
Conservative Colin Davidovitz191939.08-12.21
Liberal Democrats James Duguid155731.7-2.88
UKIP John Edwards107321.8511.57
Labour Beryl Addison2384.850.99
Green Joe Cox1242.522.52
Majority3627.37-9.34
Turnout 491140.17-6.6
Conservative hold Swing
Eastleigh East
PartyCandidateVotes%±%
UKIP Andy Moore160938.93+18.98
Liberal Democrats Christopher Thomas144034.8410.56
Conservative Michael Read45410.9812.26
Labour Chris Gilkes43610.550.86
Green Angela Cotton1383.34+3.34
Christian Kevin Milburn561.35+1.35
Majority1694.09
Turnout 413332.060.90
UKIP gain from Liberal Democrats Swing
Eastleigh West
PartyCandidateVotes%±%
UKIP Chris Greenwood160435.3818.9
Liberal Democrats Alan Broadhurst153333.82-12.38
Conservative Andy Milligan69414.54-11.28
Labour James Penders57912.771.28
Green Stuart Jebbitt1072.362.36
Monster Raving Loony Hopping Mad Hog290.640.64
TUSC Ania Waterman220.490.49
Majority711.57
Turnout 453329.83-2.43
UKIP gain from Liberal Democrats Swing
Hamble
PartyCandidateVotes%±%
Liberal Democrats Keith House194142.51-10.99
UKIP Chris Martin140230.7117.18
Conservative Elizabeth Lear96921.22-8.3
Labour Chris Rogers2545.562.11
Majority53911.8
Turnout 456631.44-6.85
Liberal Democrats hold Swing
West End and Hedge End Grange Park
PartyCandidateVotes%±%
Liberal Democrats Bruce Tennent152040.43-11.97
UKIP Sarah Lyon126133.5421.65
Conservative Paul Redding74219.73-11.37
Labour Pete Luffman2376.31.69
Majority2596.89
Turnout 376026.28-8.09
Liberal Democrats hold Swing

Fareham (7 seats)

Fareham Fareham UK locator map.svg
Fareham
Fareham Crofton
PartyCandidateVotes%±%
UKIP Christopher Wood269150.39+42.26
Conservative Tim Knight176433.0325.44
Liberal Democrats Jim Forrest69713.0511.39
Labour Leslie Ricketts1883.52+0.29
Majority92717.36
Turnout 534045.410.95
UKIP gain from Conservative Swing +33.85
Fareham Portchester
PartyCandidateVotes%±%
Liberal Democrats Roger Price241055.92
Conservative Raymond Ellis114526.57
Labour Stuart Rose4309.98
Green John Vivian3257.54
Majority
Turnout 431029.5311.75
Liberal Democrats hold Swing
Fareham Sarisbury
PartyCandidateVotes%±%
Conservative Sean Woodward195770.29
Labour Angela Carr43415.59
Liberal Democrats Mary Holliday-Bishop39314.12
Majority
Turnout 278423.8413.22
Conservative hold Swing
Fareham Titchfield
PartyCandidateVotes%±%
Conservative Geoffrey Hockley160251.33
Independent Jack Englefield91729.38
Labour Michael Prior34711.12
Liberal Democrats Sue Hardie2558.17
Majority
Turnout 312126.5313.86
Conservative hold Swing
Fareham Town (2)
PartyCandidateVotes%±%
Conservative Peter Latham280216.88
Conservative George Ringrow268616.18
UKIP Bob Ingram251715.16
UKIP David Whittingham220713.30'
Liberal Democrats Paul Whittle202812.22
Liberal Democrats David Norris193311.65
Labour James Carr8044.84
Labour Richard Ryan7374.44
Green Dilys Harrison4702.83
Green David Harrison4152.50
Turnout 869230.788.96
Conservative hold Swing
Fareham Warsash
PartyCandidateVotes%±%
Conservative Keith Evans204160.05
UKIP David Nightingale73121.51
Labour Andrew Mooney2507.36
Green Miles Grindey2166.35
Liberal Democrats Craig Lewis1614.74
Majority
Turnout 339930.2710.79
Conservative hold Swing

Gosport (5 seats)

Gosport Gosport UK locator map.svg
Gosport
Bridgemary
PartyCandidateVotes%±%
Labour Shaun Cully135839.15
Conservative Mike Geddes103529.84
UKIP Patrick Bergin92726.72
Liberal Democrats Stephen Pinder1173.37
BNP Christopher Caffin320.92
Majority
Turnout 346927.644.07
Labour gain from Conservative Swing
Hardway
PartyCandidateVotes%±%
Liberal Democrats Peter Chegwyn122042.69
Conservative Debbie Grant94132.93
UKIP Malik Azam43315.15
Labour Alan Durrant2649.24
Majority
Turnout 285825.215.16
Liberal Democrats hold Swing
Lee
PartyCandidateVotes%±%
Conservative Graham Burgess199460.01
UKIP Curtis Sinclair76022.87
Labour Jill Whitcher2938.82
Liberal Democrats Paul Keeley1584.75
Green Graham Smith1183.55
Majority
Turnout 332324.744.94
Conservative hold Swing
Leesland and Town (2)
PartyCandidateVotes%±%
Conservative Peter Edgar339628.97
Conservative Christopher Carter279523.84
UKIP Tim Apps216818.50
Labour Micheal Madgwick8297.07
Liberal Democrats Robert Hylands7966.79
Liberal Democrats Austin Hicks7716.58
Green Terry Mitchell5094.34
BNP Gavin Miller2512.14
Labour John Train2071.77
Turnout 668226.428.13
Conservative hold Swing

Hart (5 seats)

Hart Hart UK locator map.svg
Hart
Church Crookham and Ewshot
PartyCandidateVotes%±%
CCH John Bennison236754.48
Conservative Wallace Vincent116726.86
UKIP Nigel Johnson57913.33
Labour Ruth Williams2325.34
Majority
Turnout 434532.5412.12
CCH hold Swing
Fleet
PartyCandidateVotes%±%
Conservative Sharyn Wheale230944.52
Independent Alan Oliver175733.88
UKIP Christine Forrester62912.13
Liberal Democrats Neil Walton2344.51
Labour Vera Nabbs1943.74
Monster Raving Loony Howling Laud Hope 631.21
Majority
Turnout 518632.936.43
Conservative hold Swing
Hartley Wintney, Eversley and Yateley West
PartyCandidateVotes%±%
Liberal Democrats David Simpson201442.73
Conservative Tim Southern162434.46
UKIP John Howe83317.67
Labour Joyce Still2425.13
Majority
Turnout 471333.648.10
Liberal Democrats hold Swing
Odiham
PartyCandidateVotes%±%
Conservative Jonathan Glen215661.42
UKIP Ann Williams77021.94
Liberal Democrats Graham Cockarill2928.32
Labour John Davies2928.32
Majority
Turnout 351025.9113.21
Conservative hold Swing
Yateley East, Blackwater and Ancells
PartyCandidateVotes%±%
Liberal Democrats Adrian Collett217858.55
Conservative Shawn Dickens73319.70
UKIP Stanley Tennison59816.08
Labour Co-op Les Lawrie2115.67
Majority
Turnout 372027.118.86
Liberal Democrats hold Swing

Havant (7 seats)

Havant Havant UK locator map.svg
Havant
Bedhampton and Leigh Park (2)
PartyCandidateVotes%±%
UKIP Ray Finch 176015.19
Conservative Liz Fairhurst165514.29
UKIP Stephen Harris162914.06
Liberal Democrats Ann Brown148812.85
Conservative Diana Patrick145412.55
Liberal Democrats Faith Ponsonby132211.41
Labour Anthony Berry10068.69
Labour Simon Vassallo7556.69
Green Martin Lewis3262.81
No PartyChristopher Gould1681.45
Turnout 610522.635.92
UKIP gain from Liberal Democrats Swing
Conservative hold Swing
Cowplain and Hart Plain
PartyCandidateVotes%±%
Conservative David Keast137745.09
UKIP Alex Bowers93830.71
Labour Ken Monks37212.18
Liberal Democrats Terry Port1936.32
Green Bruce Holman1745.70
Majority
Turnout 305425.228.02
Conservative hold Swing
Emsworth and St. Faiths
PartyCandidateVotes%±%
Conservative Ray Bolton220242.72
UKIP Ian Reddoch116722.64
Green Tim Dawes77815.10
Labour Christine Armitage63612.34
Liberal Democrats Roisin Miller3717.20
Majority
Turnout 515434.0111.13
Conservative hold Swing
Hayling Island
PartyCandidateVotes%±%
Conservative Frank Pearce192142.90
UKIP John Perry161836.13
Labour Michael Clarke48210.76
Green Paul Valentine2164.82
Liberal Democrats Anne Martin1994.44
No PartyGene Cann420.94
Majority
Turnout 447831.117.73
Conservative hold Swing
Purbrook and Stakes South
PartyCandidateVotes%±%
Conservative Robin McIntosh105137.39
UKIP Gary Kerrin100335.68
Labour Munazza Faiz50718.04
Liberal Democrats Ann Bazley2508.89
Majority
Turnout 281122.418.06
Conservative hold Swing
Waterloo and Stakes North
PartyCandidateVotes%±%
Conservative Ann Briggs142342.57
UKIP William Farnham108532.46
Labour Howard Sherlock39311.76
Liberal Democrats Elaine Woodard2236.67
Green Owen Plunkett2196.55
Majority
Turnout 334325.397.97
Conservative hold Swing

New Forest (11 seats)

New Forest New Forest UK locator map.svg
New Forest
Brockenhurst
PartyCandidateVotes%±%
Conservative Ken Thornber202752.355.97
UKIP Nigel Cox97725.23+12.07
Liberal Democrats Allan Hendry42310.9213.92
Green John Pemberton2235.76N/A
Labour Brian Curwain2225.73+2.05
Majority105027.126.36
Turnout 387233.6110.00
Conservative hold Swing 9.02
Dibden and Hythe
PartyCandidateVotes%±%
Liberal Democrats Malcolm Wade232350.8111.74
Conservative Michael Harris154633.810.80
Green Helen Field3527.70N/A
Labour Peter Dance3517.68+4.21
Majority77716.9911.57
Turnout 457230.918.71
Liberal Democrats hold Swing
Fordingbridge
PartyCandidateVotes%±%
Conservative Edward Heron179946.3711.54
UKIP Sidney Rasey92023.71N/A
Liberal Democrats Miranda Whitehead60415.5725.07
Labour Paul Toynton2666.86+2.42
Green Janet Richards2536.52N/A
TUSC Jane Ward380.98N/A
Majority87922.658.40
Turnout 388033.459.24
Conservative hold Swing 17.63
Lymington
PartyCandidateVotes%±%
Independent Jacqui England163543.98N/A
Conservative Alan O'Sullivan133435.8826.77
Green Sally May2596.97N/A
Labour Lena Samuels2456.59+2.43
Liberal Democrats Stephen Moss2456.5926.6
Majority
Turnout 371829.379.23
Independent gain from Conservative Swing
Lyndhurst
PartyCandidateVotes%±%
Conservative Keith Mans 181747.58
UKIP Corrie Williams106627.91
Liberal Democrats Stuart Ardern44611.68
Labour Kenneth Kershaw2787.28
Green Samantha Mawby2125.55
Majority
Turnout 381930.769.71
Conservative hold Swing
Milford and Hordle
PartyCandidateVotes%±%
Conservative Alan Rice200143.22
UKIP Ian Linney177338.29
Liberal Democrats Wyn Davies3206.91
Labour Amy Coakes3066.61
Green Julia Tremain2304.97
Majority
Turnout 463033.277.86
Conservative hold Swing
New Milton
PartyCandidateVotes%±%
Conservative Mel Kendal200045.31
UKIP Ann Vasilesco164037.15
Labour Caroline Hexter3788.56
Green Dan Fish2225.03
Liberal Democrats Alex Wade1743.94
Majority
Turnout 441431.129.05
Conservative hold Swing
Ringwood
PartyCandidateVotes%±%
Conservative Steve Rippon-Swaine142644.74
UKIP Hugh McGuinness99731.28
Labour Peter Harper40512.71
Green Sally Rose35911.26
Majority
Turnout 318726.678.88
Conservative hold Swing
South Waterside
PartyCandidateVotes%±%
UKIP Philip Fawkes136837.20
Conservative Alexis McEvoy105328.64
Liberal Democrats Brian Dash85023.12
Labour Michael Perkins2667.23
Green Lorella Weeks1403.81
Majority
Turnout 367728.823.03
UKIP gain from Conservative Swing
Totton North
PartyCandidateVotes%±%
UKIP Chris Lagdon102627.36
Conservative Neville Penman101527.07
Green Alan Weeks90824.21
Liberal Democrats Jacquie Shaw59715.92
Labour Peter Sopowski2045.44
Majority
Turnout 375028.553.96
UKIP gain from Green Swing
Totton South and Marchwood
PartyCandidateVotes%±%
Liberal Democrats David Harrison172442.15
UKIP Bob Menhennet100024.45
Conservative Dave Russell80219.61
Green Beverley Golden3127.63
Labour Alan Goodfellow2526.16
Majority
Turnout 409028.255.63
Liberal Democrats hold Swing

Rushmoor (5 seats)

Rushmoor Rushmoor UK locator map.svg
Rushmoor
Aldershot East
PartyCandidateVotes%±%
Labour Frank Rust129238.42+10.88
Conservative Ron Hughes107832.053.86
UKIP Adam De Lecq Le Gresley81424.20N/A
Liberal Democrats Roland Collins1795.3210.22
Majority2146.37
Turnout 336325.374.38
Labour gain from Conservative Swing +7.37
Aldershot West
PartyCandidateVotes%±%
Conservative Charles Choudhary94836.1019.83
UKIP Angela Lennox81831.15N/A
Labour Jeremy Preece67825.82+5.13
Liberal Democrats Neville Dewey1826.9316.45
Majority1304.9527.60
Turnout 262621.646.52
Conservative hold Swing 25.49
Farnborough North
PartyCandidateVotes%±%
Conservative Roz Chadd112934.230.18
UKIP Malcolm Small102931.20N/A
Labour Sue Gadsby74522.59+16.21
Liberal Democrats Craig Card39511.9818.73
Majority1003.030.67
Turnout 329825.958.47
Conservative hold Swing 15.69
Farnborough South
PartyCandidateVotes%±%
Conservative John Wall172943.6011.53
UKIP Jane Shattock99625.11N/A
Labour Co-op Anna Townsend55914.09+7.11
Liberal Democrats Abul Koher Chowdhury54713.7924.10
Christian Juliana Brimicombe1353.40N/A
Majority73318.48+1.24
Turnout 396627.2110.76
Conservative hold Swing 18.32
Farnborough West
PartyCandidateVotes%±%
UKIP Mark Staplehurst169441.51N/A
Conservative Carol Leversha154937.9619.49
Labour Len Amos49412.10+4.74
Liberal Democrats Philip Thompson3448.4326.76
Majority1453.55
Turnout 408129.345.48
UKIP gain from Conservative Swing +30.5

Test Valley (7 seats)

Test Valley Test Valley UK locator map.svg
Test Valley
Andover North
PartyCandidateVotes%±%
UKIP Timothy Rolt123931.57+12.82
Conservative Pam Mutton122931.3111.42
Liberal Democrats Len Gates105326.835.29
Labour Co-op Ryan Sutton40410.29+3.89
Majority100.26
Turnout 392526.385.43
UKIP gain from Conservative Swing +12.12
Andover South
PartyCandidateVotes%±%
UKIP Tony Hooke154840.94+19.55
Conservative David Drew149239.469.63
Liberal Democrats Ross Fifield38510.1812.26
Labour Conor Morris3569.42+2.34
Majority561.48
Turnout 378130.914.82
UKIP gain from Conservative Swing +14.59
Andover West
PartyCandidateVotes%±%
Conservative Pat West188645.5616.68
UKIP Norman Woods159038.41+20.69
Labour Alan Cotter3889.37+3.04
Liberal Democrats Katherine Bird2766.677.04
Majority2967.1537.37
Turnout 414031.517.58
Conservative hold Swing 18.69
Baddesley
PartyCandidateVotes%±%
Liberal Democrats Alan Dowden215045.8314.60
Conservative Roger Curtis115124.5411.70
UKIP Paul Cadier108423.11N/A
Labour Viv Mackay3066.52+3.19
Majority99921.302.89
Turnout 469135.389.18
Liberal Democrats hold Swing 1.45
Romsey Extra
PartyCandidateVotes%±%
Conservative Roy Perry 189737.5120.93
Liberal Democrats Sandra Gidley175434.663.34
UKIP Iain Bell119823.69N/A
Labour Peter Sowerby2084.11+0.55
Majority1432.8317.61
Turnout 505741.122.78
Conservative hold Swing 8.80
Romsey Town
PartyCandidateVotes%±%
Liberal Democrats Mark Cooper254751.543.70
Conservative Nick Michell122424.7716.82
UKIP Dennis Armstrong91218.45N/A
Labour David Stevens2595.24+2.07
Majority132326.77+13.12
Turnout 494241.016.65
Liberal Democrats hold Swing +6.56
Test Valley Central
PartyCandidateVotes%±%
Conservative Andrew Gibson301156.424.19
UKIP Michael Wigby127723.93+13.46
Liberal Democrats Richard Rowles69713.0612.37
Labour Elizabeth Sowerby3526.60+3.11
Majority173432.492.69
Turnout 533736.3610.07
Conservative hold Swing 8.83

Winchester (7 seats)

Winchester Winchester UK locator map.svg
Winchester
Bishops Waltham
PartyCandidateVotes%±%
Conservative Rob Humby199240.33
Liberal Democrats Roger Bentote164233.25
UKIP Vivienne Young101820.61
Labour Robert Rudge2875.81
Majority
Turnout 493937.8211.67
Conservative gain from Liberal Democrats Swing
Itchen Valley
PartyCandidateVotes%±%
Liberal Democrats Jackie Porter290851.34
Conservative Lisa Griffiths185132.68
UKIP Clive Boot70712.48
Labour Andrew Adams1983.50
Majority
Turnout 566443.7011.53
Liberal Democrats hold Swing
Meon Valley
PartyCandidateVotes%±%
Conservative Roger Huxstep245356.94
UKIP Kim Comotto95922.26
Liberal Democrats Christopher Day57413.32
Labour David Picton-Jones3227.47
Majority
Turnout 430836.8013.25
Conservative hold Swing
Winchester Downlands
PartyCandidateVotes%±%
Liberal Democrats Phil Bailey257146.37
Conservative James Byrnes186333.60
UKIP Chris Barton-Briddon85015.33
Labour Elaine Fullaway2604.69
Majority
Turnout 554442.7611.42
Liberal Democrats hold Swing
Winchester Eastgate
PartyCandidateVotes%±%
Conservative Fiona Mather174833.65
Liberal Democrats Brian Collin174133.52
Labour Patrick Davies63612.24
UKIP Bradley Monk58011.17
Green Michael Wilks4578.80
TUSC Dave Boyes320.62
Majority
Turnout 519434.629.15
Conservative gain from Liberal Democrats Swing
Winchester Southern Parishes
PartyCandidateVotes%±%
Conservative Patricia Stallard161843.88
Liberal Democrats Vivian Achwal80321.78
UKIP John Henderson68718.63
Independent John Cooper38210.36
Labour Sheena King1975.34
Majority
Turnout 368729.559.67
Conservative hold Swing
Winchester Westgate
PartyCandidateVotes%±%
Liberal Democrats Martin Tod204640.15
Conservative Ian Tait165232.42
UKIP David Abbott60711.91
Labour Co-op James Leppard4057.95
Green Dave Walker-Nix3617.08
TUSC Adam Freeman250.49
Majority
Turnout 509636.107.55
Liberal Democrats hold Swing

Related Research Articles

<span class="mw-page-title-main">2009 Suffolk County Council election</span> 2009 UK local government election

Elections to Suffolk County Council were held on 4 June 2009 as part of the 2009 United Kingdom local elections on the same day as the elections to the European Parliament. 75 councillors were elected from 63 electoral divisions, which returned either one or two county councillors each by first-past-the-post voting for a four-year term of office. The electoral divisions were the same as those used at the previous election in 2005.

<span class="mw-page-title-main">2009 Cornwall Council election</span>

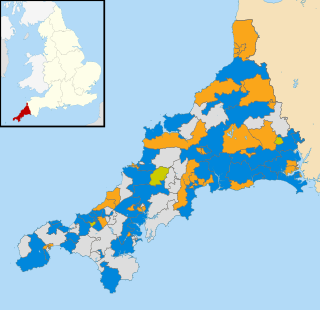
The Cornwall Council election, 2009, was an election for all 123 seats on the council. Cornwall Council is a unitary authority that covers the majority of the ceremonial county of Cornwall, with the exception of the Isles of Scilly which have an independent local authority. The elections took place concurrently with other local elections across England and Wales as well as the UK component of the elections to the European Parliament. Cornwall had seen its district and county councils abolished, replaced by a single 123-member Cornish unitary authority, for which councillors were elected for a full term.

<span class="mw-page-title-main">2009 Cambridgeshire County Council election</span>

An election to Cambridgeshire County Council took place on 4 June 2009 as part of the 2009 United Kingdom local elections. The election was delayed from 7 May to coincide with elections to the European Parliament. 69 councillors were elected from 60 electoral divisions, which returned either one or two county councillors each by first-past-the-post voting. The Conservative Party retained their majority on the council, while the Green Party and UKIP gained their first seats.

<span class="mw-page-title-main">2009 Somerset County Council election</span>

An election to Somerset County Council took place on 4 June 2009 as part of the 2009 United Kingdom local elections, having been delayed from 7 May, to coincide with elections to the European Parliament. The result brought to an end 16 years of Liberal Democrat rule to a Conservative controlled administration. 58 councillors were elected from various electoral divisions, which returned one county councillor each. Members were elected by the first-past-the-post voting system for a four-year term of office. This was the last election before the number of seats was cut to 55 for the 2013 election. With a total of 58 seats being reduced to 55 for the next election.

<span class="mw-page-title-main">2009 Staffordshire County Council election</span> 2009 UK local government election

Elections to Staffordshire County Council took place on 4 June 2009 as part of the 2009 United Kingdom local elections, having been delayed from 7 May, in order to coincide with elections to the European Parliament. 62 councillors were elected from the various electoral divisions, which returned either one or two county councillors each by first-past-the-post voting for a four-year term of office. The electoral divisions were the same as those used at the previous election in 2005. The council continues to be administered on the Leader and Cabinet model.

<span class="mw-page-title-main">2013 United Kingdom local elections</span>

The 2013 United Kingdom local elections took place on Thursday 2 May 2013. Elections were held in 35 English councils: all 27 non-metropolitan county councils and eight unitary authorities, and in one Welsh unitary authority. Direct mayoral elections took place in Doncaster and North Tyneside. These elections last took place on the 4 June 2009 at the same time as the 2009 European Parliament Elections, except for County Durham, Northumberland and the Anglesey where elections last took place in 2008.

<span class="mw-page-title-main">2013 Leicestershire County Council election</span> 2013 UK local government election

An election to Leicestershire County Council took place on 2 May 2013 as part of the 2013 United Kingdom local elections. 55 councillors were elected from 52 electoral divisions, which returned either one or two county councillors each by first-past-the-post voting for a four-year term of office. The Conservatives held control of the council with a reduced majority of 5 seats. Despite a strong challenge from UKIP, the party only gained 2 seats whilst the Liberal Democrats lost one seat and Labour recouped some of their 2009 losses, gaining 6 seats.

<span class="mw-page-title-main">2013 West Sussex County Council election</span>

The West Sussex County Council election, 2013 took place on 2 May 2013, as part of the 2013 United Kingdom local elections. All 71 electoral divisions were up for election, which returned one county councillor each by first-past-the-post voting for a four-year term of office. At this election, the Conservative Party was seeking to retain overall control of the council, and the Liberal Democrats to maintain their position as the main opposition party.

<span class="mw-page-title-main">2013 Cambridgeshire County Council election</span>

An election to Cambridgeshire County Council took place on 2 May 2013 as part of the 2013 United Kingdom local elections. 69 councillors were elected from 60 electoral divisions, which returned either one or two county councillors each by first-past-the-post voting for a four-year term of office. The electoral divisions were the same as those used at the previous election in 2009. No elections were held in Peterborough, which is a unitary authority outside the area covered by the County Council. The election saw the Conservative Party lose overall control of the council.

<span class="mw-page-title-main">2013 Worcestershire County Council election</span>

An election to Worcestershire County Council took place on 2 May 2013 as part of the 2013 United Kingdom local elections. 57 councillors were elected from 53 electoral divisions, which returned either one or two county councillors each by first-past-the-post voting for a four-year term of office. The divisions were the same as those used at the previous election in 2009. The election saw the Conservative Party retain overall control of the council with a significantly reduced majority of just 2 seats.

<span class="mw-page-title-main">2013 Lincolnshire County Council election</span>

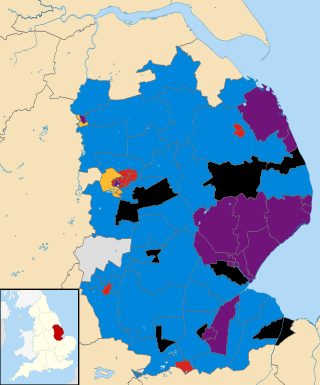
An election to Lincolnshire County Council took place on 2 May 2013 as part of the 2013 United Kingdom local elections. 77 electoral divisions returned one county councillor each by first-past-the-post voting for a four-year term of office. The electoral divisions were the same as those used at the previous election in 2009. No elections were held in North Lincolnshire or North East Lincolnshire, which are unitary authorities outside the area covered by the County Council.

<span class="mw-page-title-main">2013 Surrey County Council election</span>

The Surrey County Council election, 2013 took place on 2 May 2013 as part of the 2013 United Kingdom local elections. 81 electoral divisions returned one county councillor each by first-past-the-post voting for a four-year term of office. Following a review, new electoral division boundaries were introduced for this election, increasing the number of councillors from 80 to 81.

<span class="mw-page-title-main">2013 Gloucestershire County Council election</span>

Elections to Gloucestershire County Council took place on 2 May 2013 as part of the 2013 United Kingdom local elections. 53 electoral divisions elected one county councillor each by first-past-the-post voting for a four-year term of office. No elections were held in South Gloucestershire, which is a unitary authority outside the area covered by the County Council.

<span class="mw-page-title-main">2013 Hertfordshire County Council election</span>

An election to Hertfordshire County Council took place on 2 May 2013, as part of the 2013 United Kingdom local elections. 77 electoral divisions elected one county councilor each by first-past-the-post voting for a four-year term of office. The electoral divisions were the same as those used at the previous election in 2009.

<span class="mw-page-title-main">2013 Essex County Council election</span> 2013 UK local government election

An election to Essex County Council took place on 2 May 2013 as part of the 2013 United Kingdom local elections. 75 councillors were elected from 70 electoral divisions, which returned either one or two county councillors each by first-past-the-post voting for a four-year term of office. The electoral divisions were the same as those used at the previous election in 2009. No elections were held in Thurrock or Southend-on-Sea, which are unitary authorities outside the area covered by the County Council.

<span class="mw-page-title-main">2013 Staffordshire County Council election</span> UK local elections

An election to Staffordshire County Council took place on 2 May 2013 as part of the 2013 United Kingdom local elections. 62 electoral divisions returned one county councillor each by first-past-the-post voting for a four-year term of office. Following a boundary review, new electoral division boundaries were established for this election. No elections were held in Stoke-on-Trent, which is a unitary authority outside the area covered by the County Council. The council continues to be administered on the Leader and Cabinet model.

<span class="mw-page-title-main">2013 Dorset County Council election</span>

An election to Dorset County Council took place on 2 May 2013 as part of the United Kingdom local elections. 45 councillors were elected from 42 electoral divisions, which returned either one or two county councillors each by first-past-the-post voting for a four-year term of office. The electoral divisions were the same as those used at the previous election in 2009. No elections were held in Bournemouth or Poole, which are unitary authorities outside the area covered by the County Council. The election saw the Conservative Party maintain overall control of the council.

<span class="mw-page-title-main">2013 Suffolk County Council election</span> 2013 UK local government election

Elections to Suffolk County Council took place on 2 May 2013 as part of the 2013 United Kingdom local elections. 75 councillors were elected from 63 electoral divisions, which returned either one or two county councillors each by first-past-the-post voting for a four-year term of office. The electoral divisions were the same as those used at the previous election in 2009.

<span class="mw-page-title-main">2013 Northamptonshire County Council election</span>

An election to Northamptonshire County Council took place on 2 May 2013 as part of the 2013 United Kingdom local elections. Following a boundary review, the number of county councillors was reduced from 73 to 57 from this election. All members were elected by first-past-the-post voting from single-member electoral divisions for a four-year term of office. The Conservative Party held on to their overall majority, having held overall control of the council since 2005.

<span class="mw-page-title-main">2017 Hampshire County Council election</span>

The 2017 Hampshire County Council election took place on 4 May 2017 as part of the 2017 local elections in the United Kingdom. All councillors were elected from electoral divisions by first-past-the-post voting for a four-year term of office. The electoral divisions were somewhat changed from the previous election, with some being split, merged or with boundary changes. No elections were held in Portsmouth and Southampton, which are unitary authorities and hold their elections in other years. Similarly the districts within Hampshire did also not hold elections this year.

References

  1. "Elections in Hampshire County Council". Hampshire County Council. 28 March 2013. Archived from the original on 6 June 2013. Retrieved 31 March 2013.
  2. "The Representation of the People (Form of Canvass) (England and Wales) Regulations 2006, Schedule Part 1". Legislation.gov.uk. 13 October 2011. Retrieved 18 April 2012.
  3. "I have two homes. Can I register at both addresses?". The Electoral Commission. Archived from the original on 31 December 2013. Retrieved 5 January 2011.
  4. "Overall State of the Parties". Hampshire County Council. Archived from the original on 6 May 2013. Retrieved 3 May 2013.
  5. "Eastleigh District". Hampshire County Council. Archived from the original on 7 May 2013. Retrieved 4 May 2013.