2013 Derbyshire County Council election

Last updated

2013 Derbyshire County Council election
Derbyshire flag.svg
  2009 2 May 2013 2017  

All 64 seats to Derbyshire County Council
33 seats needed for a majority
 First partySecond partyThird party
 
Party Labour Conservative Liberal Democrats
Last election33218
Seats won43183
Seat changeIncrease2.svg18Decrease2.svg13Decrease2.svg4
Popular vote80,66556,45515,006
Percentage41.1%28.7%7.6%

Derbyshire UK local election 2013 map.svg
Map showing the results of the 2013 Derbyshire County Council elections.

Council control before election

No overall control

Council control after election

Labour

An election to Derbyshire County Council took place on 2 May 2013 as part of the 2013 United Kingdom local elections. Following the final draft of the 2012 electoral review, 64 councillors were elected from 61 electoral divisions which returned either one or two county councillors each by first-past-the-post voting for a four-year term of office. [1] No elections were held in the City of Derby, which is a unitary authority outside the area covered by the County Council. The Labour Party won back control of the council by a landslide victory, taking forty-two of the authority's sixty-four seats.

Contents

All locally registered electors (British, Irish, Commonwealth and European Union citizens) who were aged 18 or over on Thursday 2 May 2013 were entitled to vote in the local elections. Those who were temporarily away from their ordinary address (for example, away working, on holiday, in student accommodation or in hospital) were also entitled to vote in the local elections, [2] although those who had moved abroad and registered as overseas electors cannot vote in the local elections. It is possible to register to vote at more than one address (such as a university student who had a term-time address and lives at home during holidays) at the discretion of the local Electoral Register Office, but it remains an offence to vote more than once in the same local government election. [3]

Background

The previous election ended 28 years of Labour control, giving the Conservatives an overall majority of two seats and control of the council. However, their majority was eroded by the suspension and defection of two Conservative councillors, leaving the council hung. [4] [5] [6]

Election results

Derbyshire County Council Election Overall Result 2013
PartySeatsGainsLossesNet gain/lossSeats %Votes %Votes+/−
  Labour 43+1867.242.8487,020+22,233
  Conservative 18-1328.128.8158,507-29,895
  Liberal Democrats 3-44.77.5715,379-33,036
  UKIP 0018.7137,997+36,114
  Other parties 002.074,209

Derbyshire County Council – Results by District

Amber Valley Borough

(10 seats, 9 electoral divisions)

Amber Valley Borough Summary Result 2013
PartySeatsGainsLossesNet gain/lossSeats %Votes %Votes+/−
  Labour 77043.216,033
  Conservative 33031.611,755
  UKIP 0017.76,578
  Liberal Democrats 004.01,498
  BNP 001.9720
  Other parties 001.1415
  Green 000.4145

Alfreton and Somercotes

Alfreton & Somercotes (2 seats)
PartyCandidateVotes%
Labour Paul James Smith 3,263 27.4
Labour Steve Marshall-Clarke 2,860 24.0
UKIP Garry Smith1,36911.5
Conservative Ron Ashton1,32411.1
Conservative Lynne Watson1,27010.7
UKIP Juliette Nicola Stevens1,0108.5
Independent George Soudah4153.5
Liberal Democrats Joel Ross Hunt2692.3
Liberal Democrats Peter Jelf1251.1
Turnout 11,90531.6

Alport and Derwent

Alport & Derwent (1 seat)
PartyCandidateVotes%
Conservative Martin Tomlinson 1,558 42.3
UKIP Ashley John Harrison93625.4
Labour Mark Grayling89424.3
Liberal Democrats Ollie Smith2958.0
Turnout 3,68338

Belper

Belper (1 seat)
PartyCandidateVotes%
Labour John Robert Owen 1,169 39.3
Conservative Peter Makin98133.0
UKIP Roy Wilford Snape64221.6
Liberal Democrats Jane Vivlenne Benson1826.1
Turnout 2,97433

Duffield and Belper South

Duffield & Belper South (1 seat)
PartyCandidateVotes%
Conservative Stuart John Bradford 1,340 43.8
Labour Ben Rupert Edward Bellamy83127.2
UKIP Barry Simpson Clark65621.4
Liberal Democrats Jeremy Richard Benson2337.6
Turnout 3,06033

Greater Heanor

Greater Heanor (1 seat)
PartyCandidateVotes%
Labour Paul Jones 1,383 51.4
Conservative Kevin Lee Parkinson87732.6
BNP Cliff Roper33612.5
Liberal Democrats Keith Charles Falconbridge973.6
Turnout 2,69328

Heanor Central

Heanor Central (1 seat)
PartyCandidateVotes%
Labour Celia Mary Cox 1,454 46.8
Conservative Alex Stevenson78025.1
UKIP Kenneth John Clifford70122.6
BNP Adrian Barry Hickman1715.5
Turnout 3,10633

Horsley

Horsley (1 seat)
PartyCandidateVotes%
Conservative Kevin Buttery 1,463 41.8
Labour John Philip Banks1,03829.7
UKIP Wayne Porter86424.7
Liberal Democrats Kate Smith1353.9
Turnout 3,50035

Ripley East and Codnor

Ripley East & Codnor (1 seat)
PartyCandidateVotes%
Labour Steve Freeborn 1,523 44.0
Conservative Stuart Joynes96728.0
UKIP Ann Fox79923.1
BNP Alan Edwards892.6
Liberal Democrats Margaret Tomkins792.3
Turnout 3,45734

Ripley West and Heage

Ripley West & Heage (1 seat)
PartyCandidateVotes%
Labour David Alan Williams 1,618 39.7
Conservative David Wilson1,19529.3
UKIP Philip Sanders Rose97023.8
Green Tony Youens1453.6
Liberal Democrats Paul Robin Gibbons832.0
BNP Ken Cooper641.6
Turnout 4,07439

Bolsover District

(6 seats, 6 electoral divisions)

Bolsover District Summary Result 2013
PartySeatsGainsLossesNet gain/lossSeats %Votes %Votes+/−
  Labour 610059.38,929
  UKIP 0025.33,810
  Conservative 0012.21,832
  TUSC 003.3495

Barlborough and Clowne

Barlborough & Clowne (1 seat)
PartyCandidateVotes%
Labour Anne Western 1,519 61.7
UKIP Scott Richard Goring52621.4
Conservative David Thomas Jackson41917.0
Turnout 2,46428

Bolsover North

Bolsover North (1 seat)
PartyCandidateVotes%
Labour Duncan McGregor 1,503 57.1
UKIP Carl Jones64724.6
TUSC Pete Neeve2479.4
Conservative Aidan Joseph Press2369.0
Turnout 2,63326

Bolsover South

Bolsover South (1 seat)
PartyCandidateVotes%
Labour Joan Elizabeth Dixon 1,690 60.3
UKIP Derek Adams76327.2
Conservative Katharine Burrow2187.8
TUSC Jon Dale1344.8
Turnout 2,80529

Shirebrook and Pleasley

Shirebrook & Pleasley (1 seat)
PartyCandidateVotes%
Labour Marian Stockdale 1,314 61.1
UKIP Tony Kay58327.1
Conservative Richard Terrance Pender1677.8
TUSC Dean Lloyd Eggleston873.1
Turnout 2,15125

South Normanton and Pinxton

South Normanton & Pinxton (1 seat)
PartyCandidateVotes%
Labour Jim Coyle 1,300 54.0
UKIP Ray Calladine65127.0
Conservative Robert James Sainsbury34814.5
Independent Cherry Anne Drake-Brockman833.5
TUSC Brian Christopher Loader271.1
Turnout 2,40925

Tibshelf

Tibshelf (1 seat)
PartyCandidateVotes%
Labour Clive Richard Moesby 1,603 59.7
UKIP Joan Bentley64023.8
Conservative Heather Kay Liggett44416.5
Turnout 2,68727

Chesterfield Borough

(9 seats, 9 electoral divisions)

Chesterfield Borough Summary Result 2013
PartySeatsGainsLossesNet gain/lossSeats %Votes %Votes+/−
  Labour 840+4895113,432
  Liberal Democrats 104-41120.95,490
  UKIP 0000013.83,631
  Conservative 0000010.32,710
  Other parties 0000041,057

Birdholme

Birdholme (1 seat)
PartyCandidateVotes%
Labour Dave Allen 1,792 70.6
Conservative James Michael Dietsch37614.8
Liberal Democrats Bridget Anne Dunks37114.6
Turnout 2,53928
Labour hold

Boythorpe and Brampton South

Boythorpe & Brampton South (1 seat)
PartyCandidateVotes%
Labour Ron Mihaly 1,300 46.0
Liberal Democrats Keith Falconer93233.0
UKIP Sharon Buxton41414.6
Conservative Marcus Stanton Linsey1836.5
Turnout ,282934
Labour gain from Liberal Democrats

Brimington

Brimington (1 seat)
PartyCandidateVotes%
Labour Walter Burrows 1,857 68.7
Conservative Barry Thompson30111.1
Liberal Democrats Sharon Taylor2509.3
Independent Mike Mullins1756.5
Independent Paul Alan Mann1194.4
Labour hold
Turnout 2,70227

Loundsley Green and Newbold

Loundsley Green & Newbold (1 seat)
PartyCandidateVotes%
Labour Stuart Brittain 1,429 40.5
Liberal Democrats Tony Rogers1,12431.4
UKIP Keith Lomas67718.9
Independent Mick Bagshaw1815.1
Conservative Nigel Robert Sterland1674.7
Turnout 3,57841
Labour gain from Liberal Democrats

Spire

Spire (1 seat)
PartyCandidateVotes%
Labour Sharon Lesley Blank 1,292 55.6
UKIP Stuart David Yeowart42018.1
Independent Adrian Mather27211.7
Liberal Democrats Maggie Cannon1908.2
Conservative Simon John Temperton1486.4
Turnout 2,32229
Labour hold

St Mary's

St Mary's (1 seat)
PartyCandidateVotes%
Labour Co-op Jean Mary Innes 1,517 51.2
UKIP Mike Abberley76325.8
Liberal Democrats John Barnett43614.7
Conservative James Paul Dale2478.4
Turnout 2,96330
Labour gain from Liberal Democrats

Staveley

Staveley (1 seat)
PartyCandidateVotes%
Labour John Graham Williams 1,976 74.4
Independent Joe Mann31011.7
Conservative Jannet Ann Dale2338.8
Liberal Democrats Chris Beirne1365.1
Turnout 2,65528
Labour hold

Staveley North and Whittington

Staveley North & Whittington (1 seat)
PartyCandidateVotes%
Labour Dean Collins 1,307 40.5
Liberal Democrats Barry Bingham97230.1
UKIP Richard Bexton82925.7
Conservative Malcolm Benjamin Rowley1193.7
Labour gain from Liberal Democrats
Turnout 3,22733

Walton and West

Walton & West (1 seat)
PartyCandidateVotes%
Liberal Democrats Keith Patrick Morgan 1,079 30.8
Labour Martin Michael Stone96227.5
Conservative John David Lee Boult93626.7
UKIP Kevin Coney52815.1
Turnout 3,50542
Liberal Democrats hold

Derbyshire Dales District

(6 seats, 6 electoral divisions)

Derbyshire Dales District Summary Result 2013
PartySeatsGainsLossesNet gain/lossSeats %Votes %Votes+/−
  Conservative 46736.87,627
  Labour 23329.86,190
  UKIP 0020.14,171
  Liberal Democrats 0011.32,346
  Green 002.0418

Ashbourne

Ashbourne (1 seat)
PartyCandidateVotes%
Conservative Andrew Lewer 1,985 59.1
UKIP Leonie Staimar66519.8
Labour Matthew Gareth Jones42012.5
Liberal Democrats Rebecca Goodall2908.6
Turnout 3,36036

Bakewell

Bakewell (1 seat)
PartyCandidateVotes%
Conservative Judith Anne Twigg 1,937 50.0
Labour David Hill79320.5
UKIP Philip Robinson75119.4
Liberal Democrats Eleanor Nancolas39410.2
Turnout 3,87539

Derwent Valley

Derwent Valley (1 seat)
PartyCandidateVotes%
Conservative Michael Vernon Longden 1,674 42.8
UKIP Michael Hancocks94424.2
Labour Paul Vaughan90423.1
Liberal Democrats Sandra Fearn3879.9
Turnout 3,90941

Dovedale

Dovedale (1 seat)
PartyCandidateVotes%
Conservative Simon Andrew Spencer 1,473 42.0
Labour Colin Swindell1,19834.1
UKIP Sarah Elizabeth King52715.0
Green John Robin Youatt1865.3
Liberal Democrats Trish Birchley1253.6
Turnout 3,50937

Matlock

Matlock (1 seat)
PartyCandidateVotes%
Labour Andy Botham 1,114 29.6
Conservative Geoff Stevens1,09229.0
Liberal Democrats Steve Flitter1,02827.3
UKIP Tilly Sanders Ward52914.1
Turnout 3,76342

Wirksworth

Wirksworth (1 seat)
PartyCandidateVotes%
Labour Irene Ratcliffe 1,761 41.2
Conservative Richard Bright1,40332.8
UKIP Chris Wardle75517.7
Green Christopher Spencer2325.4
Liberal Democrats David Jones1222.9
Turnout 4,27342

Erewash Borough

(9 seats, 9 electoral divisions)

Erewash Borough Summary Result 2013
PartySeatsGainsLossesNet gain/lossSeats %Votes %Votes+/−
  Labour 55634.69,303
  Conservative 44435.99,638
  UKIP 0023.36,271
  Liberal Democrats 004.91,327
  Green 001.1283
  Monster Raving Loony 000.259

Breadsall and West Hallam

Breadsall & West Hallam (1 seat)
PartyCandidateVotes%
Conservative Carol Ann Hart 1,616 49.5
Labour Linda McGraw79124.3
UKIP Alan Sidney Rose60418.5
Green Jeannie Elizabeth Alderdice1705.2
Liberal Democrats Kristopher James Watts812.5
Turnout 3,26234.9

Breaston

Breaston (1 seat)
PartyCandidateVotes%
Conservative Robert Alan Parkinson 1,481 38.6
UKIP Caroline Susan Gent1,13429.6
Labour Louis Booth1,05027.4
Liberal Democrats Martin Charles Garnett1724.5
Turnout 3,83736.8

Ilkeston East

Ilkeston East (1 seat)
PartyCandidateVotes%
Labour Glennice Birkin 1,436 52.0
UKIP Brendan Patrick Berry70925.7
Conservative Kevin Philip Miller46116.7
Liberal Democrats Rachel Allen973.5
Monster Raving Loony Whopping Lord Foghole592.1
Turnout 2,76228.2

Ilkeston South

Ilkeston South (1 seat)
PartyCandidateVotes%
Labour John Arnold Fudd 1,279 49.2
UKIP Giles Farrand86133.1
Conservative Richard Harris40615.6
Liberal Democrats Fiona Aanonson562.2
Turnout 2,60228.6

Ilkeston West

Ilkeston West (1 seat)
PartyCandidateVotes%
Labour Michelle Wendy Booth 1,344 44.5
Conservative Val Custance94231.2
UKIP Jamie Parker53717.8
Green Philip Hood1133.7
Liberal Democrats Angela Togni842.8
Turnout 3,02032.4

Long Eaton

Long Eaton (1 seat)
PartyCandidateVotes%
Labour Roland Leon Hosker 1,384 45.7
Conservative Kewal Singh Athwal97832.3
UKIP Bexley Sears50316.6
Liberal Democrats Susannah Louise Watts1615.3
Turnout 3,02631.9

Petersham

Petersham (1 seat)
PartyCandidateVotes%
Labour Clare Elaine Neill 1,237 41.2
Conservative Garry Keith Hickton85428.4
UKIP Wg Cdr Mike Clulow62020.6
Liberal Democrats Ian Allan Neill2959.8
Turnout 3,00630.8

Sandiacre

Sandiacre (1 seat)
PartyCandidateVotes%
Conservative Wayne Major 1,548 46.0
Labour Patrick Martin Pritchett96928.8
UKIP Mark Robert Willis64419.1
Liberal Democrats Martin Lowe2086.2
Turnout 3,36936.2

Sawley

Sawley (1 seat)
PartyCandidateVotes%
Conservative Daniel Walton 1,352 40.5
Labour Bob Knight1,15734.6
UKIP Simon Nicholas Gent65919.7
Liberal Democrats Rodney Wilby Allen1735.2
Turnout 3,34135.1

High Peak Borough

(8 seats, 7 electoral divisions)

High Peak Borough Summary Result 2013
PartySeatsGainsLossesNet gain/lossSeats %Votes %Votes+/−
  Labour 462.538.911,266
  Conservative 22532.89,557
  Liberal Democrats 212.511.93,452
  UKIP 008.92,593
  Green 005.11,487
  Other parties 002.7771

Buxton North and East

Buxton North & East (1 seat)
PartyCandidateVotes%
Labour Caitlin Janette Bisknell 1,138 45.3
Conservative Pam Reddy79531.7
UKIP Margaret Florence Appleby49519.7
Liberal Democrats Graham Scott843.3
Turnout 2,51228

Buxton West

Buxton West (1 seat)
PartyCandidateVotes%
Conservative Tony Arthur Kemp 1,123 35.6
Labour Fiona Sloman95230.2
Independent Bob Morris77124.4
Green Matthew Alexander Bain2196.9
Liberal Democrats Christopher Richard Warhurst Weaver902.9
Turnout 3,15533

Chapel and Hope Valley

Chapel & Hope Valley (1 seat)
PartyCandidateVotes%
Conservative Jocelyn Sarah Street 1,441 42.1
Labour Tim Norton89726.2
UKIP Ian Guiver58617.1
Green Charlotte Nancy Farrell34910.2
Liberal Democrats Brian Colin Hallsworth1494.4
Turnout 3,42237

Etherow

Etherow (1 seat)
PartyCandidateVotes%
Labour Dave Wilcox 1,393 65.5
Conservative Peter James Kay61028.7
Liberal Democrats Alan Debes1235.8
Turnout 2,12626

Glossop and Charlesworth

Glossop & Charlesworth (2 seats)
PartyCandidateVotes%
Labour Damien Thomas Greenhalgh 2,432 22.0
Labour Ellie Wilcox 2,403 21.7
Conservative Jean Wharmby1,93917.5
Conservative George David Wharmby1,90617.2
UKIP David Phillips1,0889.8
Green Peter Duncan Allen6826.2
Liberal Democrats Stephen David Worrall3553.2
Liberal Democrats George Kuppan2482.2
Turnout 11,05333.1

New Mills

New Mills (1 seat)
PartyCandidateVotes%
Liberal Democrats Beth Atkins 1,408 37.9
Labour Alan Barrow1,20532.4
Conservative Jeff Lawton86523.3
Green Dee Sayce2376.4
Turnout 3,71537

Whaley Bridge

Whaley Bridge (1 seat)
PartyCandidateVotes%
Liberal Democrats David William Lomax 995 31.6
Conservative Rodney Bruce Gilmour87827.9
Labour Martin Lindsay Thomas84626.9
UKIP James Henry Bush42413.5
Turnout 3,14338

North East Derbyshire District

(8 seats, 7 electoral divisions)

North East Derbyshire District Summary Result 2013
PartySeatsGainsLossesNet gain/lossSeats %Votes %Votes+/−
  Labour 67550.113,835
  Conservative 22525.67,061
  UKIP 0020.25,562
  Liberal Democrats 002.2607
  Other parties 001.9527

Clay Cross North

Clay Cross North (1 seat)
PartyCandidateVotes%
Labour Brian Wright 1,737 73.4
Conservative Linda Rowley63026.6
Turnout 2,367

Clay Cross South

Clay Cross South (1 seat)
PartyCandidateVotes%
Labour Kevin Gillott 1,909 67.2
Conservative William Armitage54119.0
Independent Morgan Howells39113.8
Turnout 2,841

Dronfield East

Dronfield East(1 seat)
PartyCandidateVotes%
Labour Janet Hill 1,238 38.8
Conservative Angelique Foster1,08734.1
UKIP Roderick Bernard Arundale Harrison52116.3
Liberal Democrats Simon Philip Temple2066.5
Independent Clive Gill1364.3
Turnout 3,188

Dronfield West and Walton

Dronfield West & Walton (1 seat)
PartyCandidateVotes%
Conservative Stuart Ellis 1,312 35.7
UKIP Adrian Lewis Clarke1,13931.0
Labour Michael Gordon82022.3
Liberal Democrats Wendy Mary Temple40110.9
Turnout 3,672

Eckington and Killamarsh

Eckington & Killamarsh (2 seats)
PartyCandidateVotes%
Labour Diane Charles 2,507 28.1
Labour Brian Ridgway 2,436 27.3
UKIP Charles David Rae Watson1,26214.5
UKIP David Stanley Rae Watson1,06511.9
Conservative Lewis James Blackburn8439.5
Conservative Roger Anthony Hall8139.1
Turnout 8,926

Sutton

Sutton (1 seat)
PartyCandidateVotes%
Labour Julie Ann Hill 1,726 60.8
UKIP Glen John Potter80128.2
Conservative Charlotte Cupit31211.0
Turnout 2,839

Wingerworth and Shirland

Wingerworth & Shirland (1 seat)
PartyCandidateVotes%
Conservative Barry Lewis 1,523 40.5
Labour Barry Herbert Barnes1,46238.9
UKIP Alan Randall77420.6
Turnout 3759

South Derbyshire District

(8 seats, 8 electoral divisions)

South Derbyshire District Summary Result 2013
PartySeatsGainsLossesNet gain/lossSeats %Votes %Votes+/−
  Labour 562.534.98,032
  Conservative 337.536.28,327
  UKIP 0023.45,381
  Liberal Democrats 002.9659
  Other parties 002.4557
  Socialist Labour 000.245

Aston

Aston (1 seat)
PartyCandidateVotes%
Labour Robert Davison 1,279 37.1
UKIP Alan Wayne Graves1,12032.5
Conservative Chris Pratt96828.1
Liberal Democrats Kevin John Maher832.4
Turnout 3,45040

Etwall and Repton

Etwall & Repton (1 seat)
PartyCandidateVotes%
Conservative Martyn Ford 1,775 52.7
UKIP Martin Ashley Bardoe81624.2
Labour Brian John Cox68520.4
Liberal Democrats Christopher Simon Collard922.7
Turnout 3,36635

Hilton

Hilton (1 seat)
PartyCandidateVotes%
Conservative Julie Elizabeth Patten 1,353 51.4
Labour Steve Cooper60823.1
UKIP Eric Peter Wayne Graves47318.0
Independent Timothy Noel Robinson1355.1
Liberal Democrats Alexis Saliou Diouf632.4
Turnout 2,63228

Linton

Linton (1 seat)
PartyCandidateVotes%
Labour Kath Lauro 985 32.4
Conservative Charles Jones84527.8
UKIP David Anthony Gunn73824.3
Independent Mike Lacey31110.2
Liberal Democrats Lorraine Karen Johnson1625.3
Turnout 3,04135

Melbourne

Melbourne (1 seat)
PartyCandidateVotes%
Conservative Linda Mary Chilton 1,519 45.8
Labour Alan Mercer Jones1,03631.2
UKIP Alan Jack Graves63819.2
Liberal Democrats Rebecca Jane Wilkinson1263.8
Turnout 3,31936

Swadlincote Central

Swadlincote Central (1 seat)
PartyCandidateVotes%
Labour Paul Dunn 1,006 41.6
Conservative Gill Farrington71229.5
UKIP Barry Appleby54022.3
Independent David James Bird692.9
Liberal Democrats Georgina Mary Bennion492.0
Independent Jon McEwan421.7
Turnout 2,41826

Swadlincote North

Swadlincote North (1 seat)
PartyCandidateVotes%
Labour Sean Andrew Bambrick 1m366 56.8
Conservative Kim Coe48620.2
UKIP Ann Graves47419.7
Socialist Labour Paul Liversuch451.9
Liberal Democrats Shirley Anne Niblock361.5
Turnout 2,40726

Swadlincote South

Swadlincote South (1 seat)
PartyCandidateVotes%
Labour Trevor Southerd 1,067 45.1
Conservative Pat Murray66928.3
UKIP Mike Dawson58224.6
Liberal Democrats Liam Clarke482.0
Turnout 2,36627

By-Elections between May 2013 – May 2017

By-elections are called when a representative Councillor resigns or dies, so are unpredictable. A by-election is held to fill a political office that has become vacant between the scheduled elections.

Alport and Derwent – 14 November 2014

Alport and Derwent By-Election 14 November 2014
PartyCandidateVotes%±%
Conservative David Taylor 1,118 44.9 +3.1
UKIP David Fisher71528.7+3.6
Labour Mike Ratcliffe65626.4+1.2
Majority40316.2
Turnout 248925.8
Conservative hold Swing

Brimington – 5 February 2015

Brimington By-Election 5 February 2015
PartyCandidateVotes%±%
Labour Tricia Gilby 1,293 62.0 -6.7
UKIP Paul Christopher Stone38018.2+18.2
Independent Mick Bagshaw1577.5+7.5
Liberal Democrats John Edward Ahern1356.5-2.8
Conservative Lewis Mark Preston1205.8-5.4
Majority91343.8
Turnout 208521.9
Labour hold Swing

Ashbourne – 7 May 2015

Ashbourne By-Election 7 May 2015
PartyCandidateVotes%±%
Conservative Stephen Bull 4,715 68.6 +9.5
Labour Simon John Meredith96514.0+1.5
Green Andrew White6479.4+9.4
Liberal Democrats David Rowe5437.9-0.7
Majority3,75054.6
Turnout 6,87073.3
Conservative hold Swing

Derwent Valley – 24 September 2015

Derwent Valley By-Election 24 September 2015
PartyCandidateVotes%±%
Conservative Jo Wild 1,017 51.0 +8.1
Labour Martin Rutter46621.5-1.7
Liberal Democrats Michael Crapper31413.6+4.6
UKIP Mike Dawson28513.1-11.0
Majority64129.5
Turnout 2,17222.9
Conservative hold Swing

Related Research Articles

<span class="mw-page-title-main">2005 Suffolk County Council election</span>

Elections to Suffolk County Council were held on 5 May 2005. The whole council was up for election with boundary changes since the last election in 2001 reducing the number of seats by 5. The Conservative Party gained control of the council from no overall control.

<span class="mw-page-title-main">2009 Suffolk County Council election</span>

Elections to Suffolk County Council were held on 4 June 2009 as part of the 2009 United Kingdom local elections on the same day as the elections to the European Parliament. 75 councillors were elected from 63 electoral divisions, which returned either one or two county councillors each by first-past-the-post voting for a four-year term of office. The electoral divisions were the same as those used at the previous election in 2005.

<span class="mw-page-title-main">2009 Somerset County Council election</span>

An election to Somerset County Council took place on 4 June 2009 as part of the 2009 United Kingdom local elections, having been delayed from 7 May, to coincide with elections to the European Parliament. The result brought to an end 16 years of Liberal Democrat rule to a Conservative controlled administration. 58 councillors were elected from various electoral divisions, which returned one county councillor each. Members were elected by the first-past-the-post voting system for a four-year term of office. This was the last election before the number of seats was cut to 55 for the 2013 election. With a total of 58 seats being reduced to 55 for the next election.

<span class="mw-page-title-main">2009 Surrey County Council election</span>

Elections to Surrey County Council took place on 4 June 2009 as part of the 2009 United Kingdom local elections, having been delayed from 7 May in order for the elections to take place alongside those to the European Parliament.

<span class="mw-page-title-main">2013 Lancashire County Council election</span> United Kingdom local election

An election to Lancashire County Council took place on 2 May 2013 as part of the United Kingdom local elections, 2013. 84 councillors were elected from single-member electoral divisions by first-past-the-post for a four-year term of office. Electoral divisions were the same as those at the previous election in 2009. Elections were held in all electoral divisions across the present ceremonial county, excepting Blackpool and Blackburn with Darwen which are unitary authorities in a similar way to Greater Manchester and most of Merseyside. The election saw the Conservative Party lose overall control of the council, instead overtaken in number of seats by the Labour Party, without any absolute majority.

<span class="mw-page-title-main">2013 Cumbria County Council election</span>

An election to Cumbria County Council took place on 2 May 2013 as part of the 2013 United Kingdom local elections. All 84 councillors were elected from electoral divisions which returned one county councillor each by first-past-the-post voting for a four-year term of office. Following an electoral review carried out by the Local Government Boundary Commission for England, newly drawn electoral divisions were used without change in the number of county councillors.

<span class="mw-page-title-main">2013 Leicestershire County Council election</span>

An election to Leicestershire County Council took place on 2 May 2013 as part of the 2013 United Kingdom local elections. 55 councillors were elected from 52 electoral divisions, which returned either one or two county councillors each by first-past-the-post voting for a four-year term of office. The Conservatives held control of the council with a reduced majority of 5 seats. Despite a strong challenge from UKIP, the party only gained 2 seats whilst the Liberal Democrats lost one seat and Labour recouped some of their 2009 losses, gaining 6 seats.

<span class="mw-page-title-main">2013 West Sussex County Council election</span>

The West Sussex County Council election, 2013 took place on 2 May 2013, as part of the 2013 United Kingdom local elections. All 71 electoral divisions were up for election, which returned one county councillor each by first-past-the-post voting for a four-year term of office. At this election, the Conservative Party was seeking to retain overall control of the council, and the Liberal Democrats to maintain their position as the main opposition party.

<span class="mw-page-title-main">2013 East Sussex County Council election</span>

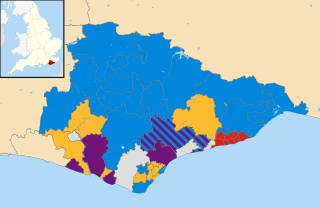
The East Sussex County Council election, 2013 took place on 2 May 2013 as part of the 2013 United Kingdom local elections. All 49 councillors of East Sussex County Council were elected from 44 electoral divisions, which return either one or two councillors each by first-past-the-post voting for a four-year term of office. The electoral divisions were the same as those used at the previous election in 2009. No elections were held in Brighton and Hove, which is a unitary authority outside the area covered by the County Council.

<span class="mw-page-title-main">2013 Hampshire County Council election</span>

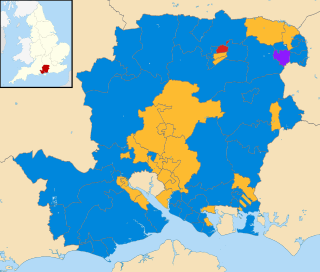
An election to Hampshire County Council took place on 2 May 2013 as part of the 2013 United Kingdom local elections. 78 councillors were elected from 75 electoral divisions, which returned either one or two county councillors each by first-past-the-post voting for a four-year term of office. The electoral divisions were the same as those of the previous election in 2009. No elections were held in Portsmouth and Southampton, which are unitary authorities outside the area covered by the County Council. The election saw the Conservative Party retain overall control of the council, with a reduced majority of five councillors.

<span class="mw-page-title-main">2013 Cambridgeshire County Council election</span>

An election to Cambridgeshire County Council took place on 2 May 2013 as part of the 2013 United Kingdom local elections. 69 councillors were elected from 60 electoral divisions, which returned either one or two county councillors each by first-past-the-post voting for a four-year term of office. The electoral divisions were the same as those used at the previous election in 2009. No elections were held in Peterborough, which is a unitary authority outside the area covered by the County Council. The election saw the Conservative Party lose overall control of the council.

<span class="mw-page-title-main">2013 Worcestershire County Council election</span>

An election to Worcestershire County Council took place on 2 May 2013 as part of the 2013 United Kingdom local elections. 57 councillors were elected from 53 electoral divisions, which returned either one or two county councillors each by first-past-the-post voting for a four-year term of office. The divisions were the same as those used at the previous election in 2009. The election saw the Conservative Party retain overall control of the council with a significantly reduced majority of just 2 seats.

<span class="mw-page-title-main">2013 Lincolnshire County Council election</span>

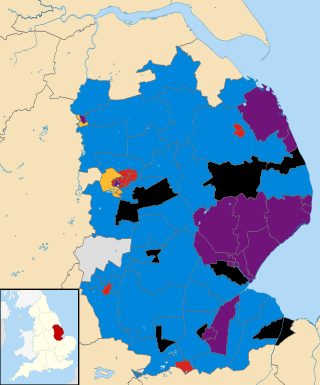
An election to Lincolnshire County Council took place on 2 May 2013 as part of the 2013 United Kingdom local elections. 77 electoral divisions returned one county councillor each by first-past-the-post voting for a four-year term of office. The electoral divisions were the same as those used at the previous election in 2009. No elections were held in North Lincolnshire or North East Lincolnshire, which are unitary authorities outside the area covered by the County Council.

<span class="mw-page-title-main">2013 Gloucestershire County Council election</span>

Elections to Gloucestershire County Council took place on 2 May 2013 as part of the 2013 United Kingdom local elections. 53 electoral divisions elected one county councillor each by first-past-the-post voting for a four-year term of office. No elections were held in South Gloucestershire, which is a unitary authority outside the area covered by the County Council.
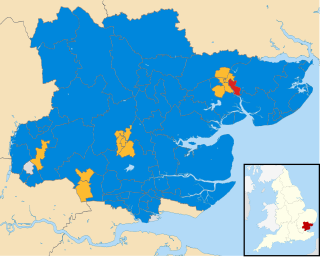
<span class="mw-page-title-main">2013 Essex County Council election</span>

An election to Essex County Council took place on 2 May 2013 as part of the 2013 United Kingdom local elections. 75 councillors were elected from 70 electoral divisions, which returned either one or two county councillors each by first-past-the-post voting for a four-year term of office. The electoral divisions were the same as those used at the previous election in 2009. No elections were held in Thurrock or Southend-on-Sea, which are unitary authorities outside the area covered by the County Council.

<span class="mw-page-title-main">2013 Dorset County Council election</span>

An election to Dorset County Council took place on 2 May 2013 as part of the United Kingdom local elections. 45 councillors were elected from 42 electoral divisions, which returned either one or two county councillors each by first-past-the-post voting for a four-year term of office. The electoral divisions were the same as those used at the previous election in 2009. No elections were held in Bournemouth or Poole, which are unitary authorities outside the area covered by the County Council. The election saw the Conservative Party maintain overall control of the council.

<span class="mw-page-title-main">2013 Suffolk County Council election</span>

Elections to Suffolk County Council took place on 2 May 2013 as part of the 2013 United Kingdom local elections. 75 councillors were elected from 63 electoral divisions, which returned either one or two county councillors each by first-past-the-post voting for a four-year term of office. The electoral divisions were the same as those used at the previous election in 2009.

<span class="mw-page-title-main">2017 Derbyshire County Council election</span>

An election to Derbyshire County Council took place on 4 May 2017 as part of the 2017 United Kingdom local elections. 64 councillors were elected from 61 electoral divisions which returned either one or two county councillors each by first-past-the-post voting for a four-year term of office. No elections were held in the City of Derby, which is a unitary authority outside the area covered by the County Council. The Conservative Party won back control of the council, taking thirty-seven of the authority's sixty-four seats.

<span class="mw-page-title-main">2017 Gloucestershire County Council election</span>

The 2017 Gloucestershire County Council election took place on 4 May 2017 as part of the 2017 local elections in the United Kingdom. All 53 councillors were elected from electoral divisions which returned one county councillor each by first-past-the-post voting for a four-year term of office. Control of the council went from a Conservative Party minority to a majority administration.

<span class="mw-page-title-main">2017 Lincolnshire County Council election</span>

The 2017 Lincolnshire County Council election took place in non-metropolitan Lincolnshire on 4 May 2017 as part of the 2017 local elections in the United Kingdom. A total of 70 councillors were elected across the seven non-metropolitan districts that make up the administrative county of Lincolnshire from 70 single member electoral divisions by first-past-the-post voting for a four-year term of office. The election did not include North Lincolnshire and North East Lincolnshire as they are separate unitary authorities.

References

  1. "Derbyshire electoral review". lgbce.org.uk. Archived from the original on 26 June 2012. Retrieved 12 December 2012.
  2. "The Representation of the People (Form of Canvass) (England and Wales) Regulations 2006, Schedule Part 1". Legislation.gov.uk. 13 October 2011. Retrieved 18 April 2012.
  3. "I have two homes. Can I register at both addresses?". electoralcommission.org.uk. Archived from the original on 31 December 2013. Retrieved 5 January 2011.
  4. "Elections: Your council - Derbyshire County Council". derbyshire.gov.uk. Archived from the original on 3 November 2013.
  5. "The former chairman of Derbyshire County Council, Robin Baldry, will …". thisisderbyshire.co.uk. 26 May 2012. Archived from the original on 5 May 2013.
  6. "HEAGE: Tory councillor defects to UKIP". newsrt.co.uk. 11 March 2013. Archived from the original on 5 May 2013 via Derbyshire Times.