2013 Shropshire Council election

Last updated

2013 Shropshire Council election
  2009 2 May 2013 2017  

All 74 seats to Shropshire Council
38 seats needed for a majority
 First partySecond partyThird party
 
Party Conservative Liberal Democrats Labour
Seats won48129
Seat changeDecrease2.svg6Increase2.svg1Increase2.svg2

Shropshire UK local election 2013 map.svg
Map showing the results of the 2013 elections. Blue showing Conservative, red showing Labour, yellow showing Liberal Democrats, grey showing independents and pink showing ICHC. Striped divisions have mixed representation.

Council control before election

Conservative

Council control after election

Conservative

Elections to Shropshire Council were held on 2 May 2013 as part of the 2013 United Kingdom local elections. These were the second elections to the unitary authority created as part of local government restructuring in Shropshire, following on from the previous elections in 2009. [1] All 74 seats in the 63 electoral divisions (consisting of 53 single member divisions, nine 2-member divisions and one 3-member electoral division) were up for election across Shropshire. At the same time, all town and parish council contested elections took place, most notably including Shrewsbury Town Council. [2]

Contents

The Conservative party retained control of the Council, though with a slightly reduced majority, with 3 fewer seats compared to just prior to the election.

All locally registered electors (British, Irish, Commonwealth and European Union citizens) who were aged 18 or over on Thursday 2 May 2013 were entitled to vote in the local elections. Those who were temporarily away from their ordinary address (for example, away working, on holiday, in student accommodation or in hospital) were also entitled to vote in the local elections. [3]

Previous council

Shropshire Council was Conservative controlled prior to the 2013 election, with 51 Conservative councillors immediately before the election. The Conservatives won 54 seats at the 2009 election, but lost three of these in by-elections during the term.

The Liberal Democrats won 11 seats at the 2009 election, but increased their numbers to 14 during the term, gaining at the by-elections from the Conservatives. Labour had 7 seats, Independent Community and Health Concern one seat, and a final seat was held by an independent.

Changes to divisions

There were no changes to division boundaries or seat allocations since 2009, but two divisions changed their names: 'Minsterley' to 'Rea Valley', and 'Selattyn and Gobowen' to 'Gobowen, Selattyn and Western Rhyn'.

Uncontested elections

In six electoral divisions the number of candidates nominated equalled the number of councillors to be elected, so these seats were uncontested. They were Corvedale, Shawbury, St Oswald, The Meres, Whitchurch North (two members), and Whitchurch South. The seven candidates elected unopposed were all Conservatives. [4] This resulted in more than 20,000 people being refused a vote including the whole town of Whitchurch. [5]

Results

The results, according to the council's website: [6]

Summary

Shropshire Council election, 2013
PartySeatsGainsLossesNet gain/lossSeats %Votes %Votes+/−
  Conservative 48-626,578
  Liberal Democrats 12+115,979
  Labour 9+217,592
  Health Concern 1±01,181
  Independent 4+35,206
  UKIP 000009,318
  Green 000001,080
  BNP 00000615
 Total77,549

Abbey

Abbey
PartyCandidateVotes%±%
Liberal Democrats Hannah Fraser67551.9+6.6
Conservative Maria Felton24719.0-25.9
UKIP Jenny Price16412.6N/A
Labour Paul Morris15411.8N/A
Green John Brown614.7-5.3
Majority428
Turnout 1,30843.2
Liberal Democrats gain from Conservative Swing

Albrighton

Albrighton
PartyCandidateVotes%±%
Conservative Malcolm Pate69055.0
UKIP John Smith27321.8
Labour Deborah Williams-Ruth17313.8
Green Phil Harrison1199.4
Majority
Turnout
Conservative hold Swing

Alveley and Claverley

Alveley and Claverley
PartyCandidateVotes%±%
Conservative Tina Woodward65359.5
UKIP Vanessa Lee27024.6
Liberal Democrats Frederick Voysey17516.0
Majority
Turnout
Conservative hold Swing

Bagley

Bagley
PartyCandidateVotes%±%
Conservative Dean Carroll35432.7-8.8
Liberal Democrats Beverley Baker34631.9-26.6
Labour Co-op Ashley Vaughan-Evans32429.9N/A
Green Kayleigh Gough595.4N/A
Majority8
Turnout 1,08930.5
Conservative gain from Liberal Democrats Swing

Battlefield

Battlefield
PartyCandidateVotes%±%
Conservative Malcolm Price38962.00.0
Labour Co-op Connor Jones23838.0+16.2
Majority15124.1
Turnout 63621.9
Conservative hold Swing

Bayston Hill, Column and Sutton

Bayston Hill, Column and Sutton (3)
PartyCandidateVotes%±%
Labour Ted Clarke2,28621.3+2.4
Labour Jon Tandy2,25621.0+3.1
Labour Jane Mackenzie1,86617.5+0.4
Conservative Will Coles1,13910.6-5.8
Conservative Chris Lewis1,10510.3-5.8
Conservative Tim Milsom9348.7-4.9
UKIP Terrence Lee8487.9N/A
Liberal Democrats Robert Lea2932.7N/A
Majority
Majority
Majority
Turnout 4,06241.5
Labour hold Swing
Labour hold Swing
Labour hold Swing

Belle Vue

Belle Vue
PartyCandidateVotes%±%
Labour Mansel Williams93976.5+28.1
Conservative Valerie Jones28923.5-11.2
Majority650
Turnout 1,23636.1
Labour hold Swing

Bishop's Castle

Bishop's Castle
PartyCandidateVotes%±%
Liberal Democrats Charlotte Barnes90762.0
Conservative James Garnier44930.7
Green Hilary Wendt1077.3
Majority
Turnout
Liberal Democrats hold Swing

Bowbrook

Bowbrook
PartyCandidateVotes%±%
Conservative Peter Adams60465.6-9.7
Labour Co-op Danny Sweeney31734.4+9.7
Majority287
Turnout 93731.5
Conservative hold Swing

Bridgnorth East and Astley Abbotts

Bridgnorth East and Astley Abbotts (2)
PartyCandidateVotes%±%
Conservative Christian Lea70425.0
Conservative William Parr61421.8
UKIP Adrian Thomas44616.6
UKIP Sam Whitehouse43315.4
Liberal Democrats Vanessa Voysey30410.8
Liberal Democrats Glynis Frater29010.3
Majority
Turnout
Conservative hold Swing

Bridgnorth West and Tasley

Bridgnorth West and Tasley (2)
PartyCandidateVotes%±%
Conservative Les Winwood83026.8
Conservative John Hurst-Knight65621.6
UKIP Rod Evans53017.1
UKIP Roger Hipkiss44714.5
Liberal Democrats Helen Howell37212.0
Liberal Democrats Davis Walker2598.4
Majority
Majority
Turnout
Conservative hold Swing

Broseley

Broseley
PartyCandidateVotes%±%
Labour Jean Jones70665.7
UKIP Derek Armstrong23521.9
Conservative Colin Cundy13312.4
Majority
Turnout
Labour hold Swing

Brown Clee

Brown Clee
PartyCandidateVotes%±%
Conservative Robert Tindall48650.5
Independent George Lee25026.0
UKIP Stephen Dean22623.5
Majority
Turnout
Conservative hold Swing

Burnell

Burnell
PartyCandidateVotes%±%
Conservative Tim Barker93765.3-9.8
Liberal Democrats Kate King49934.7+9.8
Majority43830.5
Turnout 1,46243.2
Conservative hold Swing

Castlefields and Ditherington

Castlefields and Ditherington
PartyCandidateVotes%±%
Labour Alan Mosley93786.1+28.9
Conservative Jenny Hodges1089.9-12.1
Liberal Democrats Janine Clarke434.0N/A
Majority829
Turnout 1,09431.3
Labour hold Swing

Cheswardine

Cheswardine
PartyCandidateVotes%±%
Conservative Andrew Davies54570.9
Labour Mark Williams22429.1
Majority
Turnout
Conservative hold Swing

Chirbury and Worthen

Chirbury and Worthen
PartyCandidateVotes%±%
Liberal Democrats Heather Kidd101281.3
Conservative Andrew Sayer23318.7
Majority779
Turnout 1,25652.3
Liberal Democrats hold Swing

Church Stretton and Craven Arms

Church Stretton and Craven Arms (2)
PartyCandidateVotes%±%
Conservative Lee Chapman142328.5
Conservative David Evans128425.7
Liberal Democrats Bob Welch88517.7
Liberal Democrats Anne Dyer74114.9
Labour Jean Gray3827.7
Labour Michael Penn2755.5
Majority
Majority
Turnout
Conservative hold Swing

Clee

Clee
PartyCandidateVotes%±%
Liberal Democrats Richard Huffer72148.7
Conservative James Wheeler65444.2
Labour Sam Mann1057.1
Majority
Turnout
Liberal Democrats gain from Conservative Swing

Cleobury Mortimer

Cleobury Mortimer (2)
PartyCandidateVotes%±%
Health Concern Madge Shineton118135.6
Conservative Gwilym Butler101130.5
UKIP Maurice Alton67320.3
Independent Peter Martin45213.7
Majority
Majority
Turnout
Health Concern hold Swing
Conservative hold Swing

Clun

Clun
PartyCandidateVotes%±%
Liberal Democrats Nigel Hartin71445.7
Conservative Jackie Williams52233.4
UKIP Deborah Brownlee19512.5
Green Janet Phillips1318.4
Majority192
Turnout 1,56650.2
Liberal Democrats hold Swing

Copthorne

Copthorne
PartyCandidateVotes%±%
Conservative Peter Nutting56949.7-4.0
Labour Mark Jones24021.0N/A
UKIP John Price23420.5N/A
Liberal Democrats Trudy Smith1018.8-37.5
Majority229
Turnout 1,15236.7
Conservative hold Swing

Corvedale

Corvedale
PartyCandidateVotes%±%
Conservative Cecilia Motley
Conservative hold Swing

Ellesmere Urban

Ellesmere Urban
PartyCandidateVotes%±%
Conservative Elizabeth Hartley47852.9
Liberal Democrats Brian Knight42547.1
Majority
Turnout
Conservative hold Swing

Gobowen, Selattyn and Weston Rhyn

In 2009 this division was named Selattyn and Gobowen.

Gobowen, Selattyn and Weston Rhyn (2)
PartyCandidateVotes%±%
Conservative David Lloyd74737.7
Conservative Robert Macey65533.1
Independent Paul Jones57829.2
Majority
Majority
Turnout
Conservative hold Swing
Conservative gain from Liberal Democrats Swing

Harlescott

Harlescott
PartyCandidateVotes%±%
Labour Vernon Bushell60468.7+28.9
Conservative Phil Sandford27531.3-2.9
Majority329
Turnout 89026.1
Labour hold Swing

Highley

Highley
PartyCandidateVotes%±%
Independent Dave Tremellen37455.3
UKIP Paul Brown17826.3
Liberal Democrats David Voysey12418.3
Majority
Turnout
Independent gain from Liberal Democrats Swing

Hodnet

Hodnet
PartyCandidateVotes%±%
Conservative Karen Calder54967.6
UKIP Andrew Carter26332.4
Majority
Turnout
Conservative hold Swing

Llanymynech

Llanymynech
PartyCandidateVotes%±%
Conservative Arthur Walpole65467.4
UKIP John Adlington31732.6
Majority
Turnout
Conservative hold Swing

Longden

Longden
PartyCandidateVotes%±%
Liberal Democrats Roger Evans81751.5-6.9
Conservative Dan Morris53133.5-8.1
UKIP Ian Minshall1388.7N/A
Labour Co-op Mohan Jones1006.3N/A
Majority286
Turnout 1,59350.0
Liberal Democrats hold Swing

Loton

Loton
PartyCandidateVotes%±%
Conservative David Roberts92780.1+5.3
Liberal Democrats Fred Smith23019.9-5.3
Majority697
Turnout 1,18738.2
Conservative hold Swing

Ludlow East

Ludlow East
PartyCandidateVotes%±%
Liberal Democrats Tracey Huffer46750.5
Conservative Diane Lyle21022.7
Labour Colin Sheward18419.9
Green Imogen Jones646.9
Majority257
Turnout 94729.4
Liberal Democrats hold Swing

Ludlow North

Ludlow North
PartyCandidateVotes%±%
Conservative Rosanna Taylor-Smith50540.4
Liberal Democrats Andy Boddington42033.6
UKIP Chris Woodward12610.1
Labour James Hooper1098.7
Green Frances Newman695.5
Independent Jennifer Leyton-Purrier211.7
Majority85
Turnout 1,25240.6
Conservative hold Swing

Ludlow South

Ludlow South
PartyCandidateVotes%±%
Liberal Democrats Vivienne Parry63947.2
Conservative Martin Taylor-Smith41530.6
Independent Graeme Perks18213.4
UKIP Maurice Knott1198.8
Majority224
Turnout 1,35842.2
Liberal Democrats gain from Conservative Swing

Market Drayton East

Market Drayton East
PartyCandidateVotes%±%
Conservative John Cadwallader52445.6
Independent Roy Aldcroft27223.7
Labour Darren Taylor24121.0
Independent Roy Tydeman1129.8
Majority
Turnout
Conservative hold Swing

Market Drayton West

Market Drayton West (2)
PartyCandidateVotes%±%
Conservative Roger Hughes68423.1
Conservative David Minnery65322.0
UKIP Steve Glover59220.0
Labour Val Taylor48716.4
Labour Rob Bentley41714.1
BNP Phil Reddall1344.5
Majority
Majority
Turnout
Conservative hold Swing

Meole

Meole
PartyCandidateVotes%±%
Conservative Michael Owen68954.9-16.4
Labour Co-op David French47337.7N/A
Liberal Democrats Margaret Hamer927.3-21.4
Majority216
Turnout 1,27439.9
Conservative hold Swing

Monkmoor

Monkmoor
PartyCandidateVotes%±%
Labour Pam Moseley65862.1+13.3
Conservative Tony Durnell32831.0-20.2
Liberal Democrats Grant Pennington736.9N/A
Majority330
Turnout 1,06731.5
Labour gain from Conservative Swing

Much Wenlock

Much Wenlock
PartyCandidateVotes%±%
Conservative David Turner69148.7
Liberal Democrats Joff Watson29320.7
Independent David Gibbon1409.8
Independent Lesley Durbin1138.0
Independent Phill Hipkiss1138.0
Independent Malcolm Macintyre-Read684.8
Majority
Turnout
Conservative hold Swing

Oswestry East

Oswestry East (2)
PartyCandidateVotes%±%
Independent Peter Cherrington61125.8
Conservative Martin Bennett58324.7
Labour Graeme Currie55123.4
Conservative Chris Schofield45319.1
BNP Jim Matthys1697.1
Majority
Majority
Turnout
Independent gain from Conservative Swing
Conservative hold Swing

Oswestry South

Oswestry South
PartyCandidateVotes%±%
Conservative Keith Barrow48850.0
Green Duncan Kerr33731.7
UKIP Penny Cotton17516.5
Liberal Democrats Romer Hoseason625.8
Majority
Turnout
Conservative hold Swing

Oswestry West

Oswestry West
PartyCandidateVotes%±%
Conservative Vince Hunt58879.4
BNP Alice Matthys14520.6
Majority
Turnout
Conservative hold Swing

Porthill

Porthill
PartyCandidateVotes%±%
Liberal Democrats Anne Chebsey50139.9-16.9
Conservative Judie McCoy43234.4-8.8
Labour Amy Liebich18915.1N/A
Green Alan Whittaker13310.6N/A
Majority69
Turnout 1,26637.3
Liberal Democrats hold Swing

Prees

Prees
PartyCandidateVotes%±%
Conservative Paul Wynn61463.4
UKIP Andrew Irvine-List35536.6
Majority
Turnout
Conservative hold Swing

Quarry and Coton Hill

Quarry and Coton Hill
PartyCandidateVotes%±%
Liberal Democrats Andrew Bannerman45147.1+5.3
Conservative Carol Foster31132.5+1.0
Labour Co-op John Lewis19620.5-2.6
Majority140
Turnout 96630.7
Liberal Democrats gain from Conservative Swing

Radbrook

Radbrook
PartyCandidateVotes%±%
Conservative Keith Roberts59245.8-5.2
Liberal Democrats Christine Tinker39830.8-18.2
Labour Jeanette Petherbridge30223.4N/A
Majority194
Turnout 1,30238.5
Conservative hold Swing

Rea Valley

In 2009 this division was named Minsterley.

Rea Valley
PartyCandidateVotes%±%
Conservative Tudor Bebb51249.0-11.5
UKIP Peter Lewis29828.5N/A
Labour Co-op Joe Crosland13713.1N/A
Liberal Democrats David Ellams989.4-15.6
Majority214
Turnout 1,04832.5
Conservative hold Swing

Ruyton and Baschurch

Ruyton and Baschurch
PartyCandidateVotes%±%
Conservative Nicholas Bardsley37134.6
UKIP Jonathan Carr33130.9
Liberal Democrats Colin Case27926.0
Labour Netty Brook918.5
Majority
Turnout
Conservative hold Swing

Severn Valley

Severn Valley
PartyCandidateVotes%±%
Conservative Claire Wild94678.2N/A
Labour Co-op Jeevan Jones17414.4N/A
Liberal Democrats Rob Harper907.4N/A
Majority772
Turnout 1,22636.2
Conservative hold Swing

Shawbury

Shawbury
PartyCandidateVotes%±%
Conservative Simon Jones
Conservative hold Swing

Shifnal North

Shifnal North
PartyCandidateVotes%±%
Independent Kevin Turley52440.1
Conservative Gordon Tonkinson44634.2
UKIP Richard Choudhary23417.9
Independent John Horne1027.8
Majority
Turnout
Independent gain from Conservative Swing

Shifnal South and Cosford

Shifnal South and Cosford
PartyCandidateVotes%±%
Conservative Stuart West65859.8
UKIP Andrew Mitchell44340.2
Majority
Turnout
Conservative hold Swing

St Martin's

St Martin's
PartyCandidateVotes%±%
Conservative Steve Davenport46548.8
Labour Hannah Guntrip30131.6
Independent Neil Graham18719.6
Majority
Turnout
Conservative hold Swing

St Oswald

St Oswald
PartyCandidateVotes%±%
Conservative Joyce Barrow
Conservative hold Swing

Sundorne

Sundorne
PartyCandidateVotes%±%
Labour Kevin Pardy54566.2+30.1
Conservative Karen Burgoyne21926.6-19.6
BNP Karl Foulkes597.2-10.4
Majority326
Turnout 83326.3
Labour gain from Conservative Swing

Tern

Tern
PartyCandidateVotes%±%
Conservative John Everall72161.6-0.4
Labour Co-op Kathryn Brooke24921.3N/A
Liberal Democrats Helen Woodman20017.1-20.9
Majority472
Turnout 1,18333.2
Conservative hold Swing

The Meres

The Meres
PartyCandidateVotes%±%
Conservative Brian Williams
Conservative hold Swing

Underdale

Underdale
PartyCandidateVotes%±%
Liberal Democrats Miles Kenny66164.6-3.1
Labour Co-op Sue Batchelor16215.8+6.4
UKIP Jan Allmark12211.9N/A
Conservative Robert Osborne787.6-2.4
Majority499
Turnout 1,03232.4
Liberal Democrats hold Swing

Wem

Wem (2)
PartyCandidateVotes%±%
Liberal Democrats John Mellings1,32239.0
Independent Pauline Dee1,10732.7
Conservative Peter Broomhall78223.1
BNP Ian Deakin1085.3
Majority
Majority
Turnout
Liberal Democrats hold Swing
Independent hold Swing

Whitchurch North

Whitchurch North (2)
PartyCandidateVotes%±%
Conservative Thomas Biggins
Conservative Peggy Mullock
Conservative hold Swing

Whitchurch South

Whitchurch South
PartyCandidateVotes%±%
Conservative Gerald Dakin
Conservative hold Swing

Whittington

Whittington
PartyCandidateVotes%±%
Conservative Steve Charmley51756.6
UKIP David Baynham39743.4
Majority
Turnout
Conservative hold Swing

Worfield

Worfield
PartyCandidateVotes%±%
Conservative Michael Wood60770.3
UKIP Brian Seymour25629.7
Majority
Turnout
Conservative hold Swing

Related Research Articles

<span class="mw-page-title-main">Shrewsbury and Atcham</span> Former non-metropolitan district in England

<span class="mw-page-title-main">North Shropshire</span> Local government district in England

<span class="mw-page-title-main">Borough of Oswestry</span>

<span class="mw-page-title-main">Wiltshire Council</span> Unitary authority in South West England

Wiltshire Council, known between 1889 and 2009 as Wiltshire County Council, is a unitary authority which governs the district of Wiltshire, which covers the majority of the ceremonial county of the same name in South West England. The council has been controlled by the Conservative Party since 2000, and has its headquarters at County Hall in Trowbridge.

<span class="mw-page-title-main">Shropshire Council</span> Unitary authority in England

Shropshire Council, known between 1980 and 2009 as Shropshire County Council and from 1889 to 1980 as Salop County Council, is a unitary authority which governs the district of Shropshire, which is part of the ceremonial county of the same name in the West Midlands of England. The council's headquarters are at Shirehall in Shrewsbury, the largest town in the district and the county town of Shropshire.

Shrewsbury Town Council is the town council of Shrewsbury in Shropshire, established in April 2009 as part of structural changes to local government in England that abolished Shrewsbury and Atcham Borough Council and created in its place the unitary Shropshire Council. Shrewsbury was previously unparished, with the Mayor of Shrewsbury and Atcham acting as the town's mayor. With a population of over 76,000, Shrewsbury is the fourth-most populous parish in England.

Shropshire Council elections are held every four years, and since 2009 74 councillors have been elected from 63 electoral divisions.

Elections to Shropshire Council in England were held on 4 June 2009. These were the first elections to the new unitary body, which replaced Shropshire County Council and the district councils of Bridgnorth, North Shropshire, Oswestry, Shrewsbury and Atcham and South Shropshire on 1 April as part of the 2009 local government restructuring across England.

<span class="mw-page-title-main">2011 United Kingdom local elections</span>

The 2011 United Kingdom local elections was held on Thursday May 5. In England, direct elections were held in all 36 Metropolitan boroughs, 194 Second-tier district authorities, 49 unitary authorities and various mayoral posts, meaning local elections took place in all parts of England with the exception of seven unitary authorities, and seven districts and boroughs. For the majority of English districts and the 25 unitary authorities that are elected "all out" these were the first elections since 2007. In Northern Ireland, there were elections to all 26 local councils. Elections also took place to most English parish councils.

<span class="mw-page-title-main">2013 United Kingdom local elections</span>

The 2013 United Kingdom local elections took place on Thursday 2 May 2013. Elections were held in 35 English councils: all 27 non-metropolitan county councils and eight unitary authorities, and in one Welsh unitary authority. Direct mayoral elections took place in Doncaster and North Tyneside. These elections last took place on the 4 June 2009 at the same time as the 2009 European Parliament Elections, except for County Durham, Northumberland and the Anglesey where elections last took place in 2008.

<span class="mw-page-title-main">2013 East Sussex County Council election</span>

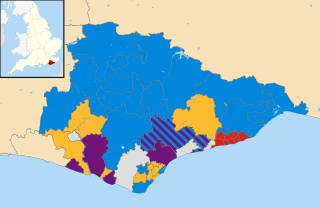
The East Sussex County Council election, 2013 took place on 2 May 2013 as part of the 2013 United Kingdom local elections. All 49 councillors of East Sussex County Council were elected from 44 electoral divisions, which return either one or two councillors each by first-past-the-post voting for a four-year term of office. The electoral divisions were the same as those used at the previous election in 2009. No elections were held in Brighton and Hove, which is a unitary authority outside the area covered by the County Council.

<span class="mw-page-title-main">2013 Hampshire County Council election</span>

An election to Hampshire County Council took place on 2 May 2013 as part of the 2013 United Kingdom local elections. 78 councillors were elected from 75 electoral divisions, which returned either one or two county councillors each by first-past-the-post voting for a four-year term of office. The electoral divisions were the same as those of the previous election in 2009. No elections were held in Portsmouth and Southampton, which are unitary authorities outside the area covered by the County Council. The election saw the Conservative Party retain overall control of the council, with a reduced majority of five councillors.

<span class="mw-page-title-main">2013 Kent County Council election</span>

The Kent County Council election, 2013 was an election to all 84 seats on Kent County Council held on Thursday 2 May as part of the 2013 United Kingdom local elections. 84 councillors were elected from 72 electoral divisions, which returned either one or two county councillors each by first-past-the-post voting for a four-year term of office. The electoral divisions were the same as those used at the previous election in 2009. No elections were held in Medway, which is a unitary authority outside the area covered by the County Council. The election saw the Conservative Party narrowly retain overall control of the council.

<span class="mw-page-title-main">2013 Durham County Council election</span>

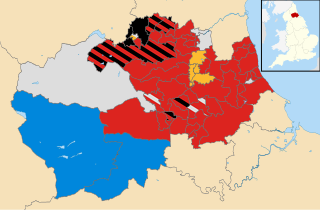
An election to Durham County Council took place on 2 May 2013 as part of the 2013 United Kingdom local elections. Following a boundary review, 126 councillors were elected from 63 electoral divisions which returned either one, two or three councillors each by first-past-the-post voting for a four-year term of office. The previous election took place in 2008 in advance of the council becoming a unitary authority after the 2009 changes to local government. The election saw the Labour Party increase their majority on the council.

<span class="mw-page-title-main">2013 Lincolnshire County Council election</span>

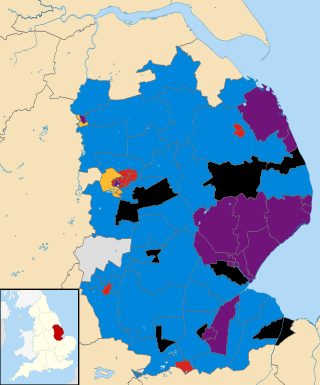
An election to Lincolnshire County Council took place on 2 May 2013 as part of the 2013 United Kingdom local elections. 77 electoral divisions returned one county councillor each by first-past-the-post voting for a four-year term of office. The electoral divisions were the same as those used at the previous election in 2009. No elections were held in North Lincolnshire or North East Lincolnshire, which are unitary authorities outside the area covered by the County Council.

<span class="mw-page-title-main">2013 Cornwall Council election</span>

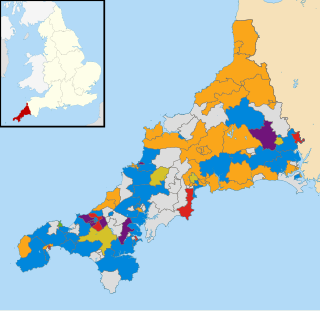
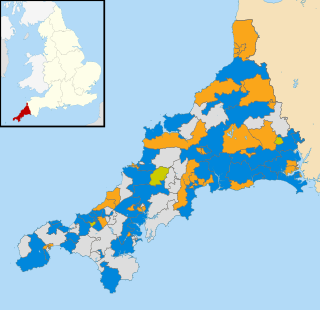
The Cornwall Council election, 2013, was an election for all 123 seats on the council. Cornwall Council is a unitary authority that covers the majority of the ceremonial county of Cornwall, with the exception of the Isles of Scilly which have an independent local authority. The elections took place concurrently with other local elections across England and Wales.

<span class="mw-page-title-main">2013 Staffordshire County Council election</span> UK local elections

An election to Staffordshire County Council took place on 2 May 2013 as part of the 2013 United Kingdom local elections. 62 electoral divisions returned one county councillor each by first-past-the-post voting for a four-year term of office. Following a boundary review, new electoral division boundaries were established for this election. No elections were held in Stoke-on-Trent, which is a unitary authority outside the area covered by the County Council. The council continues to be administered on the Leader and Cabinet model.

<span class="mw-page-title-main">2015 United Kingdom local elections</span>

The 2015 United Kingdom local elections were held on Thursday 7 May 2015, the same day as the general election for the House of Commons of the United Kingdom.

<span class="mw-page-title-main">2017 Cornwall Council election</span>

The 2017 Cornwall Council election was held on 4 May 2017 as part of the 2017 local elections in the United Kingdom. 122 councillors were elected from the 121 electoral divisions of Cornwall Council, which returned either one or two councillors each by first-past-the-post voting for a four-year term of office. Although originally scheduled to take place on the same day, the election in the Bodmin St Petroc ward was countermanded following the death of Liberal Democrat candidate Steve Rogerson and was held on 8 June.

References

  1. Clements, Rob (3 December 2012). "Local Elections 2013 - Commons Library Standard Note - UK Parliament". parliament.uk. Archived from the original on 12 December 2012.
  2. "Support dropped for outdated links | Shropshire Council". shropshire.gov.uk.
  3. "The Representation of the People (Form of Canvass) (England and Wales) Regulations 2006, Schedule Part 1". Legislation.gov.uk. 13 October 2011. Retrieved 18 April 2012.
  4. Shropshire Council Notices of uncontested election – Unitary elections
  5. "Uncontested election article". Shropshire Star. 18 April 2013. Retrieved 14 January 2015.
  6. "Results – full text list". Shropshire Council. Archived from the original on 6 June 2013. Retrieved 29 June 2013.