2017 Shropshire Council election

Last updated

2017 Shropshire Council election
Flag of Shropshire.svg
  2013 4 May 2017 2021  

All 74 seats to Shropshire Council
38 seats needed for a majority
 First partySecond partyThird party
 
Party Conservative Liberal Democrats Labour
Seats won49128
Seat changeIncrease2.svg1Steady2.svgDecrease2.svg1

Shropshire UK local election 2017 map.svg
Map showing the results of the 2017 elections. Striped divisions have mixed representation.

Council control before election

Conservative

Council control after election

Conservative

The 2017 Shropshire Council election took place on 4 May 2017 as part of the 2017 local elections in the United Kingdom. [1] All 74 councillors were elected from 63 electoral divisions which return either one, two or three councillors each by first-past-the-post voting for a four-year term of office.

Contents

Results

Summary

Shropshire Council election, 2017
PartySeatsGainsLossesNet gain/lossSeats %Votes %Votes+/−
  Conservative 4932+148.7851,215
  Liberal Democrats 12-20.0821,078
  Labour 8-116.2717,083
  Green 110+17.487,850
  Independent 3-15.175,426
  Health Concern 11.251,311
  UKIP 00.95994
Federalist Party of the United Kingdom 0.0879
 Total104,986

All wards are single seat unless otherwise stated

The results below are sourced from the Shropshire Council website. [2]

Abbey

Abbey
PartyCandidateVotes%±%
Liberal Democrats Hannah Fraser79055.59
Conservative Georgina Alison Boulger34524.28
Labour Mark James Healey22315.69
UKIP John Kinsey Price634.43
Majority
Turnout 1421
Liberal Democrats hold Swing

Albrighton

Albrighton
PartyCandidateVotes%±%
Conservative Malcolm Pate88275.27
Independent Phillip Michael Harrison41932.21
Majority
Turnout 1301
Conservative hold Swing

Alveley and Claverley

Alveley and Claverley
PartyCandidateVotes%±%
Conservative Tina Woodward91975.27
Liberal Democrats Colin Taylor30224.73
Majority
Turnout 1221
Conservative hold Swing

Bagley

Bagley
PartyCandidateVotes%±%
Conservative Alexander George Phillips51139.95
Liberal Democrats Beverley Baker38530.1
Labour Wynn Davies38329.95
Majority
Turnout 1279
Conservative hold Swing

Battlefield

Battlefield
PartyCandidateVotes%±%
Conservative Dean Spencer Carroll47657.28
Labour Gianluca Cerritelli28534.3
Green Chris Davenport708.42
Majority
Turnout 831
Conservative hold Swing

Bayston Hill, Column and Sutton

Bayston Hill, Column and Sutton (3 seats)
PartyCandidateVotes%±%
Labour Ted Clarke 2,318 55.63
Labour Tony Parsons 1,820 43.68
Labour Jane Mackenzie 1,720 41.28
Conservative Janine Hayter131531.56
Conservative Andrea Caroline Hall120628.94
Conservative Ryan Peter Alan Harrison111426.73
Liberal Democrats Will Coles47411.38
Green Chris Lemon3187.63
UKIP Ray Graham2967.10
Green Josh Cockburn2766.62
Majority
Majority
Majority
Turnout 4174
Labour hold Swing
Labour hold Swing
Labour hold Swing

Belle Vue

Belle Vue
PartyCandidateVotes%±%
Labour Harry Taylor64343.01
Liberal Democrats Daniel Adam Clark42328.29
Conservative Simon James Wray36224.21
Green Dave Latham674.48
Majority
Turnout 1495
Labour hold Swing

Bishop's Castle

Bishop's Castle
PartyCandidateVotes%±%
Liberal Democrats Jonathan Keeley96073.62
Conservative Christopher John Tyler27320.94
Majority
Turnout 1304
Liberal Democrats hold Swing

Bowbrook

Bowbrook
PartyCandidateVotes%±%
Conservative Peter Adams68868.66
Liberal Democrats David Arwyn Ellams16116.07
Green Peter John Gilbert15315.27
Majority
Turnout 1002
Conservative hold Swing

Bridgnorth East and Astley Abbotts

Bridgnorth East and Astley Abbotts (2 seats)
PartyCandidateVotes%±%
Conservative Christian Lea 1,079 55.65
Conservative William Parr 930 47.96
Labour Julia Buckley55128.42
Liberal Democrats Naomi Vanessa Voysey44022.69
Liberal Democrats Richard Antony Fox41821.56
Majority
Majority
Turnout 1950
Conservative hold Swing

Bridgnorth West and Tasley

Bridgnorth West and Tasley (2 seats)
PartyCandidateVotes%±%
Conservative Les Winwood 1,098 58.78
Conservative Elliott Liam Lynch 873 46.73
Liberal Democrats David Norman Cooper51127.36
Liberal Democrats Stephen Golding Barras45824.52
Labour Mick Lane31216.70
UKIP Rod Evans1357.23
Majority
Majority
Turnout 1876
Conservative hold Swing

Broseley

Broseley
PartyCandidateVotes%±%
Conservative Simon Christopher Harris89260.6
Labour Gavin Nocholas Goodall58039.4
Majority
Turnout 1472
Conservative gain from Labour Swing

Brown Clee

Brown Clee
PartyCandidateVotes%±%
Conservative Robert Tindall88779.77
Liberal Democrats Frederick David Voysey22520.23
Majority
Turnout 1112
Conservative hold Swing

Burnell

Burnell
PartyCandidateVotes%±%
Conservative Dan Morris84749.1
Liberal Democrats Kate King81447.19
Green Tereza Hayek643.71
Majority
Turnout 1725
Conservative hold Swing

Castlefields and Ditherington

Castlefields and Ditherington
PartyCandidateVotes%±%
Labour Alan Mosley85774.2
Conservative Robert Charles Osborne18015.58
UKIP Sylvia Loosley605.19
Green Claire Judith585.02
Majority
Turnout 1155
Labour hold Swing

Cheswardine

Cheswardine
PartyCandidateVotes%±%
Conservative Rob Gittins73576.01
Labour Len Surridge23223.99
Majority
Turnout 967
Conservative hold Swing

Chirbury and Worthen

Chirbury and Worthen
PartyCandidateVotes%±%
Liberal Democrats Heather Kidd100377.75
Conservative Phillip Dennis Morgan28722.25
Majority
Turnout 1290
Liberal Democrats hold Swing

Church Stretton and Craven Arms

Church Stretton and Craven Arms (2 seats)
PartyCandidateVotes%±%
Conservative Lee Chapman 1,579 52.58
Conservative David Evans 1,536 51.15
Liberal Democrats Sam Jones81527.14
Liberal Democrats Steve Jones71123.68
Green Steve Hale40413.45
Green Hilary Raborg Houchin Wendt38812.92
Majority
Majority
Turnout 3021
Conservative hold Swing

Clee

Clee
PartyCandidateVotes%±%
Liberal Democrats Richard Huffer89960.99
Conservative James Wheeler57539.01
Majority
Turnout 1474
Liberal Democrats hold Swing

Cleobury Mortimer

Cleobury Mortimer (2 seats)
PartyCandidateVotes%±%
Conservative Gwilym Butler 1,349 64.98
Health Concern Madge Shineton 1,311 63.15
Labour John Mayers Rodgers31515.17
Liberal Democrats Lucinda Faye Timmins25512.28
Liberal Democrats Brett Lewis Jenkins1919.20
Majority
Majority
Turnout 2084
Conservative hold Swing
Health Concern hold Swing

Clun

Clun
PartyCandidateVotes%±%
Liberal Democrats Nigel Hartin91155.86
Conservative Sarah Jane Smith72044.14
Majority
Turnout 1631
Liberal Democrats hold Swing

Copthorne

Copthorne
PartyCandidateVotes%±%
Conservative Peter Nutting73559.85
Liberal Democrats Rob Lea28723.37
Green Gareth Stephen Egarr15112.3
UKIP Frank James Henry Burgess554.48
Majority
Turnout 1228
Conservative hold Swing

Corvedale

Corvedale
PartyCandidateVotes%±%
Conservative Cecilia Motley105880.4
Labour Manda Scott25819.6
Majority
Turnout 1316
Conservative hold Swing

Ellesmere Urban

Ellesmere Urban
PartyCandidateVotes%±%
Conservative Elizabeth Hartley67167.44
Liberal Democrats Rod Keyes32432.56
Majority
Turnout 995
Conservative hold Swing

Gobowen, Selattyn and Weston Rhyn

Gobowen, Selattyn and Weston Rhyn (2 seats)
PartyCandidateVotes%±%
Conservative Robert Macey 826 49.76
Conservative Thomas Mark Jones 748 45.06
Labour Craig David Emery39723.92
Green Paul Herbert35321.27
Labour Jack Roberts33520.18
Liberal Democrats Henry John Stevens27916.81
Green Stephen James Froggatt1468.80
Majority
Majority
Turnout 1663
Conservative hold Swing

Harlescott

Harlescott
PartyCandidateVotes%±%
Labour Ioan Gruffydd Jones55257.14
Conservative Martin Richard Croll32433.54
UKIP Marino Bernardo Pacini909.32
Majority
Turnout 966
Labour hold Swing

Highley

Highley
PartyCandidateVotes%±%
Independent Dave Tremellen42743.13
Conservative Edward Gilliams28228.48
Labour Nicki Barker17017.17
Independent George Christopher Court11111.21
Majority
Turnout 990
Independent hold Swing

Hodnet

Hodnet
PartyCandidateVotes%±%
Conservative Karen Calder71682.02
Labour Charles Henry Warren Love15717.98
Majority
Turnout 873
Conservative hold Swing

Llanymynech

Llanymynech
PartyCandidateVotes%±%
Conservative Matt Lee67162.07
Green Olly Rose24923.03
Liberal Democrats John Alexander Thornton16114.89
Majority
Turnout 1081
Conservative hold Swing

Longden

Longden
PartyCandidateVotes%±%
Liberal Democrats Roger Evans98661.2
Conservative Catherine Angela Roberts56034.76
UKIP Edward Arthur Higginbottom654.03
Majority
Turnout 1611
Liberal Democrats hold Swing

Loton

Loton
PartyCandidateVotes%±%
Conservative Ed Potter99474.57
Liberal Democrats Lisa Michelle Walton21315.98
Green Michelle Jane Sutton-Jones1269.45
Majority
Turnout 1333
Conservative hold Swing

Ludlow East

Ludlow East
PartyCandidateVotes%±%
Liberal Democrats Tracey Huffer67864.2
Conservative Patricia Ann Price23522.25
Labour Colin Eric James Sheward14313.54
Majority
Turnout 1056
Liberal Democrats hold Swing

Ludlow North

Ludlow North
PartyCandidateVotes%±%
Liberal Democrats Andy Boddington89768.89
Conservative Simon Richard Harris30323.27
Green Linda Mary Senior544.15
UKIP Chris Woodward483.69
Majority
Turnout 1302
Liberal Democrats gain from Conservative Swing

Ludlow South

Ludlow South
PartyCandidateVotes%±%
Liberal Democrats Viv Parry91865.81
Conservative Fiona Margaret Pizzoni37626.95
Labour Michael John Penn1017.24
Majority
Turnout 1395
Liberal Democrats gain from Conservative Swing

Market Drayton East

Market Drayton East
PartyCandidateVotes%±%
Conservative Roy Aldcroft82973.23
Labour Rob Bentley30326.77
Majority
Turnout 1132
Conservative hold Swing

Market Drayton West

Market Drayton West (2 seats)
PartyCandidateVotes%±%
Conservative David Minnery 840 49.91
Conservative Roger Hughes 835 49.61
Labour Darren Michael Taylor47228.05
Labour Lin Surridge46227.45
Green Rodger Sydney Bradley31818.89
Majority
Majority
Turnout 1706
Conservative hold Swing

Meole

Meole
PartyCandidateVotes%±%
Conservative Nic Laurens71055.43
Labour Rod Turner35227.48
Liberal Democrats Slawomir Adam Fejfer15512.1
Green Tom Heyek645
Majority
Turnout 1281
Conservative hold Swing

Monkmoor

Monkmoor
PartyCandidateVotes%±%
Labour Pam Moseley69371.15
Conservative Valerie Adele Lingen-Jones28128.85
Majority
Turnout 974
Labour hold Swing

Much Wenlock

Much Wenlock (uncontested)
PartyCandidateVotes%±%
Conservative David Turner00
Majority
Turnout N/A
Conservative hold Swing

Oswestry East

Oswestry East (2 seats)
PartyCandidateVotes%±%
Conservative John William Price 778 45.39
Conservative Clare Victoria Aspinall 605 35.30
Independent Peter Cherrington34219.95
Labour Carl Hopley31518.38
Independent Martin Bennett28916.86
Green Mike Isherwood28616.69
Green David Matthew Bennett25414.82
Liberal Democrats Amanda Jane Woof975.66
Liberal Democrats Lee Kelvin Bennett704.08
Majority
Majority
Turnout 1729
Conservative gain from Independent Swing
Conservative hold Swing

Oswestry South

Oswestry South
PartyCandidateVotes%±%
Conservative David Paul Milner70352.35
Green Duncan Kerr64047.65
Majority
Turnout 1343
Conservative hold Swing

Oswestry West

Oswestry West
PartyCandidateVotes%±%
Conservative Vince Hunt43246.75
Green Barry John Edwards42145.56
Liberal Democrats Romer Wilfred Hoseason717.68
Majority
Turnout 924
Conservative hold Swing

Porthill

Porthill
PartyCandidateVotes%±%
Green Julian David Geoffrey Dean66241.69
Liberal Democrats David Craddock43127.14
Conservative Judie McCoy49531.17
Majority
Turnout 1588
Green gain from Liberal Democrats Swing

Prees

Prees
PartyCandidateVotes%±%
Conservative Paul Wynn72262.13
Independent Andrew Gordon Whyte44037.87
Majority
Turnout 1162
Conservative hold Swing

Quarry and Coton Hill

Quarry and Coton Hill
PartyCandidateVotes%±%
Liberal Democrats Nat Green62556.36
Conservative Arlinda Ballcaj35632.1
Green Huw Richard Wystan Peach12811.54
Majority
Turnout 1109
Liberal Democrats hold Swing

Radbrook

Radbrook
PartyCandidateVotes%±%
Conservative Keith Roberts80958.62
Liberal Democrats Ian Edward Cartwright36726.59
Green John Patrick Newnham20414.78
Majority
Turnout 1380
Conservative hold Swing

Rea Valley

Rea Valley
PartyCandidateVotes%±%
Conservative Nick Hignett80355.23
Liberal Democrats Susan Catherine Lockwood56538.86
Green Jonathan Colin Brown865.91
Majority
Turnout 1454
Conservative hold Swing

Ruyton and Baschurch

Ruyton and Baschurch
PartyCandidateVotes%±%
Conservative Nick Bardsley85273.64
Labour Graeme Rodger Currie16614.35
Federalist Party Robert John Jones796.83
Liberal Democrats Alex Jones605.19
Majority
Turnout 1157
Conservative hold Swing

Severn Valley

Severn Valley
PartyCandidateVotes%±%
Conservative Claire Wild107780.01
Green Emma Bullard14210.55
Liberal Democrats Fred Smith1279.44
Majority
Turnout 1346
Conservative hold Swing

Shawbury

Shawbury
PartyCandidateVotes%±%
Conservative Simon Jones78676.46
Green Steve Boulding24223.54
Conservative hold Swing

Shifnal North

Shifnal North
PartyCandidateVotes%±%
Independent Kevin Turley99281.18
Conservative William Colin Cundy23018.82
Majority
Turnout 1222
Independent hold Swing

Shifnal South and Cosford

Shifnal South and Cosford
PartyCandidateVotes%±%
Conservative Stuart West66857.14
Independent Andy Mitchell36831.48
Liberal Democrats Jolyon Thomas Hartin13311.38
Majority
Turnout 1169
Conservative hold Swing

St Martin's

St Martin's
PartyCandidateVotes%±%
Conservative Steve Davenport67466.54
Labour Neil Graham33933.46
Majority
Turnout 1013
Conservative hold Swing

St Oswald

St Oswald
PartyCandidateVotes%±%
Conservative Joyce Barrow68259.36
Independent Len Evans46740.64
Majority
Turnout 1149
Conservative hold Swing

Sundorne

Sundorne
PartyCandidateVotes%±%
Labour Kevin Pardy61873.92
Conservative Kayleigh Sarah Gough21826.08
Majority
Turnout 836
Labour hold Swing

Tern

Tern
PartyCandidateVotes%±%
Conservative Lezley May Picton81662.62
Liberal Democrats Helen Woodman20515.73
Labour Co-op John Olaf Lewis20415.66
Green Tony Newby785.99
Majority
Turnout 1303
Conservative hold Swing

The Meres

The Meres
PartyCandidateVotes%±%
Conservative Brian Williams90565.58
Independent Patrick James Manners19313.99
Liberal Democrats Julie Marion Bushell16511.96
Green Carlo Umberto Ferri1178.48
Majority
Turnout 1380
Conservative hold Swing

Underdale

Underdale
PartyCandidateVotes%±%
Liberal Democrats David George Vasmer33936.37
Labour Peter Liebich27229.18
Conservative Ken Vine25727.58
Green Charlie Bell646.87
Majority
Turnout 932
Liberal Democrats hold Swing

Wem

Wem (2 seats)
PartyCandidateVotes%±%
Liberal Democrats John Mellings 1,444 63.06
Independent Pauline Dee 1,202 52.49
Conservative Peter Broomhall81335.50
Conservative Mark Whittle39617.29
Green Mel Draycott25511.14
Majority
Majority
Turnout 2298
Liberal Democrats hold Swing
Independent hold Swing

Whitchurch North

Whitchurch North (2 seats)
PartyCandidateVotes%±%
Conservative Peggy Mullock 1,016 72.99
Conservative Thomas Biggins 681 48.92
Green Liz Lever42130.24
Liberal Democrats Benedict John Alexander Jephcott18813.51
Green William Lloyd Jones1339.55
Majority
Majority
Turnout 1400
Conservative hold Swing

Whitchurch South

Whitchurch South
PartyCandidateVotes%±%
Conservative Gerald Dakin42252.62
Liberal Democrats Tom Thornhill15619.45
UKIP Andrea Christabel Allen13216.46
Independent William Morris Hilton9211.47
Majority
Turnout 802
Conservative hold Swing

Whittington

Whittington
PartyCandidateVotes%±%
Conservative Steve Charmley61353.44
Liberal Democrats David Walker29825.98
Green Edward David Goff15213.25
Independent Christopher Lee Jones847.32
Majority
Turnout 1147
Conservative hold Swing

Worfield

Worfield
PartyCandidateVotes%±%
Conservative Michael Wood75476.78
Labour Ann Rochelle11711.91
Liberal Democrats Helen Elizabeth Howell11111.3
Majority
Turnout 76.78
Conservative hold Swing

Related Research Articles

<span class="mw-page-title-main">Telford and Wrekin</span> Borough in Shropshire, England

Telford and Wrekin is a borough and unitary authority in Shropshire, England. In 1974, a non-metropolitan district of Shropshire was created called The Wrekin, named after a prominent hill to the west of Telford. In 1998, the district became a unitary authority and was renamed "Telford and Wrekin", which remains part of the Shropshire ceremonial county and shares institutions such as the Fire and Rescue Service and Community Health with the rest the county.

Telford and Wrekin Council elections are held every four years. Telford and Wrekin Council is the local authority for the unitary authority of Telford and Wrekin in the ceremonial county of Shropshire, England. Until 1 April 1998 it was a non-metropolitan district. Since the last boundary changes in 2015, 54 councillors have been elected from 30 wards.

The wards and electoral divisions in the United Kingdom are electoral districts at sub-national level, represented by one or more councillors. The ward is the primary unit of English electoral geography for civil parishes and borough and district councils, the electoral ward is the unit used by Welsh principal councils, while the electoral division is the unit used by English county councils and some unitary authorities. Each ward/division has an average electorate of about 5,500 people, but ward population counts can vary substantially. As of 2021 there are 8,694 electoral wards/divisions in the UK. An average area of wards in the United Kingdom is 27 km2.

<span class="mw-page-title-main">Shropshire Council</span> Unitary authority in England

Shropshire Council, known between 1980 and 2009 as Shropshire County Council and from 1889 to 1980 as Salop County Council, is a unitary authority which governs the district of Shropshire, which is part of the ceremonial county of the same name in the West Midlands of England. The council's headquarters are at Shirehall in Shrewsbury, the largest town in the district and the county town of Shropshire.

Shrewsbury Town Council is the town council of Shrewsbury in Shropshire, established in April 2009 as part of structural changes to local government in England that abolished Shrewsbury and Atcham Borough Council and created in its place the unitary Shropshire Council. Shrewsbury was previously unparished, with the Mayor of Shrewsbury and Atcham acting as the town's mayor. With a population of over 76,000, Shrewsbury is the fourth-most populous parish in England.

Shropshire Council elections are held every four years, and since 2009 74 councillors have been elected from 63 electoral divisions.

Elections to Shropshire Council in England were held on 4 June 2009. These were the first elections to the new unitary body, which replaced Shropshire County Council and the district councils of Bridgnorth, North Shropshire, Oswestry, Shrewsbury and Atcham and South Shropshire on 1 April as part of the 2009 local government restructuring across England.

The 2005 elections to Shropshire County Council took place on 5 May 2005, alongside the 2005 general election across the entire United Kingdom.

<span class="mw-page-title-main">2013 Shropshire Council election</span>

Elections to Shropshire Council were held on 2 May 2013 as part of the 2013 United Kingdom local elections. These were the second elections to the unitary authority created as part of local government restructuring in Shropshire, following on from the previous elections in 2009. All 74 seats in the 63 electoral divisions were up for election across Shropshire. At the same time, all town and parish council contested elections took place, most notably including Shrewsbury Town Council.

<span class="mw-page-title-main">2017 Scottish local elections</span>

The 2017 Scottish local elections were held on Thursday 4 May, in all 32 local authorities. The SNP retained its position as the largest party in terms of votes and councillors, despite suffering minor losses. The Conservatives made gains and displaced Labour as the second largest party, while the Liberal Democrats suffered a net loss of councillors despite increasing their share of the vote. Minor parties and independents polled well; and independent councillors retained majority control over the three island councils. For the first time since the local government reforms in 1995, all mainland councils fell under no overall control.

<span class="mw-page-title-main">2017 United Kingdom local elections</span>

The 2017 United Kingdom local elections were held on Thursday 4 May 2017. Local elections were held across Great Britain, with elections to 35 English local authorities and all councils in Scotland and Wales.
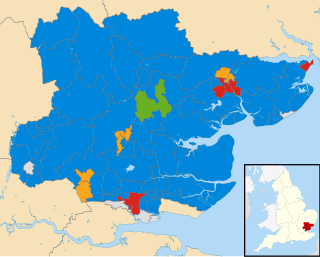
<span class="mw-page-title-main">2017 Cambridgeshire County Council election</span>

The 2017 Cambridgeshire County Council election was held on 4 May 2017 as part of the 2017 local elections in the United Kingdom. All 61 councillors were elected from 59 electoral divisions, which returned either one or two county councillors each by first-past-the-post voting for a four-year term of office.

<span class="mw-page-title-main">2017 Lincolnshire County Council election</span>

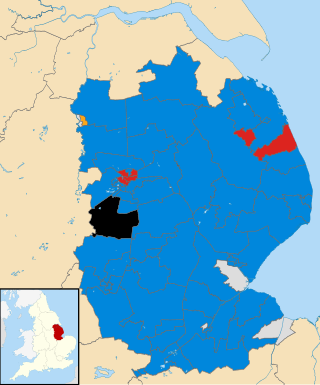
The 2017 Lincolnshire County Council election took place in non-metropolitan Lincolnshire on 4 May 2017 as part of the 2017 local elections in the United Kingdom. A total of 70 councillors were elected across the seven non-metropolitan districts that make up the administrative county of Lincolnshire from 70 single member electoral divisions by first-past-the-post voting for a four-year term of office. The election did not include North Lincolnshire and North East Lincolnshire as they are separate unitary authorities.

<span class="mw-page-title-main">2017 Cornwall Council election</span>

The 2017 Cornwall Council election was held on 4 May 2017 as part of the 2017 local elections in the United Kingdom. 122 councillors were elected from the 121 electoral divisions of Cornwall Council, which returned either one or two councillors each by first-past-the-post voting for a four-year term of office. Although originally scheduled to take place on the same day, the election in the Bodmin St Petroc ward was countermanded following the death of Liberal Democrat candidate Steve Rogerson and was held on 8 June.

<span class="mw-page-title-main">2017 Wiltshire Council election</span>

The 2017 Wiltshire Council election took place on 4 May 2017 as part of the 2017 local elections in the United Kingdom. All 98 councillors were elected from electoral divisions which returned one councillor each by first-past-the-post voting for a four-year term of office.

<span class="mw-page-title-main">2019 United Kingdom local elections</span> Elections to local councils and mayoralties

The 2019 United Kingdom local elections took place on Thursday 2 May 2019, with 248 English local councils, six directly elected mayors in England, and all 11 local councils in Northern Ireland being contested.

<span class="mw-page-title-main">Reclaim Party</span> Political party in the United Kingdom

The Reclaim Party is a right-wing populist political party in the United Kingdom. It was launched in 2020 by British actor and political activist Laurence Fox, with funding from Jeremy Hosking.

<span class="mw-page-title-main">2021 Shropshire Council election</span>

The 2021 Shropshire Council election took place on 6 May 2021 as part of the 2021 United Kingdom local elections. All 74 councillors were elected from 63 electoral divisions which return either one, two or three councillors each by first-past-the-post voting for a four-year term of office.

<span class="mw-page-title-main">2022 Wrexham County Borough Council election</span> Election to Wrexham County Borough Council

The 2022 Wrexham County Borough Council election took place on 5 May 2022 to elect 56 members to Wrexham County Borough Council, the principal council of Wrexham County Borough, Wales. On the same day, elections were held to the other 21 local authorities, and community councils in Wales as part of the 2022 Welsh local elections. The previous Wrexham County Borough all-council election took place in May 2017 and future elections will take place every five years, with the next scheduled for 2027.

References

  1. "Upcoming elections & referendums". Electoral Commission. Archived from the original on 5 May 2018. Retrieved 15 September 2016.
  2. "Unitary results - May 4 2017". Shropshire Council. Retrieved 6 May 2017.