![]() | |||||||||||||||||||||||||||||||||||||||||||||||
| |||||||||||||||||||||||||||||||||||||||||||||||
All 55 seats to Doncaster Metropolitan Borough Council 28 seats needed for a majority | |||||||||||||||||||||||||||||||||||||||||||||||
---|---|---|---|---|---|---|---|---|---|---|---|---|---|---|---|---|---|---|---|---|---|---|---|---|---|---|---|---|---|---|---|---|---|---|---|---|---|---|---|---|---|---|---|---|---|---|---|
| |||||||||||||||||||||||||||||||||||||||||||||||
![]() Map showing the results of the 2017 Doncaster Council elections. | |||||||||||||||||||||||||||||||||||||||||||||||
|
The 2017 Doncaster Metropolitan Borough Council election took place on 4 May 2017 as part of the 2017 local elections in the United Kingdom. The election of the Mayor of Doncaster also took place on the same day. [1] All 55 councillors were elected from 21 wards which returned either two or three councillors each by first-past-the-post voting for a four-year term of office. [2]
The election resulted in the Labour Party retaining control of the Council, with an increased majority after gaining two seats from UKIP. [3]
Party | Seats | Gains | Losses | Net gain/loss | Seats % | Votes % | Votes | +/− | |
---|---|---|---|---|---|---|---|---|---|
Labour | 43 | 2 | 0 | ![]() | 37.5 | 28,873 | |||
Conservative | 7 | 0 | 1 | ![]() | 24.7 | 18,993 | |||
Mexborough First | 3 | 0 | 0 | 0 | 3.0 | 2,320 | |||
Independent | 2 | 1 | 0 | ![]() | 7.8 | 6,039 | |||
UKIP | 0 | 0 | 2 | ![]() | 14.3 | 11,008 | |||
Yorkshire | 0 | 0 | 0 | 0 | 5.3 | 4,102 | |||
Green | 0 | 0 | 0 | 0 | 3.9 | 2,988 | |||
Community Group | 0 | 0 | 0 | 0 | 1.5 | 1,147 | |||
TUSC | 0 | 0 | 0 | 0 | 1.1 | 848 | |||
Liberal Democrats | 0 | 0 | 0 | 0 | 1.0 | 736 | |||
Following the last election in 2015, the composition of the council was:
41 | 8 | 3 | 2 | 1 |
Labour | Conservative | MF | U | I |
After the election, the composition of the council was:
43 | 7 | 3 | 2 |
Labour | Conservative | MF | I |
MF - Mexborough First
I - Independent
U - UKIP
Doncaster Mayoral Election 2017 [4] | ||||||||
---|---|---|---|---|---|---|---|---|
Party | Candidate | 1st round | 2nd round | 1st round votesTransfer votes, 2nd round | ||||
Total | Of round | Transfers | Total | Of round | ||||
Labour | Ros Jones | 32,631 | 50.9% | | ||||
Conservative | George Jabbour | 13,575 | 21.2% | | ||||
UKIP | Brian Whitmore | 7,764 | 12.1% | | ||||
Independent | Eddie Todd | 5,344 | 8.3% | | ||||
Yorkshire | Chris Whitwood | 3,235 | 5.0% | | ||||
TUSC | Steve Williams | 1,531 | 2.4% | | ||||
Majority | ||||||||
Turnout | 64,080 | |||||||
Labour hold |
Party | Candidate | Votes | % | ±% | |
---|---|---|---|---|---|
Labour | David Hughes | 1,574 | 54.4 | +9.7 | |
Labour | John Mounsey | 1,553 | 53.6 | +6.1 | |
Labour | Rachel Hodson | 1,361 | 47.0 | +11.6 | |
Yorkshire | Charles Bridges | 678 | 23.4 | New | |
UKIP | Frank Calladine | 655 | 22.6 | -6.4 | |
Conservative | Terry Taylor | 472 | 16.3 | +4.6 | |
Turnout | 25.2% |
Party | Candidate | Votes | % | ±% | |
---|---|---|---|---|---|
Labour | Tony Corden | 1,479 | 51.4 | +4.6 | |
Labour | Chris McGuinness | 1,336 | 46.4 | +3.3 | |
Labour | Sue McGuinness | 1,314 | 45.6 | +4.4 | |
UKIP | Nigel Berry | 1,045 | 36.3 | -1.9 | |
Conservative | Margaret Beard | 787 | 27.3 | +6.2 | |
UKIP | Kevin Michael Abell | 767 | 26.6 | New | |
Green | Mark Gray | 328 | 11.4 | +1.2 | |
Turnout | 26.6% |
Party | Candidate | Votes | % | ±% | |
---|---|---|---|---|---|
Labour | Nuala Mary Fennelly | 1,007 | 48.8 | +12.1 | |
Labour | John Patrick Joseph Healy | 792 | 38.4 | -9.8 | |
Conservative | John Thomas Papworth | 678 | 32.8 | +9.4 | |
UKIP | James Anthony Cotterill | 530 | 25.7 | -10.1 | |
Green | Ash Ingram | 208 | 10.1 | +2.9 | |
Turnout | 28.1% |
Party | Candidate | Votes | % | ±% | |
---|---|---|---|---|---|
Labour | Charlie Hogarth | 1,665 | 50.8 | +6.5 | |
Labour | Bill Mordue | 1,618 | 49.4 | +2.4 | |
Labour | Jane Nightingale | 1,511 | 46.1 | +2.9 | |
UKIP | Louise Margaret Emery | 832 | 25.4 | -6.6 | |
Conservative | Brian Woodhouse | 803 | 24.5 | +6.3 | |
Green | Amy Louise Baker | 398 | 12.1 | +1.2 | |
Green | Tony Nicholson | 300 | 9.2 | New | |
Green | Dawn Longley | 267 | 8.2 | New | |
TUSC | Jordan James Lucas | 169 | 5.2 | New | |
TUSC | Steven Flint | 167 | 5.1 | -1.9 | |
Turnout | 7,730 | 26.0% |
Party | Candidate | Votes | % | ±% | |
---|---|---|---|---|---|
Conservative | Nick Allen | 1,448 | 36.9 | +10.8 | |
Labour | Neil Gethin | 1,217 | 31.0 | +2.6 | |
Labour | Majid Khan | 1,172 | 29.8 | +3.1 | |
Labour | Diane Jones | 1,161 | 29.6 | +4.6 | |
Conservative | Carol Greenhalgh | 1,097 | 27.9 | New | |
Independent | Monty Cuthbert | 1,044 | 26.6 | +7.7 | |
Conservative | Leon Sean French | 1,040 | 26.5 | +6.1 | |
Independent | Paul Coddington | 838 | 21.3 | -3.5 | |
UKIP | Paul Alexander Carr Pickering | 542 | 13.8 | -7.8 | |
Liberal Democrats | Roger Leonard Long | 386 | 9.8 | -3.4 | |
Liberal Democrats | Matthew Thomas Hague | 295 | 7.5 | -4.9 | |
Green | James Michael Chatterley | 212 | 5.4 | -3.4 | |
Green | Veronica Jane Maxwell | 156 | 4.0 | New | |
Turnout | 10,608 | 34.4% |
Party | Candidate | Votes | % | ±% | |
---|---|---|---|---|---|
Labour | Nigel Ball | 1,685 | 55.5 | +0.3 | |
Labour | Ian Pearson | 1,545 | 50.9 | +5.7 | |
Labour | Lani-Mae Ball | 1,523 | 50.2 | +12.7 | |
UKIP | William Brooke Shaw | 750 | 24.7 | +2.3 | |
Yorkshire | Stevie Manion | 716 | 23.6 | New | |
Conservative | Rachel French | 676 | 22.3 | +10.4 | |
Turnout | 6,895 | 25.3% |
Party | Candidate | Votes | % | ±% | |
---|---|---|---|---|---|
Labour | David Andrew Nevett | 1,156 | 43.6 | +3.3 | |
Labour | Andrea Robinson | 1,039 | 39.2 | +2.6 | |
UKIP | Paul Bissett | 713 | 26.9 | -7.2 | |
Conservative | Cliff Hampson | 698 | 26.3 | +6.2 | |
Conservative | Karen Hampson | 660 | 24.9 | +13.3 | |
UKIP | Harry Palmer | 544 | 20.5 | -8.6 | |
Turnout | 4,810 | 33.7% |
Party | Candidate | Votes | % | ±% | |
---|---|---|---|---|---|
Labour | Tina Reid | 1,292 | 56.2 | +8.3 | |
Labour | Phil Cole | 1,168 | 50.8 | -1.0 | |
Conservative | Liz Jones | 679 | 29.5 | +13.1 | |
UKIP | Robert Noel Middleton | 534 | 23.2 | -5.5 | |
Turnout | 3,673 | 27.4% |
Party | Candidate | Votes | % | ±% | |
---|---|---|---|---|---|
Conservative | Jane Margaret Cox | 2,579 | 61.3 | +25.6 | |
Conservative | Stephen Leslie Cox | 2,385 | 56.7 | +24.0 | |
Conservative | Allan Jones | 2,351 | 55.9 | +22.5 | |
Labour | Tony Bryan | 1,185 | 28.2 | +0.6 | |
Labour | Sandra Mary Holland | 1,173 | 27.9 | +0.9 | |
Labour | Phil Docherty | 1,042 | 24.8 | +4.2 | |
TUSC | Owen Harris-Evans | 315 | 7.5 | +4.3 | |
Turnout | 11,030 | 33.0% |
Party | Candidate | Votes | % | ±% | |
---|---|---|---|---|---|
Labour | Linda Mary Curran | 1,297 | 37.7 | -3.2 | |
Labour | Duncan Charles Anderson | 1,195 | 34.7 | -1.5 | |
Labour | Derek William Smith | 1,097 | 31.9 | +2.8 | |
UKIP | Mick Glynn | 1,053 | 30.6 | -5.4 | |
Conservative | James Vincent Hart | 878 | 25.5 | +4.1 | |
Independent | Jessie Jamieson Credland | 864 | 25.1 | -11.0 | |
UKIP | Keith Jacques | 688 | 20.0 | -16.1 | |
Independent | Bill Morrison | 631 | 18.3 | New | |
UKIP | Deborah Cotterill | 518 | 15.0 | -11.5 | |
Independent | Anne Frances Rutherford | 392 | 11.4 | -15.1 | |
Turnout | 8,613 | 29.9% |
Party | Candidate | Votes | % | ±% | |
---|---|---|---|---|---|
Labour | Glyn Allen Jones | 1,141 | 59.5 | +5.9 | |
Labour | Sue Wilkinson | 873 | 45.5 | -0.3 | |
UKIP | John David Cotterill | 532 | 27.7 | -11.3 | |
Conservative | Ann Nadin Martin | 433 | 22.6 | New | |
Turnout | 2,979 | 24.9% |
Party | Candidate | Votes | % | ±% | |
---|---|---|---|---|---|
Mexborough First | Andy Pickering | 2,320 | 72.0 | +24.6 | |
Mexborough First | Sean Michael Gibbons | 2,252 | 69.9 | +22.6 | |
Mexborough First | Bev Chapman | 2,083 | 64.7 | +26.6 | |
Labour | Sue Phillips | 722 | 22.4 | -6.4 | |
Labour | Tracey Joan Leyland-Jepson | 682 | 21.2 | -5.4 | |
Labour | Rob Reid | 397 | 12.3 | -9.2 | |
Conservative | Barbara Fletcher | 163 | 5.1 | New | |
Turnout | 8,619 | 27.6% |
Party | Candidate | Votes | % | ±% | |
---|---|---|---|---|---|
Labour | Iris Beech | 1,651 | 46.6 | +7.3 | |
Labour | Austen William White | 1,586 | 44.8 | +7.4 | |
Labour | John Anthony Gilliver | 1,470 | 41.5 | +0.7 | |
Conservative | Carolyn Taylor | 1,088 | 30.7 | +2.3 | |
Yorkshire | Jacob Barker | 785 | 22.2 | New | |
Independent | Frank Jackson | 763 | 21.5 | New | |
UKIP | Charles Roger Morris | 742 | 20.9 | -12.3 | |
Turnout | 8,085 | 31.8% |
Party | Candidate | Votes | % | ±% | |
---|---|---|---|---|---|
Labour | Pat Haith | 1,376 | 53.9 | +13.7 | |
Labour | Kevin Terence Rodgers | 1,205 | 47.2 | +7.0 | |
Conservative | Doreen Woodhouse | 814 | 31.9 | +13.8 | |
Green | Christine Florence Platt | 387 | 15.2 | +9.4 | |
Green | Stephen Platt | 382 | 15.0 | +5.1 | |
Turnout | 4,164 | 30.2% |
Party | Candidate | Votes | % | ±% | |
---|---|---|---|---|---|
Labour | Rachael Blake | 1,823 | 48.7 | +12.7 | |
Independent | John Nolan Cooke | 1,645 | 43.9 | +13.6 | |
Labour | Mick Cooper | 1,497 | 40.0 | +16.4 | |
Labour | Kevin Robert Fennelly | 1,368 | 36.5 | +14.7 | |
Conservative | Ross Lawrence David Atkinson | 1,039 | 27.8 | +4.5 | |
UKIP | Clive Graham Stone | 937 | 25.0 | -0.6 | |
TUSC | Luke Michael Jones | 159 | 4.2 | New | |
Turnout | 8,468 | 28.6% |
Party | Candidate | Votes | % | ±% | |
---|---|---|---|---|---|
Conservative | Cynthia Anne Ransome | 1,704 | 53.7 | +15.3 | |
Conservative | Jonathan Blundell Wood | 1,376 | 43.4 | +7.4 | |
Labour | David Holland | 1,141 | 36.0 | +4.6 | |
Labour | Craig Bernard Sahman | 772 | 24.3 | -2.9 | |
Green | Fiona Dorothy Patricia Cahill | 510 | 16.1 | +4.4 | |
Turnout | 5,503 | 35.7% |
Party | Candidate | Votes | % | ±% | |
---|---|---|---|---|---|
Labour | Ken Keegan | 1,004 | 50.4 | +6.8 | |
Labour | George Derx | 728 | 36.5 | +4.2 | |
Conservative | Christine Yvonne Allen | 710 | 35.6 | +15.1 | |
UKIP | John Waggitt | 673 | 33.8 | +7.4 | |
Turnout | 3,115 | 27.8% |
Party | Candidate | Votes | % | ±% | |
---|---|---|---|---|---|
Labour | Susan Jane Durant | 2,019 | 52.9 | +16.6 | |
Labour | Mark Stuart Houlbrook | 1,890 | 49.5 | +15.6 | |
Labour | Joe Blackham | 1,797 | 47.1 | +12.6 | |
Community Group | Martin Williams | 1,147 | 30.1 | +0.5 | |
Community Group | Tony Brookes | 982 | 25.7 | +8.7 | |
Community Group | Lee Dudgeon | 735 | 19.3 | +6.0 | |
UKIP | Kim Parkinson | 583 | 15.3 | -11.5 | |
Conservative | Keith Oades | 469 | 12.3 | -2.3 | |
Independent | Karen Lesley Mundin | 374 | 9.8 | New | |
TUSC | Mary Jackson | 205 | 5.4 | +2.0 | |
Turnout | 10,201 | 29.8% |
Party | Candidate | Votes | % | ±% | |
---|---|---|---|---|---|
Independent | Nigel John Cannings | 1,349 | 44.6 | +19.2 | |
Conservative | Martin Damian Greenhalgh | 954 | 31.5 | +1.6 | |
Conservative | Alan Smith | 821 | 27.1 | -3.5 | |
Labour | Sue Farmer | 722 | 23.9 | -3.2 | |
Labour | Bob Johnson | 641 | 21.2 | -3.8 | |
Liberal Democrats | Ian Michael Smith | 350 | 11.6 | New | |
Green | Kay Goddard | 308 | 10.2 | New | |
Turnout | 5,145 | 35.6% |
Party | Candidate | Votes | % | ±% | |
---|---|---|---|---|---|
Labour | John McHale | 1,818 | 49.8 | +6.6 | |
Labour | Nikki McDonald | 1,667 | 45.6 | +2.8 | |
Labour | Dave Shaw | 1,603 | 43.9 | +1.8 | |
Yorkshire | Chris Whitwood | 1,195 | 32.7 | New | |
Conservative | Guy Aston | 1,003 | 27.4 | +6.2 | |
Green | Laura Jane Vieira | 637 | 17.4 | +1.6 | |
Majority | 408 | 11.2 | |||
Turnout | 29.7 | -22.1 | |||
Labour hold | Swing | ||||
Party | Candidate | Votes | % | ±% | |
---|---|---|---|---|---|
Labour | Eva Theresa Hughes | 1,899 | 54.6 | +11.5 | |
Labour | Jane Kidd | 1,767 | 50.8 | +9.1 | |
Labour | Paul Wray | 1,531 | 44.0 | +4.4 | |
Conservative | Neil Saran Srivastava | 918 | 26.4 | +9.9 | |
UKIP | Roy John Penketh | 887 | 25.5 | -4.1 | |
Yorkshire | Gareth Shanks | 728 | 20.9 | New | |
Turnout | 7,730 | 27.2% |
The English Democrats are a right-wing to far-right, English nationalist political party active in England. Being a minor party, it currently has no elected representatives at any level of UK government.
Doncaster Metropolitan Borough Council is the local authority for Doncaster in South Yorkshire, England. The council is elected every four years. Since 2002 the council has been led by a directly elected mayor.
City of Doncaster Council is the local authority of the City of Doncaster, a metropolitan borough with city status in South Yorkshire, England. Prior to being awarded city status in 2022 the council was called Doncaster Metropolitan Borough Council. The council is based at the Civic Office in Waterdale, central Doncaster. It is one of four local authorities in South Yorkshire and provides the majority of local government services in Doncaster. The council is a member of the South Yorkshire Mayoral Combined Authority.
The 2012 Doncaster Metropolitan Borough Council election took place on 3 May 2012 to elect one third of Doncaster Metropolitan Borough Council in South Yorkshire, England. This was on the same day as other 2012 United Kingdom local elections.
The 2013 United Kingdom local elections took place on Thursday 2 May 2013. Elections were held in 35 English councils: all 27 non-metropolitan county councils and eight unitary authorities, and in one Welsh unitary authority. Direct mayoral elections took place in Doncaster and North Tyneside. These elections last took place on the 4 June 2009 at the same time as the 2009 European Parliament Elections, except for County Durham, Northumberland and the Anglesey where elections last took place in 2008.
The 2014 Sunderland City Council Election took place on 22 May 2014 to elect members of Sunderland Metropolitan Borough Council in Tyne and Wear, England, as part of the wider 2014 United Kingdom local elections. A third of the council were up for election, the Labour Party stayed in overall control of the council.
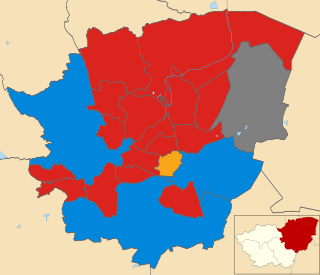
The 2014 Doncaster Metropolitan Borough Council election took place on 22 May 2014 as part of the 2014 local elections in the United Kingdom. One third of 63 seats were up for election. The 2014 European Parliament Elections were also held on the same day.
The by-thirds 2015 Rotherham Metropolitan Borough Council election took place on Thursday 7 May 2015, to elect approximately one third of the members of the Rotherham Metropolitan Borough Council in England as part of the 2015 United Kingdom local elections held on the same day as the general election. All seats contested at this election were last contested in 2011, and of these, 20 were held by Labour Party councillors.
The 2015 Bolton Metropolitan Borough Council election was held on 7 May 2015 to elect members of Bolton Metropolitan Borough Council in Greater Manchester, England. This took place on the same day as other local elections
The 2015 Bracknell Forest Borough Council election took place on 7 May 2015 to elect all 42 councillors in 18 wards for Bracknell Forest Borough Council in England. The election took place alongside both the 2015 United Kingdom general election and other local elections in England. With the concurrent general election, turnout was significantly up on the last local election. The Conservative Party was returned to a sixth term in office, continuing its hold on the council since its inception as a unitary authority in 1998. The Labour Party was reduced to the single seat of its group leader in Great Hollands North - its worst result since 1987.
A by-thirds Hyndburn Borough Council local election took place on 7 May 2015. Approximately one third of the second tier council's 35 seats fell up for election, and the General Election was held on the same day.
A by-thirds Hyndburn Borough Council local election took place on 5 May 2016. Approximately one third of the local council's 35 seats fell up for election on that day. The following year sees Lancashire County Council elections for all residents of this borough.
The 2016 Bolton Metropolitan Borough Council election took place on 5 May 2016 to elect members of Bolton Metropolitan Borough Council in Greater Manchester, England. This was on the same day as other local elections.
The 2016 Calderdale Metropolitan Borough Council election took place on 5 May 2016 to elect members of Calderdale Metropolitan Borough Council in England. This was on the same day as other local elections. One councillor was elected in each ward for a four-year term so the councillors elected in 2016 last stood for election in 2012. Each ward is represented by three councillors, the election of which is staggered, so only one third of the councillors was elected in this election. Before the election there was no overall control with a minority Labour administration. After the election there was still no overall control so the minority Labour administration continued.
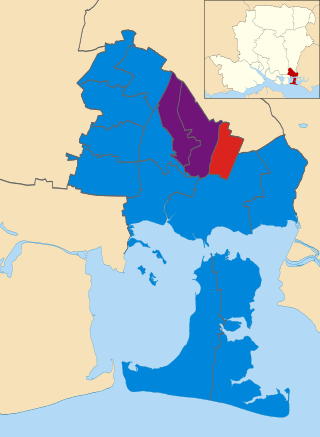
The 2016 Havant Borough Council election took place on 5 May 2016 to elect members of Havant Borough Council in England. This was on the same day as other local elections.
The 2017 United Kingdom local elections were held on Thursday 4 May 2017. Local elections were held across Great Britain, with elections to 35 English local authorities and all councils in Scotland and Wales.
The 2018 Calderdale Metropolitan Borough Council election took place on 3 May 2018 to elect members of Calderdale Metropolitan Borough Council in England. This was on the same day as other local elections. One councillor was elected in each ward for a four-year term so the councillors elected in 2018 last stood for election in 2014. Each ward is represented by three councillors, the election of which is staggered, so only one third of the councillors were elected in this election. Before the election there was no overall control with a minority Labour administration. Following the election Labour, having gained one councillor, was still two councillors away from a majority so it remained no overall control.
The 2018 Wirral Metropolitan Borough Council election took place on 3 May 2018 to elect members of Wirral Metropolitan Borough Council in England. This election was held on the same day as other local elections.
This page includes the election results of the Yorkshire Party, a regional political party based in Yorkshire.
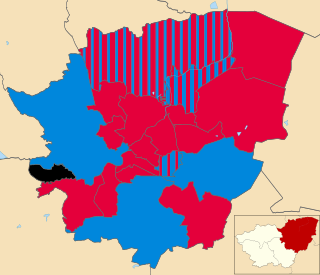
The 2021 Doncaster Metropolitan Borough Council election took place on 6 May 2021 as part of the 2021 local elections in the United Kingdom. All 55 councillors were elected from 21 wards which return either two or three councillors each by first-past-the-post voting for a four-year term of office.