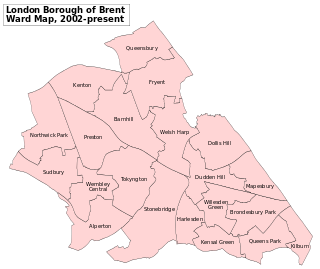
Brent London Borough Council in London, England is elected every four years. Since the last boundary changes in 2022 the council has comprised 57 councillors representing 22 wards, with each ward electing two or three councillors.

The City of Bradford Metropolitan District Council election took place on Thursday 5 May 2011.

The City of Bradford Metropolitan District Council elections took place on Thursday 6 May. The 2010 general election was held simultaneously, which greatly increased the turnout.
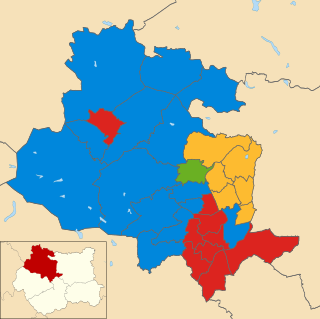
The City of Bradford Metropolitan District Council election took place on Thursday 1 May 2008.

Elections for the London Borough of Merton were held on 22 May 2014 to elect members of Merton London Borough Council in England. This was on the same day as other local elections in England and an election to the European Parliament.

The 2010 Brent London Borough Council election took place on 6 May 2010 to elect members of Brent London Borough Council in London, England. The whole council was up for election and the Labour Party gained overall control of the council from no overall control.
The by-thirds 2015 Rotherham Metropolitan Borough Council election took place on Thursday 7 May 2015, to elect approximately one third of the members of the Rotherham Metropolitan Borough Council in England as part of the 2015 United Kingdom local elections held on the same day as the general election. All seats contested at this election were last contested in 2011, and of these, 20 were held by Labour Party councillors.

The Clackmannanshire Council election of 2017 was held on 4 May 2017, on the same day as the 31 other local authorities in Scotland. It was the third successive election to run under the STV electoral system and used the five wards created under the Local Governance (Scotland) Act 2004, with 18 councillors being elected.

The 2017 Aberdeen City Council election took place on 4 May 2017 to elect members of Aberdeen City Council. The election used the 13 wards created as a result of the Local Governance (Scotland) Act 2004, with each ward electing three or four Councillors using the single transferable vote system form of proportional representation, with a total of 45 Councillors elected, an increase in two members from 2012.
Elections were held to Swale Borough Council in England as part of the United Kingdom local elections on 2 May 2019.

Elections to Hampshire County Council took on 6 May 2021 as part of the 2021 United Kingdom local elections. All 78 seats were up for election, with each ward returning either one or two councillors by first-past-the-post voting for a four-year term of office. This took place at the same time as the elections for the Hampshire Police and Crime Commissioner and district councils.

The 2021 Oxfordshire County Council election took place on 6 May 2021 alongside the other local elections. All 63 seats of the Oxfordshire County Council were contested. The council is composed of 61 divisions, each electing either one or two councillors, all elected by FPTP.

Elections to Isle of Wight Council took place on 6 May 2021 as part of the 2021 United Kingdom local elections. These were held at the same time as the elections for the Hampshire Police and Crime Commissioner. The elections saw the Conservatives lose control of the council, losing seats against the national trend for the party.

The 2022 Bromley London Borough Council election took place on 5 May 2022. All 58 members of Bromley London Borough Council were elected. The elections took place alongside local elections in the other London boroughs and elections to local authorities across the United Kingdom.

The 2022 Islington London Borough Council election took place on 5 May 2022. All 51 members of Islington London Borough Council were to be elected. The elections took place alongside local elections in the other London boroughs and elections to local authorities across the United Kingdom.

Elections to South Lanarkshire Council took place on 5 May 2022 on the same day as the 31 other Scottish local government elections. As with other Scottish council elections, it was held using single transferable vote (STV) – a form of proportional representation – in which multiple candidates are elected in each ward and voters rank candidates in order of preference.

Elections to Dumfries and Galloway Council took place on 5 May 2022 on the same day as the 31 other Scottish local government elections. As with other Scottish council elections, it was held using single transferable vote (STV) – a form of proportional representation – in which multiple candidates are elected in each ward and voters rank candidates in order of preference.

The 2023 Plymouth City Council election was held on 4 May 2023 to elect members of Plymouth City Council in England. It coincided with local elections across the United Kingdom.
The 2023 Dartford Borough Council election took place on 4 May 2023 to elect all 42 members of Dartford Borough Council in Kent, England.

The 2024 Dudley Metropolitan Borough Council election took place on Thursday 2 May 2024 to elect all 72 seats to Dudley Council, alongside the other local elections across the United Kingdom being held on the same day.
