| |||||||||||||||||||||||||||||||||||||||||||||||||||||||||||||
18 seats, one-third of all council seats. | |||||||||||||||||||||||||||||||||||||||||||||||||||||||||||||
---|---|---|---|---|---|---|---|---|---|---|---|---|---|---|---|---|---|---|---|---|---|---|---|---|---|---|---|---|---|---|---|---|---|---|---|---|---|---|---|---|---|---|---|---|---|---|---|---|---|---|---|---|---|---|---|---|---|---|---|---|---|
| |||||||||||||||||||||||||||||||||||||||||||||||||||||||||||||
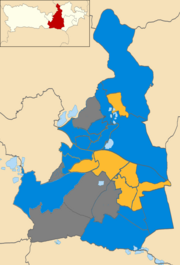
Ward results map for Wokingham Borough Council | |||||||||||||||||||||||||||||||||||||||||||||||||||||||||||||
|
The 2021 Wokingham Borough Council election took place on 6 May 2021 to elect members of Wokingham Borough Council in England. [2] This was on the same day as other local elections and had been postponed from May 2020, due to the COVID-19 pandemic.
The composition of the council before the election was as follows:
31 | 15 | 4 | 3 |
CON | LD | LAB | IND |
There was one vacancy. [3]
After the election, the composition of the council became:
31 | 18 | 3 | 2 |
CON | LD | LAB | IND |
The Conservatives retained control of the council and gained one seat from Labour. [4] They regained a seat from an Independent who had originally been elected as a Conservative, and also regained a vacant seat, which had been won by a Conservative in 2016, who joined the Liberal Democrats in 2017, [5] and had resigned from the Council in 2020. [3] The Liberal Democrats gained three seats from the Conservatives.
2021 Wokingham Borough Council election | ||||||||||
---|---|---|---|---|---|---|---|---|---|---|
Party | This election | Full council | This election | |||||||
Seats | Net | Seats % | Other | Total | Total % | Votes | Votes % | +/− | ||
Conservative | 12 | 2 | 66.7 | 19 | 31 | 57.4 | 21,540 | 46.4 | 9.1 | |
Liberal Democrats | 6 | 3 | 33.3 | 12 | 18 | 33.3 | 16,492 | 35.5 | 3.9 | |
Labour | 0 | 1 | 0 | 3 | 3 | 5.6 | 7,439 | 16.0 | 0.4 | |
Independent | 0 | 0 | 2 | 2 | 3.7 | 0 | 0 | 5.4 | ||
Green | 0 | 0.0 | 0 | 0 | 0.0 | 695 | 1.5 | 0.9 | ||
Women's Equality | 0 | 0.0 | 0 | 0 | 0.0 | 175 | 0.4 | 0.1 | ||
Freedom Alliance | 0 | 0.0 | 0 | 0 | 0.0 | 114 | 0.2 | New | ||
A total of 46,771 votes were cast for 62 candidates. (46,445 unspoilt)
Party | Candidate | Votes | % | ±% | |
---|---|---|---|---|---|
Conservative | Shahid Younis (E) | 1,489 | 43.5 | 5.6 | |
Labour | Andy Croy | 1443 | 42.2 | -0.2 | |
Liberal Democrats | Shiela Jordan | 256 | 7.4 | -12.3 | |
Green | Samuel Langlois | 186 | 5.4 | 5.4 | |
Freedom Alliance | Fiona Morley | 23 | 0.6 | 0.6 | |
Majority | 46 | 1.3 | -3.2 | ||
Turnout | 3419 | 48% | 6% | ||
Conservative gain from Labour | Swing | ||||
22 ballot papers were rejected
Party | Candidate | Votes | % | ±% | |
---|---|---|---|---|---|
Conservative | Sam Akhtar (E) | 728 | 58.7 | 11.7 | |
Liberal Democrats | Martin Alder | 367 | 29.5 | 29.5 | |
Labour | Brian Scott | 81 | 6.5 | -0.4 | |
Green | Kathy Smith | 55 | 4.4 | 4.4 | |
Majority | 361 | 29.1 | 28.0 | ||
Turnout | 1240 | 52% | 7% | ||
Conservative hold | Swing | ||||
9 ballot papers were rejected
Party | Candidate | Votes | % | ±% | |
---|---|---|---|---|---|
Liberal Democrats | Morag Malvern | 1,675 | 48.2 | -13.4 | |
Conservative | Ullakarin Clark | 1,454 | 41.8 | 10.7 | |
Labour | Llewelyn Reed-Jones | 320 | 9.2 | -1.6 | |
Majority | 221 | 6.4 | -24.1 | ||
Turnout | 3475 | 47% | 3% | ||
Liberal Democrats gain from Conservative | Swing | ||||
26 ballot papers were rejected
Party | Candidate | Votes | % | ±% | |
---|---|---|---|---|---|
Liberal Democrats | Ian Shenton (E) | 1,390 | 44.0 | -4.5 | |
Conservative | Daniel Hinton | 1277 | 40.4 | 15.6 | |
Labour | Annette Medhurst | 299 | 9.5 | 3.8 | |
Women's Equality | Louise Timlin | 175 | 5.5 | -0.5 | |
Majority | 113 | 3.6 | -20.1 | ||
Turnout | 3158 | 44% | 7% | ||
Liberal Democrats gain from Conservative | Swing | ||||
17 ballot papers were rejected
Party | Candidate | Votes | % | ±% | |
---|---|---|---|---|---|
Conservative | Charles Margetts | 1,341 | 69.0 | 11.9 | |
Liberal Democrats | Jordon Montgomery | 283 | 14.7 | -17.4 | |
Labour | Alex Freeney | 170 | 8.7 | 3.6 | |
Green | Martyn Foss | 130 | 6.7 | 1.6 | |
Majority | 1058 | 54.5 | 29.5 | ||
Turnout | 1941 | 45% | 1% | ||
Conservative hold | Swing | ||||
17 ballot papers were rejected
Party | Candidate | Votes | % | ±% | |
---|---|---|---|---|---|
Conservative | Rebecca Margetts | 1,188 | 65.0 | 9.5 | |
Liberal Democrats | Mike Eytle | 454 | 24.8 | -8.2 | |
Labour | Grace Tapping | 172 | 9.2 | -1.8 | |
Majority | 734 | 40.1 | 17.6 | ||
Turnout | 1827 | 39% | -1% | ||
Conservative hold | Swing | ||||
13 ballot papers were rejected
Party | Candidate | Votes | % | ±% | |
---|---|---|---|---|---|
Liberal Democrats | Clive Jones | 1,411 | 53.6 | -2.8 | |
Conservative | Eileen Kessel | 869 | 33.0 | 1.2 | |
Labour | Mark Craske | 339 | 12.8 | 1.0 | |
Majority | 542 | 20.5 | -4.1 | ||
Turnout | 2632 | 38% | 2% | ||
Liberal Democrats hold | Swing | ||||
13 ballot papers were rejected
Party | Candidate | Votes | % | ±% | |
---|---|---|---|---|---|
Conservative | Pauline Jorgensen | 1,472 | 46.8 | 9.2 | |
Liberal Democrats | Wes Budd | 1354 | 43.0 | -8.2 | |
Labour | Hari Sarasan | 303 | 9.6 | -1.5 | |
Majority | 118 | 3.6 | -10.0 | ||
Turnout | 3144 | 49% | 5% | ||
Conservative hold | Swing | ||||
15 ballot papers were rejected
Party | Candidate | Votes | % | ±% | |
---|---|---|---|---|---|
Conservative | Wayne Smith | 749 | 70.4 | -5.8 | |
Liberal Democrats | Sam Turvey | 211 | 19.8 | 6.7 | |
Labour | Paula Monte | 100 | 9.4 | -1.3 | |
Majority | 538 | 50.6 | -12.5 | ||
Turnout | 1063 | 50% | 14% | ||
Conservative hold | Swing | ||||
3 ballot papers were rejected.
Party | Candidate | Votes | % | ±% | |
---|---|---|---|---|---|
Conservative | Anne Chadwick | 1,377 | 46.1 | 1.8 | |
Liberal Democrats | Beth Rowland | 741 | 24.8 | -9.6 | |
Labour | Majid Nagra | 689 | 23.0 | 5.2 | |
Green | James Towell | 163 | 5.4 | 5.4 | |
Majority | 636 | 21.2 | 7.7 | ||
Turnout | 2986 | 39% | 6% | ||
Conservative hold | Swing | ||||
16 ballot papers were rejected
Party | Candidate | Votes | % | ±% | |
---|---|---|---|---|---|
Conservative | Norman Jorgensen | 1,235 | 40.7 | 6.8 | |
Liberal Democrats | Mike Smith | 931 | 30.7 | -6.3 | |
Labour | Andrew Gray | 676 | 22.2 | -6.9 | |
Green | Russell Seymour | 161 | 5.3 | 5.3 | |
Majority | 304 | 10.0 | 6.9 | ||
Turnout | 3032 | 45% | -1% | ||
Conservative hold | Swing | ||||
29 ballot papers were rejected
Party | Candidate | Votes | % | ±% | |
---|---|---|---|---|---|
Conservative | Phil Cunnington | 1,610 | 46.1 | 5.6 | |
Labour | Nick Fox | 1375 | 39.4 | 0.2 | |
Liberal Democrats | Jane Ainslie | 481 | 13.7 | -6.6 | |
Majority | 235 | 6.7 | 5.4 | ||
Turnout | 3489 | 42% | 5% | ||
Conservative hold | Swing | ||||
23 ballot papers were rejected
Party | Candidate | Votes | % | ±% | |
---|---|---|---|---|---|
Conservative | John Halsall | 1,137 | 62.7 | -4.8 | |
Liberal Democrats | Andrea Martijn | 425 | 23.4 | 1.7 | |
Labour | Stuart Crainer | 239 | 13.1 | -2.9 | |
Majority | 712 | 39.2 | -6.6 | ||
Turnout | 1813 | 42% | 11% | ||
Conservative hold | Swing | ||||
12 ballot papers were rejected.
Party | Candidate | Votes | % | ±% | |
---|---|---|---|---|---|
Conservative | Jackie Rance | 1,423 | 48.1 | 17.3 | |
Liberal Democrats | Chris Johnson | 1152 | 39.0 | 39.0 | |
Labour | Marcus McDowell | 359 | 12.1 | 2.2 | |
Majority | 271 | 9.17 | -9.5 | ||
Turnout | 2953 | 35% | 1% | ||
Conservative hold | Swing | ||||
19 ballot papers were rejected
Party | Candidate | Votes | % | ±% | |
---|---|---|---|---|---|
Liberal Democrats | Lindsay Ferris | 1,677 | 70.6 | -2.4 | |
Conservative | Grant Woolner | 562 | 23.6 | 0.9 | |
Labour | Caroline Hill | 118 | 4.9 | 0.6 | |
Majority | 1115 | 46.9 | -3.4 | ||
Turnout | 2374 | 54% | 6% | ||
Liberal Democrats hold | Swing | ||||
17 ballot papers were rejected
Party | Candidate | Votes | % | ±% | |
---|---|---|---|---|---|
Liberal Democrats | Peter Dennis | 1,052 | 44.2 | 9.1 | |
Conservative | Jullian McGhee-Sumner | 1011 | 42.4 | 8.8 | |
Labour | Colin Heath | 288 | 12.1 | -11.3 | |
Majority | 41 | 1.7 | 0.2 | ||
Turnout | 2379 | 43% | 1% | ||
Liberal Democrats gain from Conservative | Swing | ||||
28 ballot papers were rejected
Party | Candidate | Votes | % | ±% | |
---|---|---|---|---|---|
Liberal Democrats | Rachelle Shepherd-Dubey | 1,627 | 54.1 | -10.6 | |
Conservative | Bernadette Mitra | 1002 | 33.3 | 10.5 | |
Labour | Allan Murungi | 258 | 8.6 | 3.0 | |
Freedom Alliance | Karen Clyde | 91 | 3.0 | 3.0 | |
Majority | 625 | 20.8 | -21.1 | ||
Turnout | 3003 | 38% | 4% | ||
Liberal Democrats hold | Swing | ||||
25 ballot papers were rejected
Party | Candidate | Votes | % | ±% | |
---|---|---|---|---|---|
Conservative | Pauline Helliar-Symmons | 1,616 | 56.8 | 4.7 | |
Liberal Democrats | Robert Comber | 1005 | 35.3 | -4.0 | |
Labour | Brent Lees | 210 | 7.4 | -1.3 | |
Majority | 611 | 21.4 | 8.6 | ||
Turnout | 2843 | 44% | 7% | ||
Conservative hold | Swing | ||||
12 ballot papers were rejected
The 2006 St Helens Metropolitan Borough Council election took place on 4 May 2006 to elect members of St Helens Metropolitan Borough Council in Merseyside, England. One third of the council was up for election and the council stayed under no overall control.
Elections to the Borough Council in Slough, England, were held on 3 May 2007. One third of the council was up for election. This was the 122nd Slough general local authority election since Slough became a local government unit in 1863.
The 2003 Harlow District Council election took place on 1 May 2003 to elect members of Harlow District Council in Essex, England. One third of the council was up for election and the council stayed under no overall control.
The 2002 Wokingham District Council election took place on 2 May 2002 to elect members of Wokingham Unitary Council in Berkshire, England. One third of the council was up for election and the Conservative party gained overall control of the council from no overall control.
The 2003 Wokingham District Council election took place on 1 May 2003 to elect members of Wokingham Unitary Council in Berkshire, England. One third of the council was up for election and the Conservative Party stayed in overall control of the council.
The 2006 Wokingham District Council election took place on 4 May 2006 to elect members of Wokingham Unitary Council in Berkshire, England. One third of the council was up for election and the Conservative Party stayed in overall control of the council.
The 2008 Wokingham Borough Council election took place on 1 May 2008 to elect members of Wokingham Unitary Council in Berkshire, England. One third of the council was up for election and the Conservative Party stayed in overall control of the council.
The 2010 Wokingham Borough Council election took place on 6 May 2010 to elect members of Wokingham Unitary Council in Berkshire, England. One third of the council was up for election and the Conservative Party stayed in overall control of the council.
The 2011 Wokingham Borough Council election took place on 5 May 2011 to elect members of Wokingham Unitary Council in Berkshire, England. One third of the council was up for election and the Conservative Party stayed in overall control of the council.
The 2012 Wokingham Borough Council election took place on Thursday 3 May 2012, the same day as other 2012 United Kingdom local elections, to elect members of Wokingham Unitary Council in Berkshire, England. One third of the council was up for election and the Conservative Party stayed in overall control of the council.
The 2014 Wokingham Borough Council election took place on Thursday 22 May 2014. That was the same day as other United Kingdom local elections in order to elect members of Wokingham Unitary Council in Berkshire, England. One third of the council was up for election and the Conservative Party stayed comfortably in overall control of the council.
The 2015 Wokingham Borough Council election took place on 7 May 2015 to elect members of Wokingham Borough Council in England. This was on the same day as other local elections.
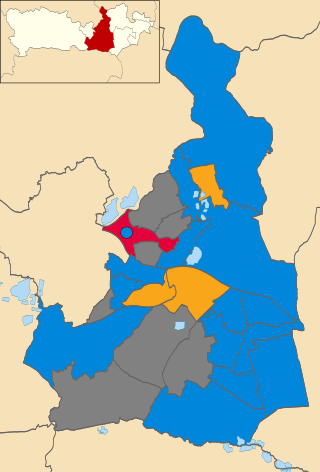
The 2016 Wokingham Borough Council election took place on 5 May 2016 to elect members of Wokingham Borough Council in England. This was on the same day as other local elections.
The 2018 Wokingham Borough Council election took place on Thursday 3 May 2018. That was the same day as other United Kingdom local elections in order to elect members of Wokingham Unitary Council in Berkshire, England. One third of the council was up for election and the Conservative Party stayed comfortably in overall control of the council.
The 2019 Wokingham Borough Council election took place on Thursday 2 May 2019. That was the same day as other United Kingdom local elections in order to elect members of Wokingham Unitary Council in Berkshire, England. One third of the council was up for election.
The 2021 Worthing Borough Council election took place on 6 May 2021 to elect members of Worthing Borough Council, on the same day as other UK local elections. This election was originally scheduled to take place on 7 May 2020, but was delayed a year due to the COVID-19 pandemic; 2021 was originally scheduled to be an off-year for Worthing Borough Council elections. A third of the council was up for election, a total of 13 councillors. Candidates elected in 2016 had their term expire at this election.
The 2022 Southwark London Borough Council election took place on 5 May 2022. All 63 members of Southwark London Borough Council were elected. The elections took place alongside local elections in the other London boroughs and elections to local authorities across the United Kingdom.
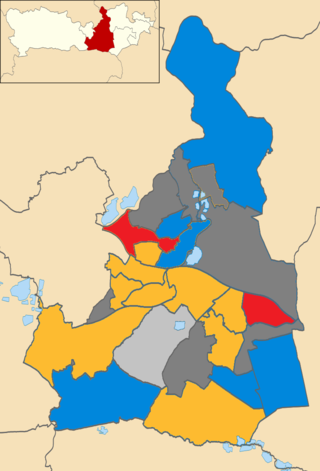
The 2022 Wokingham Borough Council election took place as of Thursday 5 May 2022. That was the same day as other United Kingdom local elections in order to elect members of Wokingham Unitary Council in Berkshire, England. One third of the council, 18 seats, was up for election and the Conservative Party lost control of the council, but was the largest group.
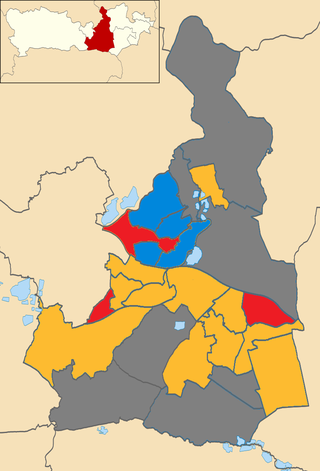
The 2023 Wokingham Borough Council election took place on Thursday 4 May 2023, to elect members of Wokingham Borough Council in Berkshire, England. This was on the same day as other local elections across England. One third of the council, 18 seats, was up for election.
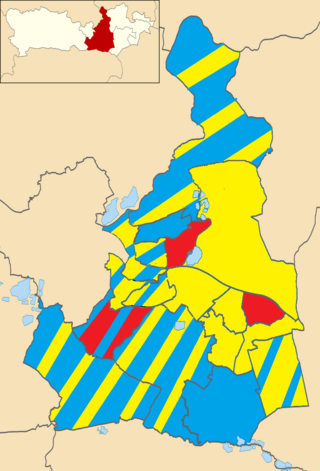
The 2024 Wokingham Borough Council election took place on Thursday 2 May 2024, to elect members of Wokingham Borough Council in Berkshire, England. This was on the same day as other local elections across England. Due to boundary changes, all 54 seats, were up for election. The main impact of the boundary changes is that all wards in the Borough are now three member wards. The old warding system had a mix of one, two and three member wards.