| |||||||||||||||||||||||||||||||||||||||||||||||||||||||||||||
| |||||||||||||||||||||||||||||||||||||||||||||||||||||||||||||
12 of the 37 seats to Brentwood Borough Council 19 seats needed for a majority | |||||||||||||||||||||||||||||||||||||||||||||||||||||||||||||
---|---|---|---|---|---|---|---|---|---|---|---|---|---|---|---|---|---|---|---|---|---|---|---|---|---|---|---|---|---|---|---|---|---|---|---|---|---|---|---|---|---|---|---|---|---|---|---|---|---|---|---|---|---|---|---|---|---|---|---|---|---|
| |||||||||||||||||||||||||||||||||||||||||||||||||||||||||||||
Winner in each ward for the 2021 Brentwood Borough Council election | |||||||||||||||||||||||||||||||||||||||||||||||||||||||||||||
|
The 2021 Brentwood Borough Council election took place on 6 May 2021 to elect members of Brentwood Borough Council in England. [1] This was on the same day as other local elections.
2021 Brentwood Borough Council election [2] | ||||||||||
---|---|---|---|---|---|---|---|---|---|---|
Party | This election | Full council | This election | |||||||
Seats | Net | Seats % | Other | Total | Total % | Votes | Votes % | +/− | ||
Conservative | 9 | 3 | 75.0 | 14 | 23 | 62.2 | 9,443 | 49.1 | +7.5 | |
Liberal Democrats | 3 | 1 | 25.0 | 9 | 12 | 32.4 | 6,092 | 31.7 | -9.2 | |
Labour | 0 | 1 | 0.0 | 2 | 2 | 5.4 | 2,185 | 11.4 | +0.9 | |
Green | 0 | 0.0 | 0 | 0 | 0.0 | 743 | 3.9 | +0.6 | ||
Independent | 0 | 1 | 0.0 | 0 | 0 | 0.0 | 638 | 3.3 | +0.5 | |
Reform UK | 0 | 0.0 | 0 | 0 | 0.0 | 112 | 0.6 | New | ||
Party | Candidate | Votes | % | ±% | |
---|---|---|---|---|---|
Liberal Democrats | Alison Fulcher | 748 | 42.5 | -14.5 | |
Conservative | April Goulding | 544 | 30.9 | +7.4 | |
Green | Kelda Boothroyd | 232 | 13.2 | +3.8 | |
Labour | Oliver Durose | 191 | 10.9 | +0.8 | |
Reform UK | Robert Prince | 45 | 2.6 | New | |
Majority | 204 | 11.6 | -21.9 | ||
Turnout | 1,774 | 32.5 | +3.5 | ||
Liberal Democrats hold | Swing | 11.0 | |||
Party | Candidate | Votes | % | ±% | |
---|---|---|---|---|---|
Conservative | Andy Wiles | 665 | 40.3 | +4.1 | |
Labour | Susan Kortlandt | 655 | 39.7 | -0.8 | |
Liberal Democrats | Brenner Munden | 330 | 20.0 | -3.2 | |
Majority | 10 | 0.6 | N/A | ||
Turnout | 1,666 | 35.5 | +6.5 | ||
Conservative gain from Labour | Swing | 2.5 | |||
Party | Candidate | Votes | % | ±% | |
---|---|---|---|---|---|
Conservative | Will Russell | 883 | 45.7 | +7.7 | |
Liberal Democrats | Karen Chilvers | 737 | 38.1 | -10.1 | |
Labour | Deborah Foster | 180 | 9.3 | +2.1 | |
Green | Janice Gearon-Simm | 99 | 5.1 | -1.6 | |
Reform UK | Dave Conway | 33 | 1.7 | New | |
Majority | 146 | 7.6 | N/A | ||
Turnout | 1,944 | 34.1 | +3.1 | ||
Conservative gain from Liberal Democrats | Swing | 8.9 | |||
Party | Candidate | Votes | % | ±% | |
---|---|---|---|---|---|
Conservative | Christine Gelderbloem | 1,165 | 66.3 | +10.6 | |
Liberal Democrats | Hugh Gorton | 485 | 27.6 | -10.9 | |
Labour | Kevin Brailey | 108 | 6.1 | +0.3 | |
Majority | 680 | 38.7 | +21.5 | ||
Turnout | 1,763 | 36.8 | 5.8 | ||
Conservative hold | Swing | 10.8 | |||
Party | Candidate | Votes | % | ±% | |
---|---|---|---|---|---|
Conservative | Garry White | 698 | 64.0 | -7.0 | |
Liberal Democrats | Laura Carey | 253 | 23.2 | +9.5 | |
Labour | Philip Holland | 139 | 12.8 | -2.5 | |
Majority | 445 | 40.8 | |||
Turnout | 1,102 | 36.8 | |||
Conservative hold | Swing | 8.3 | |||
Party | Candidate | Votes | % | ±% | |
---|---|---|---|---|---|
Conservative | Keith Barber | 756 | 68.4 | +6.8 | |
Liberal Democrats | Taylor Higgins | 204 | 18.4 | -5.2 | |
Labour | Liam Preston | 146 | 13.2 | -1.6 | |
Majority | 552 | 50.0 | +12.0 | ||
Turnout | 1,120 | 34.8 | +3.8 | ||
Conservative hold | Swing | 6.0 | |||
Party | Candidate | Votes | % | ±% | |
---|---|---|---|---|---|
Conservative | Mark Reed | 829 | 72.8 | -3.2 | |
Labour | Jane Winter | 129 | 11.3 | -2.6 | |
Liberal Democrats | Alexander Carter | 101 | 8.9 | -1.2 | |
Green | Karen Smith | 80 | 7.0 | New | |
Majority | 700 | 61.5 | |||
Turnout | 1,149 | 38.0 | |||
Conservative hold | Swing | 0.3 | |||
Party | Candidate | Votes | % | ±% | |
---|---|---|---|---|---|
Conservative | Lesley Wagland | 1,030 | 50.3 | +5.0 | |
Liberal Democrats | Darryl Sankey | 763 | 37.3 | -4.0 | |
Green | Paul Jeater | 159 | 7.8 | -1.1 | |
Labour | Joanna Moncrieff | 94 | 4.6 | ±0.0 | |
Majority | 267 | 13.0 | +9.0 | ||
Turnout | 2,058 | 40.4 | +3.4 | ||
Conservative hold | Swing | 4.5 | |||
Party | Candidate | Votes | % | ±% | |
---|---|---|---|---|---|
Liberal Democrats | David Kendall | 913 | 58.7 | -12.8 | |
Conservative | Kelly Herbert | 455 | 29.3 | +8.3 | |
Labour | Cameron Ball | 134 | 8.6 | +1.1 | |
Green | John Hamilton | 53 | 3.4 | New | |
Majority | 458 | 29.4 | -21.5 | ||
Turnout | 1,564 | 33.6 | +1.6 | ||
Liberal Democrats hold | Swing | 10.6 | |||
Party | Candidate | Votes | % | ±% | |
---|---|---|---|---|---|
Conservative | Thomas Heard | 997 | 49.0 | +6.7 | |
Liberal Democrats | Gary MacDonnell | 789 | 38.8 | -15.1 | |
Labour | Elizabeth Jerrard | 130 | 6.4 | +2.6 | |
Green | Anne Milward | 120 | 5.9 | New | |
Majority | 208 | 10.2 | -1.4 | ||
Turnout | 2,052 | 47.1 | +3.1 | ||
Conservative hold | Swing | 10.9 | |||
Party | Candidate | Votes | % | ±% | |
---|---|---|---|---|---|
Conservative | Thomas Bridge | 673 | 49.2 | -3.0 | |
Independent | Roger Keeble | 638 | 46.6 | +3.8 | |
Labour | Thomas Acton | 57 | 4.2 | -0.8 | |
Majority | 35 | 2.6 | -6.8 | ||
Turnout | 1,371 | 43.3 | +8.3 | ||
Conservative gain from Independent | Swing | 3.4 | |||
Party | Candidate | Votes | % | ±% | |
---|---|---|---|---|---|
Liberal Democrats | Martin Cuthbert | 769 | 43.4 | -6.3 | |
Conservative | Jason Gibson | 748 | 42.2 | +16.1 | |
Labour | Richard Millwood | 222 | 12.5 | +5.8 | |
Reform UK | William Hughes | 34 | 1.9 | New | |
Majority | 21 | 1.2 | -22.4 | ||
Turnout | 1,781 | 36.0 | +4.0 | ||
Liberal Democrats hold | Swing | 11.2 | |||
Epping Forest District is a local government district in Essex, England. It is named after the ancient woodland of Epping Forest, a large part of which lies within the district. The district covers northeastern parts of the urban area of London, including the suburban towns of Epping, Loughton, Waltham Abbey, Chigwell, and Buckhurst Hill, as well as rural areas beyond it. The district is situated in the west of the county, bordering north-eastern Greater London.
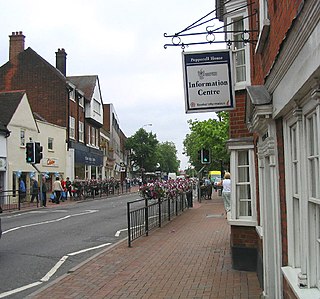
The Borough of Brentwood is a local government district with borough status in Essex, England. The borough is named after its main town of Brentwood, where the council is based; it includes several villages and the surrounding rural area.
Romford is a constituency in Greater London represented in the House of Commons of the UK Parliament since 2001 by Andrew Rosindell, a Conservative.
One third of Brentwood Borough Council in Essex, England is elected each year, followed by one year where there is an election to Essex County Council. Since the last boundary changes in 2002, 37 councillors have been elected from 15 wards.
Chelmsford is a constituency in Essex represented in the House of Commons of the UK Parliament since 2017 by Vicky Ford of the Conservative Party.
The 2010 Brentwood council election took place on 6 May 2010 to elect members of Brentwood District Council in Essex, England as part of the 2010 United Kingdom local elections. One third of the council was up for election with the council previously having a majority for the Conservative party. The Conservative Party lost two seats to the Liberal Democrats in Brentwood North and Brentwood West respectively.
Essex County Council in England is elected every four years. Since the last boundary changes in 2005, 75 councillors are elected from 70 wards.
Brentwood is a town in Essex, England, in the London commuter belt 20 miles (30 km) north-east of Charing Cross and close to the M25 motorway. The population of the built-up area was 55,340 in 2021.
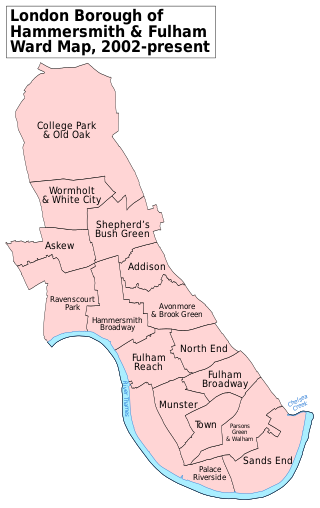
Hammersmith and Fulham London Borough Council is the local authority for the London Borough of Hammersmith and Fulham in London, England. The council is elected every four years.
The 2012 Brentwood Borough Council election to the Brentwood Borough Council in Essex took place on Thursday 3 May 2012.
The 2015 Brentwood Borough Council election took place on 7 May 2015 to elect members of the Brentwood Borough Council in England. They were held on the same day as other local elections.
The 2019 Brentwood Borough Council election took place on 2 May 2019 to elect members of Brentwood Borough Council in England. This was on the same day as other local elections.
The 1990 Brentwood Borough Council election took place on 3 May 1990 to elect members of Brentwood Borough Council in England.
The 1991 Brentwood Borough Council election took place on 2 May 1991 to elect members of Brentwood Borough Council in England.
The 1992 Brentwood Borough Council election took place on 7 May 1992 to elect members of Brentwood Borough Council in England.
The 1994 Brentwood Borough Council election took place on 5 May 1994 to elect members of Brentwood Borough Council in England.
The 1995 Brentwood Borough Council election took place on 4 May 1995 to elect members of the Brentwood Borough Council in England.
The 1996 Brentwood Borough Council election took place on 2 May 1996 to elect members of Brentwood Borough Council in England.
Elections to Stevenage Borough Council took place on 6 May 2021. This was on the same day as other local elections across the United Kingdom. One third of the council was up for election, plus a by-election in Roebuck ward; the seats which were last contested in 2016. The Labour Party retained control of the council, which it has held continuously since 1973, but with a reduced majority.
The 2022 Brentwood Borough Council election took place on 5 May 2022 to elect members of Brentwood Borough Council in England. This was on the same day as other local elections.