2004 Harlow District Council election

Last updated

2004 Harlow District Council election
  2003 10 June 2004 2006  

11 of the 33 seats to Harlow District Council
17 seats needed for a majority
 First partySecond partyThird party
 
Party Conservative Labour Liberal Democrats
Last election12912
Seats before13910
Seats won452
Seats after13119
Seat changeSteady2.svgIncrease2.svg2Decrease2.svg1
Popular vote6,5316,8124,494
Percentage31.7%33.1%21.8%

 Fourth party
 
Party Independent
Last election0
Seats before1
Seats won0
Seats after0
Seat changeDecrease2.svg1
Popular vote2,399
Percentage11.6%

Harlow UK local election 2004 map.svg
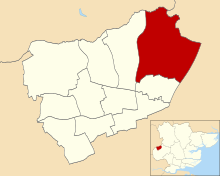
Map showing the results of contested wards in the 2004 Harlow District Council elections.

Council control before election

No overall control

Council control after election

No overall control

The 2004 Harlow District Council election took place on 10 June 2004 to elect members of Harlow District Council in Essex, England. One third of the council was up for election and the council stayed under no overall control. [1]

Contents

After the election, the composition of the council was

Background

After the last election in 2003 both the Conservatives and Liberal Democrats had 12 seats, while Labour had 9 councillors. [3] However, in July 2003 councillor Jane Steer defected from the Liberal Democrats to the Conservatives, making the Conservatives the largest group on the council for the first time in almost 50 years with 13 seats. [4] The joint administration between the Conservatives and Liberal Democrats continued to run the council. [4]

Meanwhile, in January 2004 the Liberal Democrat group on the council expelled Matthew Shepherd from the party's group on the council. [5]

Election result

Overall turnout at the election was 37%. [6]

Harlow local election result 2004 [2] [6]
PartySeatsGainsLossesNet gain/lossSeats %Votes %Votes+/−
  Labour 520Increase2.svg245.533.16,812Decrease2.svg5.2
  Conservative 400Steady2.svg36.431.76,531Decrease2.svg1.0
  Liberal Democrats 201Decrease2.svg118.221.84,494Decrease2.svg6.0
  Independent 001Decrease2.svg1011.62,399Increase2.svg11.6
  UKIP 000Steady2.svg01.8364Increase2.svg1.8

Ward results

Bush Fair

Location of Bush Fair ward Bush Fair ward in Harlow 2002.svg
Location of Bush Fair ward
Bush Fair [6]
PartyCandidateVotes%±%
Labour Robert Eschle 751 34.9 −8.8
Liberal Democrats Christopher Robins69032.1−14.4
Conservative Guy Mitchinson38317.8+8.0
Independent William Henderson32515.1+15.1
Majority612.8
Turnout 2,14940.2+8.9
Labour gain from Liberal Democrats Swing

Church Langley

Location of Church Langley ward Church Langley ward in Harlow 2002.svg
Location of Church Langley ward
Church Langley [6]
PartyCandidateVotes%±%
Conservative Simon Carter 1,073 61.6 −6.6
Liberal Democrats Linda Pailing40022.9+5.6
Labour Kenneth Lawrie27015.5+1.0
Majority68338.7−12.2
Turnout 1,74330.5+8.0
Conservative hold Swing

Great Parndon

Location of Great Parndon ward Great Parndon ward in Harlow 2002.svg
Location of Great Parndon ward
Great Parndon [6]
PartyCandidateVotes%±%
Conservative Edward Johnson 775 40.0 −9.3
Labour Suzanne Ennifer61231.6−4.3
Independent Raymond Statham33217.1+17.1
Liberal Democrats Ian Rideout22011.3−3.4
Majority1638.4−5.0
Turnout 1,93938.9+8.0
Conservative hold Swing

Harlow Common

Location of Harlow Common ward Harlow Common ward in Harlow 2002.svg
Location of Harlow Common ward
Harlow Common [6]
PartyCandidateVotes%±%
Labour Gregory Peck 785 39.1 −15.4
Conservative Pamela Norton65432.6+2.2
Independent Gary Roberts30815.3+15.3
Liberal Democrats Clive Enders26213.0−2.1
Majority1316.5−17.6
Turnout 2,00938.1+9.0
Labour hold Swing

Little Parndon & Hare Street

Location of Little Parndon and Hare Street ward Little Parndon ward in Harlow 2002.svg
Location of Little Parndon and Hare Street ward
Little Parndon & Hare Street [6]
PartyCandidateVotes%±%
Labour John Jesse 869 46.7 −2.5
Conservative Lee Dangerfield58931.6+11.2
Liberal Democrats John Steer40421.7−4.2
Majority28015.1−8.2
Turnout 1,86237.2+6.2
Labour hold Swing

Mark Hall

Location of Mark Hall ward Mark Hall ward in Harlow 2002.svg
Location of Mark Hall ward
Mark Hall [6]
PartyCandidateVotes%±%
Labour Sean Folan 800 38.9 +0.7
Liberal Democrats Nicholas Macy58428.4−16.4
Conservative Christopher Lane38118.5+5.1
Independent Katrina Ray29014.1+14.1
Majority21610.5
Turnout 2,05542.9+9.3
Labour gain from Independent Swing

Netteswell

Location of Netteswell ward Netteswell ward in Harlow 2002.svg
Location of Netteswell ward
Netteswell [6]
PartyCandidateVotes%±%
Liberal Democrats Ian Jackson 627 34.1 −15.7
Labour Feroz Khan44824.3−8.2
UKIP Anthony Bennett36419.8+19.8
Conservative Andrew Shannon26014.1+1.8
Independent Dean Weston1417.7+7.7
Majority1799.8−7.5
Turnout 1,84036.4+7.2
Liberal Democrats hold Swing

Old Harlow

Location of Old Harlow ward Old Harlow in Harlow 2002.svg
Location of Old Harlow ward
Old Harlow [6]
PartyCandidateVotes%±%
Conservative Muriel Jolles 748 37.7 −18.6
Independent Colleen Morrison53426.9+26.9
Labour Paul Sztumpf49625.0−4.9
Liberal Democrats Simon MacNeill20810.5−3.3
Majority21410.8−15.6
Turnout 1,98642.4+7.9
Conservative hold Swing

Staple Tye

Location of Staple Tye ward Staple Tye in Harlow 2002.svg
Location of Staple Tye ward
Staple Tye [6]
PartyCandidateVotes%±%
Liberal Democrats Susan Lawton 583 38.2 −17.0
Labour Caroline Carter40226.3+0.1
Conservative Peter Dobson36123.7+5.1
Independent David Lambert18011.8+11.8
Majority18111.9−17.1
Turnout 1,52632.4+9.7
Liberal Democrats hold Swing

Sumners and Kingsmoor

Location of Summers and Kingsmoor ward Summers and Kingsmoor in Harlow 2002.svg
Location of Summers and Kingsmoor ward
Sumners and Kingsmoor [6]
PartyCandidateVotes%±%
Conservative John Goddard 783 46.0 −2.2
Labour Robert Long62336.6−1.5
Liberal Democrats Kuzna Jackson29517.3+3.6
Majority1609.4−0.7
Turnout 1,70133.5+8.1
Conservative hold Swing

Toddbrook

Location of Toddbrook ward Toddbrook in Harlow 2002.svg
Location of Toddbrook ward
Toddbrook [6]
PartyCandidateVotes%±%
Labour Kevin Brooks 756 42.2 −6.6
Conservative Paul Richardson52429.3−7.3
Independent Rex Amor28916.1+16.1
Liberal Democrats Paul Westlake22112.3−2.3
Majority23212.9+0.7
Turnout 1,79035.4+5.8
Labour hold Swing

References

  1. "Harlow council". BBC News. 11 June 2004. Retrieved 31 December 2014.
  2. 1 2 "How the southeast voted in the district council polls". Evening Standard. London. 11 June 2004 via NewsBank.
  3. "Local elections". BBC News. Retrieved 1 January 2015.
  4. 1 2 Scotchbrook, Eleanor (30 July 2003). "Lib Dem defection rocks council". Harlow Citizen via NewsBank.
  5. "News Release from the Liberal Democrats on Harlow District Council". Harlow Liberal Democrats. 12 January 2004. Retrieved 1 January 2015.
  6. 1 2 3 4 5 6 7 8 9 10 11 12 13 "Election results". Harlow District Council. 11 June 2004. Archived from the original on 22 October 2004. Retrieved 31 December 2014.