The 2004 Swale Borough Council election took place on 10 June 2004 to elect members of Swale Borough Council in Kent, England. One third of the council was up for election and the Conservative party stayed in overall control of the council. [1]
After the election, the composition of the council was
The Conservatives increased their majority on the council after gaining two seats, but also losing one seat to Labour. [3] The Conservatives gains came in Abbey, which they took from Labour, and in Iwade & Lower Halstow from the Liberal Democrats, while the Conservative group leader Andrew Bowles was one of the councillors who retained their seats. [3] However the Labour mayoress of Swale, Jackie Constable, won in Queenborough & Halfway to take the seat from the Conservatives. [3]
Party | Seats | Gains | Losses | Net gain/loss | Seats % | Votes % | Votes | +/− | |
---|---|---|---|---|---|---|---|---|---|
Conservative | 9 | 2 | 1 | +1 | 56.3 | 46.4 | 9,647 | +1.7% | |
Liberal Democrats | 4 | 0 | 1 | -1 | 25.0 | 21.4 | 4,439 | -3.9% | |
Labour | 3 | 1 | 1 | 0 | 18.8 | 29.4 | 6,106 | +2.9% | |
UKIP | 0 | 0 | 0 | 0 | 0 | 1.1 | 232 | +1.1% | |
Independent | 0 | 0 | 0 | 0 | 0 | 0.9 | 194 | +0.9% | |
Rock 'n' Roll Loony | 0 | 0 | 0 | 0 | 0 | 0.8 | 157 | -2.6% |
Party | Candidate | Votes | % | ±% | |
---|---|---|---|---|---|
Conservative | Anita Walker | 683 | 53.0 | ||
Labour | Peter Salmon | 606 | 47.0 | ||
Majority | 77 | 6.0 | |||
Turnout | 1,289 | 38.2 | +5.7 | ||
Conservative gain from Labour | Swing | ||||
Party | Candidate | Votes | % | ±% | |
---|---|---|---|---|---|
Conservative | Andrew Bowles | 1,134 | 67.0 | -2.8 | |
Liberal Democrats | June Hammond | 295 | 17.4 | +4.1 | |
Labour | Valerie Rowe | 263 | 15.5 | -1.5 | |
Majority | 839 | 49.6 | -3.2 | ||
Turnout | 1,692 | 43.0 | +9.3 | ||
Conservative hold | Swing |
Party | Candidate | Votes | % | ±% | |
---|---|---|---|---|---|
Labour | Ghlin Whelan | 560 | 47.6 | ||
Conservative | Derek Carnell | 388 | 33.0 | ||
Liberal Democrats | Diane Fellows | 228 | 19.4 | ||
Majority | 172 | 14.6 | |||
Turnout | 1,176 | 33.9 | +3.6 | ||
Labour hold | Swing |
Party | Candidate | Votes | % | ±% | |
---|---|---|---|---|---|
Conservative | Brian Tovey | 429 | 65.7 | +3.7 | |
Labour | Caroline MacDonald | 224 | 34.3 | -3.7 | |
Majority | 205 | 31.4 | +7.4 | ||
Turnout | 653 | 37.0 | +1.1 | ||
Conservative hold | Swing |
Party | Candidate | Votes | % | ±% | |
---|---|---|---|---|---|
Conservative | Colin Prescott | 682 | 76.9 | +1.1 | |
Labour | Catherine Read | 205 | 23.1 | -1.1 | |
Majority | 477 | 53.8 | +2.2 | ||
Turnout | 887 | 46.3 | +10.0 | ||
Conservative hold | Swing |
Party | Candidate | Votes | % | ±% | |
---|---|---|---|---|---|
Conservative | Benjamin Stokes | 381 | 41.4 | +16.9 | |
Liberal Democrats | Mary Goodger | 342 | 37.2 | -19.1 | |
Labour | Kenneth Stevens | 197 | 21.4 | +2.2 | |
Majority | 39 | 4.2 | |||
Turnout | 920 | 44.5 | +10.8 | ||
Conservative gain from Liberal Democrats | Swing | ||||
Party | Candidate | Votes | % | ±% | |
---|---|---|---|---|---|
Conservative | Susan Gent | 531 | 50.0 | ||
UKIP | Keith Woollven | 232 | 21.9 | ||
Labour | Anthony Winckless | 184 | 17.3 | ||
Liberal Democrats | Kenneth Stammers | 114 | 10.7 | ||
Majority | 299 | 28.2 | |||
Turnout | 1,061 | 27.5 | +5.5 | ||
Conservative hold | Swing |
Party | Candidate | Votes | % | ±% | |
---|---|---|---|---|---|
Liberal Democrats | Elvina Lowe | 568 | 47.0 | +13.2 | |
Labour | Phyllis Stevens | 365 | 30.2 | -18.7 | |
Conservative | Patricia Martin | 219 | 18.1 | +4.0 | |
Rock 'n' Roll Loony | Jackie Davidson | 57 | 4.7 | +1.6 | |
Majority | 203 | 16.8 | +1.7 | ||
Turnout | 1,209 | 38.0 | +8.0 | ||
Liberal Democrats hold | Swing |
Party | Candidate | Votes | % | ±% | |
---|---|---|---|---|---|
Liberal Democrats | Michael Brown | 725 | 39.4 | +8.7 | |
Conservative | Katherine Coles | 684 | 37.2 | +1.9 | |
Labour | Libby Tucker | 329 | 17.9 | -10.5 | |
Rock 'n' Roll Loony | Michael Young | 100 | 5.4 | -0.2 | |
Majority | 41 | 2.2 | |||
Turnout | 1,838 | 35.3 | +6.8 | ||
Liberal Democrats hold | Swing |
Party | Candidate | Votes | % | ±% | |
---|---|---|---|---|---|
Liberal Democrats | David Banks | 585 | 59.7 | ||
Conservative | Nailesh Patel | 208 | 21.2 | ||
Labour | Kenneth Rowles | 187 | 19.1 | ||
Majority | 377 | 38.5 | |||
Turnout | 980 | 28.6 | +2.0 | ||
Liberal Democrats hold | Swing |
Party | Candidate | Votes | % | ±% | |
---|---|---|---|---|---|
Labour | Jacqueline Constable | 754 | 41.9 | +14.0 | |
Conservative | Kenneth Pugh | 712 | 39.5 | -6.0 | |
Independent | David Cassidy | 194 | 10.8 | +10.8 | |
Liberal Democrats | Colin Howe | 141 | 7.8 | -1.1 | |
Majority | 42 | 2.3 | |||
Turnout | 1,801 | 35.7 | +7.2 | ||
Labour gain from Conservative | Swing | ||||
Party | Candidate | Votes | % | ±% | |
---|---|---|---|---|---|
Labour | Michael Haywood | 666 | 54.5 | ||
Conservative | Mayuri Patel | 297 | 24.3 | ||
Liberal Democrats | David Spurling | 260 | 21.3 | ||
Majority | 369 | 30.2 | |||
Turnout | 1,223 | 36.7 | +4.3 | ||
Labour hold | Swing |
Party | Candidate | Votes | % | ±% | |
---|---|---|---|---|---|
Conservative | Sandra Garside | 738 | 46.4 | +1.0 | |
Labour | John Crouch | 561 | 35.3 | -0.7 | |
Liberal Democrats | Christine Martin | 291 | 18.3 | +5.9 | |
Majority | 177 | 11.1 | +1.7 | ||
Turnout | 1,590 | 32.0 | +10.2 | ||
Conservative hold | Swing |
Party | Candidate | Votes | % | ±% | |
---|---|---|---|---|---|
Conservative | Trevor Fentiman | 825 | 55.0 | ||
Labour | Paul Durkin | 350 | 23.3 | ||
Liberal Democrats | Martin Bellis | 324 | 21.6 | ||
Majority | 475 | 31.7 | |||
Turnout | 1,499 | 41.5 | +9.2 | ||
Conservative hold | Swing |
Party | Candidate | Votes | % | ±% | |
---|---|---|---|---|---|
Liberal Democrats | Brenda Hammond | 566 | 42.7 | +4.7 | |
Conservative | Susan Norris | 560 | 42.3 | +7.6 | |
Labour | Eamonn Norton | 198 | 15.0 | -10.1 | |
Majority | 6 | 0.5 | -2.9 | ||
Turnout | 1,324 | 41.1 | +10.5 | ||
Liberal Democrats hold | Swing |
Party | Candidate | Votes | % | ±% | |
---|---|---|---|---|---|
Conservative | David Simmons | 1,176 | 72.0 | ||
Labour | Ruth Hefferon | 457 | 28.0 | ||
Majority | 719 | 44.0 | |||
Turnout | 1,633 | 45.1 | +4.1 | ||
Conservative hold | Swing |
The 2008 St Helens Metropolitan Borough Council election took place on 1 May 2008 to elect members of St Helens Metropolitan Borough Council in Merseyside, England. One third of the council was up for election and the council stayed under no overall control.
The 2007 St Helens Metropolitan Borough Council election took place on 3 May 2007 to elect members of St Helens Metropolitan Borough Council in Merseyside, England. One third of the council was up for election and the council stayed under no overall control.
The 2004 St Albans City and District Council election took place on 10 June 2004 to elect members of St Albans District Council in Hertfordshire, England. One third of the council was up for election and the council stayed under no overall control.
The 2004 Maidstone Borough Council election took place on 10 June 2004 to elect members of Maidstone Borough Council in Kent, England. One third of the council was up for election and the council stayed under no overall control.
The 2004 Hertsmere Borough Council election took place on 10 June 2004 to elect members of Hertsmere Borough Council in Hertfordshire, England. One third of the council was up for election and the Conservative party stayed in overall control of the council.
The 2004 Colchester Borough Council election took place on 10 June 2004 to elect members of Colchester Borough Council in Essex, England. This was the same day as the other 2004 United Kingdom local elections and as the 2004 European Parliament Elections. One third of the seats were up for election and the council stayed under no overall control.
The 2004 Havant Borough Council election took place on 10 June 2004 to elect members of Havant Borough Council in Hampshire, England. One third of the council was up for election and the Conservative party stayed in overall control of the council.
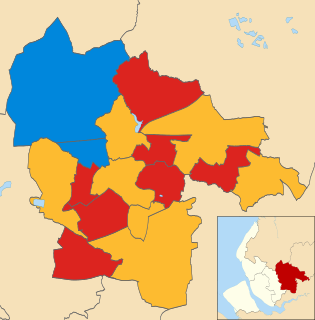
The 2006 Brent London Borough Council election took place on 4 May 2006 to elect members of Brent London Borough Council in London, England. The whole council was up for election and the Labour Party lost overall control of the council to no overall control.
The 2010 St Helens Metropolitan Borough Council election took place on 6 May 2010 to elect members of St Helens Metropolitan Borough Council in Merseyside, England. One third of the council was up for election and the Labour party gained overall control of the council from no overall control.
The 2011 St Helens Metropolitan Borough Council election took place on 5 May 2011 to elect members of St Helens Metropolitan Borough Council in Merseyside, England. One third of the council was up for election and the Labour party stayed in overall control of the council.
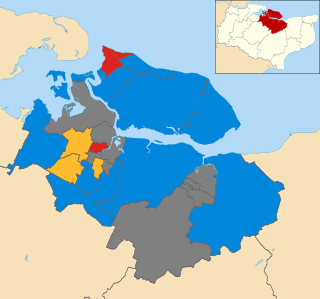
The 2000 Swale Borough Council election took place on 4 May 2000 to elect members of Swale Borough Council in Kent, England. One third of the council was up for election and the council remained under no overall control.
The 2002 Swale Borough Council election took place on 2 May 2002 to elect members of Swale Borough Council in Kent, England. The whole council was up for election with boundary changes since the last election in 2000 reducing the number of seats by two. The Conservative party gained overall control of the council from no overall control.
The 2003 Swale Borough Council election took place on 1 May 2003 to elect members of Swale Borough Council in Kent, England. One third of the council was up for election and the Conservative party stayed in overall control of the council.
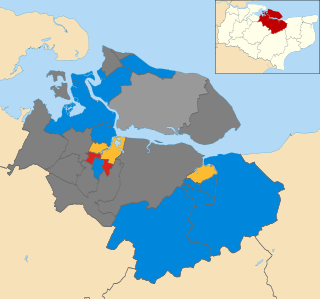
The 2006 Swale Borough Council election took place on 4 May 2006 to elect members of Swale Borough Council in Kent, England. One third of the council was up for election and the Conservative party stayed in overall control of the council.
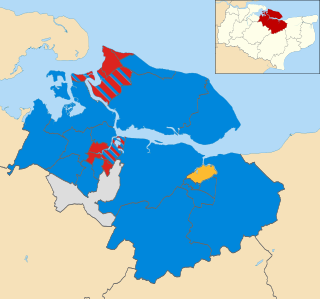
The 2007 Swale Borough Council election took place on 3 May 2007 to elect members of Swale Borough Council in Kent, England. One third of the council was up for election and the Conservative party stayed in overall control of the council.
The 2008 Swale Borough Council election took place on 1 May 2008 to elect members of Swale Borough Council in Kent, England. One third of the council was up for election and the Conservative party stayed in overall control of the council.
The 2010 Swale Borough Council election took place on 6 May 2010 to elect members of Swale Borough Council in Kent, England. One third of the council was up for election and the Conservative party stayed in overall control of the council.
The 2011 Swale Borough Council election took place on 5 May 2011 to elect members of Swale Borough Council in Kent, England. The whole council was up for election and the Conservative party stayed in overall control of the council.
The 2004 West Oxfordshire District Council election took place on 10 June 2004 to elect members of West Oxfordshire District Council in Oxfordshire, England. One third of the council was up for election and the Conservative party stayed in overall control of the council.
The 2006 West Oxfordshire District Council election took place on 4 May 2006 to elect members of West Oxfordshire District Council in Oxfordshire, England. One third of the council was up for election and the Conservative party stayed in overall control of the council.