| ||||||||||||||||||||||||||||||||||||||||||||||||||||||||||||||||||||
All 47 seats to Ashford Borough Council 24 seats needed for a majority | ||||||||||||||||||||||||||||||||||||||||||||||||||||||||||||||||||||
---|---|---|---|---|---|---|---|---|---|---|---|---|---|---|---|---|---|---|---|---|---|---|---|---|---|---|---|---|---|---|---|---|---|---|---|---|---|---|---|---|---|---|---|---|---|---|---|---|---|---|---|---|---|---|---|---|---|---|---|---|---|---|---|---|---|---|---|---|
| ||||||||||||||||||||||||||||||||||||||||||||||||||||||||||||||||||||
Winner of each seat at the 2019 Ashford Borough Council election | ||||||||||||||||||||||||||||||||||||||||||||||||||||||||||||||||||||
|
The 2019 Ashford Borough Council election took place on 2 May 2019 to elect members of Ashford Borough Council in England. [1] This was on the same day as other local elections.
2019 Ashford Borough Council election | ||||||||||
---|---|---|---|---|---|---|---|---|---|---|
Party | Candidates | Seats | Gains | Losses | Net gain/loss | Seats % | Votes % | Votes | +/− | |
Conservative | 47 | 26 | 0 | 8 | 8 | 55.3 | 39.2 | 13,429 | –12.7 | |
Ashford Ind. | 15 | 11 | 4 | 0 | 8 | 23.4 | 19.1 | 6,544 | +13.5 | |
Labour | 27 | 7 | 3 | 0 | 3 | 14.9 | 16.0 | 5,476 | –3.9 | |
Green | 19 | 2 | 2 | 0 | 2 | 4.3 | 13.2 | 4,500 | +6.7 | |
Independent | 1 | 1 | 1 | 0 | 1 | 2.1 | 1.6 | 556 | –1.3 | |
Liberal Democrats | 15 | 0 | 0 | 1 | 1 | 0.0 | 6.4 | 2,203 | +3.3 | |
UKIP | 8 | 0 | 0 | 1 | 1 | 0.0 | 4.4 | 1,510 | –5.7 |
Party | Candidate | Votes | % | ||
---|---|---|---|---|---|
Ashford Ind. | David Smith | 426 | 38.5 | ||
Ashford Ind. | Andy Rogers | 365 | 33.0 | ||
Labour | Matthew Harris | 253 | 22.9 | ||
Labour | Garry Harrison | 237 | 21.4 | ||
Green | Joanna Baker | 160 | 14.5 | ||
Conservative | John Seaton | 150 | 13.6 | ||
UKIP | Dave Vegas | 147 | 13.3 | ||
Conservative | Ijeoma Onweluzo | 121 | 10.9 | ||
Green | Philip Monaghan | 88 | 8.0 | ||
Liberal Democrats | Hein Behrens | 70 | 6.3 | ||
Majority | |||||
Turnout | 1,115 | 24.6 | |||
Ashford Ind. win (new seat) | |||||
Ashford Ind. win (new seat) |
Party | Candidate | Votes | % | ±% | |
---|---|---|---|---|---|
Labour | Lyn Suddards | 480 | 43.4 | ||
Labour | Alexander Ward | 437 | 39.5 | ||
UKIP | Thomas Taylor | 283 | 25.6 | ||
Conservative | Amanda Hodgkinson | 238 | 21.5 | ||
Green | Maria Pizzey | 237 | 21.4 | ||
Conservative | Rob Dobson | 183 | 16.6 | ||
Majority | |||||
Turnout | 1,107 | 24.1 | |||
Labour hold | Swing | ||||
Labour gain from UKIP | Swing | ||||
Party | Candidate | Votes | % | ±% | |
---|---|---|---|---|---|
Conservative | Neil Bell | 575 | 72.0 | −1.0 | |
Green | Guy Pullen | 224 | 28.0 | +1.0 | |
Majority | |||||
Turnout | 805 | 34.5 | |||
Conservative hold | Swing | ||||
Party | Candidate | Votes | % | ||
---|---|---|---|---|---|
Conservative | William Howard | Unopposed | |||
Majority | |||||
Turnout | – | – | |||
Conservative win (new seat) |
Party | Candidate | Votes | % | ±% | |
---|---|---|---|---|---|
Labour | Diccon Spain | 280 | 49.1 | +15.6 | |
Conservative | Simon Howard-Smith | 222 | 38.9 | −27.6 | |
Liberal Democrats | Carol Wilcox | 68 | 11.9 | New | |
Majority | |||||
Turnout | 578 | 27.7 | |||
Labour gain from Conservative | Swing | ||||
Party | Candidate | Votes | % | ±% | |
---|---|---|---|---|---|
Ashford Ind. | Howard Turner | 297 | 43.9 | New | |
Conservative | Shafi Khan | 203 | 30.0 | −25.8 | |
Labour | Alan Dean | 176 | 26.0 | −18.2 | |
Majority | |||||
Turnout | 683 | 33.2 | |||
Ashford Ind. gain from Conservative | Swing | ||||
Party | Candidate | Votes | % | ±% | |
---|---|---|---|---|---|
Conservative | Gerry Clarkson | 479 | 71.6 | +20.5 | |
Labour | Janet White | 190 | 28.4 | New | |
Majority | |||||
Turnout | 719 | 33.9 | |||
Conservative hold | Swing | ||||
Party | Candidate | Votes | % | ||
---|---|---|---|---|---|
Ashford Ind. | Katherine Ovenden | 330 | 70.4 | ||
Conservative | Yvonne Roden | 139 | 29.6 | ||
Majority | |||||
Turnout | 474 | 31.6 | |||
Ashford Ind. win (new seat) |
Party | Candidate | Votes | % | ±% | |
---|---|---|---|---|---|
Conservative | Stephen Dehnel | 375 | 47.4 | −14.2 | |
Green | Marilyn Sansom | 186 | 23.5 | +4.3 | |
Liberal Democrats | David Reid | 148 | 18.7 | New | |
Labour | Carly Ruppert-Lingham | 82 | 10.4 | −8.8 | |
Majority | |||||
Turnout | 806 | 39.5 | |||
Conservative hold | Swing | ||||
Party | Candidate | Votes | % | ±% | |
---|---|---|---|---|---|
Conservative | Larry Krause | 485 | 62.4 | −5.0 | |
Green | Geoffery Meaden | 220 | 28.3 | −4.3 | |
Labour | Noyo Rai | 72 | 9.3 | New | |
Majority | |||||
Turnout | 798 | 34.7 | |||
Conservative hold | Swing | ||||
Party | Candidate | Votes | % | ||
---|---|---|---|---|---|
Conservative | Andrew Buchanan | 459 | 34.3 | ||
Labour | Euan Anckorn | 454 | 33.9 | ||
Conservative | Graham Galpin | 453 | 33.8 | ||
Green | Peter Morgan | 380 | 28.4 | ||
Liberal Democrats | Andrew Graham | 244 | 18.2 | ||
UKIP | Susannah Burden | 184 | 13.7 | ||
UKIP | Eddy Barrows | 170 | 12.7 | ||
Majority | |||||
Turnout | 1,345 | 29.8 | |||
Conservative win (new seat) | |||||
Labour win (new seat) |
Party | Candidate | Votes | % | ||
---|---|---|---|---|---|
Ashford Ind. | Winston Michael | 586 | 82.8 | ||
Conservative | James Ransley | 67 | 9.5 | ||
Labour | Jane Carling | 55 | 7.8 | ||
Majority | |||||
Turnout | 711 | 38.0 | |||
Ashford Ind. win (new seat) |
Party | Candidate | Votes | % | ±% | |
---|---|---|---|---|---|
Conservative | Peter Feacey | 331 | 55.5 | +14.0 | |
Green | Chris Squire | 148 | 24.8 | +15.1 | |
Labour | Kaprasad Chhantyal | 117 | 19.6 | +3.1 | |
Majority | |||||
Turnout | 609 | 31.4 | |||
Conservative hold | Swing | ||||
Party | Candidate | Votes | % | ±% | |
---|---|---|---|---|---|
Conservative | Gerald White | 290 | 41.1 | −3.2 | |
Ashford Ind. | Barry Ball | 201 | 28.5 | −0.7 | |
Green | Emma Nash | 132 | 18.7 | +8.6 | |
Liberal Democrats | Clare Hardwick | 82 | 11.6 | New | |
Majority | |||||
Turnout | 714 | 35.1 | |||
Conservative hold | Swing | ||||
Party | Candidate | Votes | % | ±% | |
---|---|---|---|---|---|
Conservative | Mick Burgess | Unopposed | |||
Majority | |||||
Turnout | – | – | – | ||
Conservative hold | Swing | ||||
Party | Candidate | Votes | % | ±% | |
---|---|---|---|---|---|
Conservative | Nathan Iliffe | 553 | 62.0 | ||
Ashford Ind. | Ian Anderson | 266 | 29.8 | ||
Liberal Democrats | Stuart Dove | 73 | 8.2 | ||
Majority | |||||
Turnout | 895 | 50.5 | |||
Conservative hold | Swing | ||||
Party | Candidate | Votes | % | ||
---|---|---|---|---|---|
Ashford Ind. | Tina Heyes | 360 | 69.1 | ||
Conservative | David Robey | 161 | 30.9 | ||
Majority | |||||
Turnout | 528 | 29.2 | |||
Ashford Ind. win (new seat) |
Party | Candidate | Votes | % | ||
---|---|---|---|---|---|
Conservative | Paul Bartlett | Unopposed | |||
Majority | |||||
Turnout | – | – | |||
Conservative win (new seat) |
Party | Candidate | Votes | % | ±% | |
---|---|---|---|---|---|
Conservative | Jenny Webb | 205 | 34.2 | ||
Labour | Dylan Jones | 187 | 31.2 | ||
UKIP | Neil Burgess | 130 | 21.7 | ||
Green | Al Arnold | 78 | 13.0 | ||
Majority | |||||
Turnout | 602 | 30.0 | |||
Conservative hold | Swing | ||||
Party | Candidate | Votes | % | ±% | |
---|---|---|---|---|---|
Conservative | Jo Gideon | 300 | 61.5 | ||
Labour | Kate Leavey | 97 | 19.9 | ||
Liberal Democrats | Theresa Dickens | 91 | 18.6 | ||
Majority | |||||
Turnout | 501 | 27.2 | |||
Conservative hold | Swing | ||||
Party | Candidate | Votes | % | ±% | |
---|---|---|---|---|---|
Conservative | James Wedgbury | 291 | 61.1 | ||
Labour | Amy Mitchell | 103 | 21.6 | ||
Liberal Democrats | Christopher Grayling | 82 | 17.2 | ||
Majority | |||||
Turnout | 490 | 26.2 | |||
Conservative hold | Swing | ||||
Party | Candidate | Votes | % | ||
---|---|---|---|---|---|
Conservative | Matthew Forest | 411 | 55.8 | ||
Conservative | Bernard Heyes | 345 | 46.8 | ||
Labour | Patric Nutton | 223 | 30.3 | ||
Green | Dave Higgins | 220 | 29.9 | ||
Liberal Democrats | Alexander Coxall | 133 | 18.0 | ||
Majority | |||||
Turnout | 755 | 25.4 | |||
Conservative win (new seat) | |||||
Conservative win (new seat) |
Party | Candidate | Votes | % | ±% | |
---|---|---|---|---|---|
Independent | Kate Walder | 556 | 61.2 | ||
Conservative | Mike Bennett | 352 | 38.8 | ||
Majority | |||||
Turnout | 920 | 46.8 | |||
Independent gain from Conservative | Swing | ||||
Party | Candidate | Votes | % | ||
---|---|---|---|---|---|
Ashford Ind. | Heather Hayward | 366 | 59.1 | ||
Conservative | Callum Furner | 193 | 31.2 | ||
Labour | Waheed Qureshi | 60 | 9.7 | ||
Majority | |||||
Turnout | 627 | 29.2 | |||
Ashford Ind. win (new seat) |
Party | Candidate | Votes | % | ±% | |
---|---|---|---|---|---|
Ashford Ind. | Linda Harman | 528 | 56.3 | ||
Conservative | Jane Martin | 410 | 43.7 | ||
Majority | |||||
Turnout | 943 | 46.2 | |||
Ashford Ind. gain from Conservative | Swing | ||||
Party | Candidate | Votes | % | ||
---|---|---|---|---|---|
Conservative | Bill Barrett | 202 | 42.3 | ||
Labour | Dhan Limbu | 134 | 28.1 | ||
Green | Claire Wallington | 92 | 19.3 | ||
Liberal Democrats | Nicholas Mengham | 49 | 10.3 | ||
Majority | |||||
Turnout | 493 | 26.9 | |||
Conservative win (new seat) |
Party | Candidate | Votes | % | ||
---|---|---|---|---|---|
Conservative | Kalysha Howard-Smith | 189 | 42.2 | ||
Labour | Sally Gathern | 168 | 37.5 | ||
Liberal Democrats | Ken Standish | 91 | 20.3 | ||
Majority | |||||
Turnout | 470 | 23.8 | |||
Conservative win (new seat) |
Party | Candidate | Votes | % | ±% | |
---|---|---|---|---|---|
Labour | Brandan Chilton | 257 | 67.1 | ||
Conservative | Brad Bradford | 70 | 18.3 | ||
Green | Thom Pizzey | 56 | 14.6 | ||
Majority | |||||
Turnout | 394 | 20.3 | |||
Labour hold | Swing | ||||
Party | Candidate | Votes | % | ±% | |
---|---|---|---|---|---|
Conservative | Paul Clokie | 535 | 72.5 | ||
Labour | David Ward | 203 | 27.5 | ||
Majority | |||||
Turnout | 777 | 40.2 | |||
Conservative hold | Swing | ||||
Party | Candidate | Votes | % | ±% | |
---|---|---|---|---|---|
Conservative | Callum Knowles | Unopposed | |||
Majority | |||||
Turnout | – | – | – | ||
Conservative hold | Swing | ||||
Party | Candidate | Votes | % | ||
---|---|---|---|---|---|
Conservative | John Link | Unopposed | |||
Majority | |||||
Turnout | – | – | |||
Conservative win (new seat) |
Party | Candidate | Votes | % | ||
---|---|---|---|---|---|
Conservative | Clair Bell | Unopposed | |||
Majority | |||||
Turnout | – | – | |||
Conservative win (new seat) |
Party | Candidate | Votes | % | ±% | |
---|---|---|---|---|---|
Labour | Dara Farrell | 484 | 38.6 | ||
Labour | Charles Suddards | 378 | 30.1 | ||
Conservative | Jeremy Adby | 290 | 23.1 | ||
Green | Jonathan Small | 278 | 22.2 | ||
Liberal Democrats | Charlotte Mbali | 274 | 21.9 | ||
Conservative | Matthew Bridger | 248 | 19.8 | ||
UKIP | Peter Stewart | 186 | 14.8 | ||
UKIP | Ann Taylor | 193 | 15.4 | ||
Majority | |||||
Turnout | 1,259 | 28.8 | |||
Labour hold | Swing | ||||
Labour gain from Conservative | Swing | ||||
Party | Candidate | Votes | % | ±% | |
---|---|---|---|---|---|
Conservative | Neil Shorter | 257 | 51.5 | ||
Green | Joe Annandale | 142 | 28.5 | ||
Labour | Malcolm Wiffen | 100 | 20.0 | ||
Majority | |||||
Turnout | 512 | 24.9 | |||
Conservative hold | Swing | ||||
Party | Candidate | Votes | % | ±% | |
---|---|---|---|---|---|
Conservative | Alan Pickering | 606 | 48.6 | ||
Conservative | Jessamy Blanford | 595 | 47.7 | ||
Ashford Ind. | Sarah Dacre | 384 | 30.8 | ||
Ashford Ind. | Matthew Peach | 371 | 29.7 | ||
Green | Hannah Laws | 250 | 20.0 | ||
Labour | Katie Homewood | 72 | 5.8 | ||
Labour | Vivien Wheatley | 62 | 5.0 | ||
Majority | |||||
Turnout | 1,266 | 38.4 | |||
Conservative hold | Swing | ||||
Party | Candidate | Votes | % | ±% | |
---|---|---|---|---|---|
Conservative | Ken Mulholland | 439 | 47.6 | ||
Green | Hilary Jones | 266 | 28.9 | ||
UKIP | Gary Hanson | 217 | 23.5 | ||
Majority | |||||
Turnout | 931 | 47.6 | |||
Conservative hold | Swing | ||||
Party | Candidate | Votes | % | ±% | |
---|---|---|---|---|---|
Ashford Ind. | David Ledger | 941 | 58.4 | ||
Ashford Ind. | George Sparks | 818 | 50.8 | ||
Conservative | Aline Hicks | 715 | 44.4 | ||
Conservative | Charles Dehnel | 567 | 35.2 | ||
Majority | |||||
Turnout | 1,638 | 38.9 | |||
Ashford Ind. gain from Conservative | Swing | ||||
Party | Candidate | Votes | % | |
---|---|---|---|---|
Green | Steven Campkin | 714 | 44.6 | |
Green | Liz Wright | 629 | 39.3 | |
Conservative | Belinda Naiken-Payne | 433 | 27.0 | |
Liberal Democrats | Matthew Baker | 426 | 26.6 | |
Conservative | Carole White | 401 | 25.0 | |
Liberal Democrats | Adrian Gee-Turner | 301 | 18.8 | |
Labour | Elizampeth Mylonogianni | 175 | 10.9 | |
Majority | ||||
Turnout | 1,638 | 35.8 | ||
Green gain from Liberal Democrats | ||||
Green gain from Conservative | ||||
Party | Candidate | Votes | % | ||
---|---|---|---|---|---|
Ashford Ind. | Noel Ovenden | 671 | 81.2 | ||
Conservative | Aidan Wedgbury | 84 | 10.2 | ||
Liberal Democrats | David Browne | 71 | 8.6 | ||
Majority | |||||
Turnout | 831 | 43.6 | |||
Ashford Ind. win (new seat) |
Party | Candidate | Votes | % | ±% | |
---|---|---|---|---|---|
Conservative | Charles Dehnel | 229 | 37.4 | –10.0 | |
Green | Geoff Meaden | 190 | 31.0 | +7.5 | |
Liberal Democrats | Adrian Gee-Turner | 70 | 11.4 | –7.3 | |
Ashford Ind. | Rachael Carley | 67 | 10.9 | N/A | |
UKIP | Philip Meads | 22 | 3.6 | N/A | |
Labour | Carly Ruppert Lingham | 17 | 2.8 | –7.6 | |
Independent | Sarah Williams | 17 | 2.8 | N/A | |
Majority | 39 | 6.4 | |||
Turnout | 645 | 31.5 | |||
Registered electors | 2,046 | ||||
Conservative hold | Swing | 8.8 | |||
Party | Candidate | Votes | % | ±% | |
---|---|---|---|---|---|
Ashford Ind. | Trish Cornish | 247 | 60.2 | N/A | |
Conservative | Aline Hicks | 115 | 28.0 | –33.5 | |
Labour | Garry Harrison | 29 | 7.1 | –12.8 | |
Green | Thom Pizzey | 11 | 2.7 | N/A | |
Liberal Democrats | Samuel Strolz | 8 | 2.0 | –16.6 | |
Majority | 132 | 32.2 | |||
Turnout | 410 | 22.1 | |||
Registered electors | 1,859 | ||||
Ashford Ind. gain from Conservative | Swing | N/A | |||
Party | Candidate | Votes | % | ±% | |
---|---|---|---|---|---|
Conservative | Trevor Brooks | 468 | 42.2 | +23.0 | |
Labour | Dylan Jones | 402 | 36.2 | −2.6 | |
Independent | Garry Harrison | 105 | 9.5 | N/A | |
Green | Thom Pizzey | 70 | 6.3 | −12.8 | |
Liberal Democrats | Jacqueline Stamp | 64 | 5.8 | N/A | |
Majority | 66 | 6.0 | |||
Turnout | 1,109 | ||||
Conservative gain from Labour | Swing | 12.8 | |||
Party | Candidate | Votes | % | ±% | |
---|---|---|---|---|---|
Green | Geoff Meaden | 273 | 51.8 | +28.3 | |
Conservative | Sarah Williams | 239 | 45.4 | −2.1 | |
Liberal Democrats | Carol Wilcox | 15 | 2.8 | −15.9 | |
Majority | 34 | 6.6 | |||
Turnout | 527 | ||||
Green gain from Conservative | Swing | 15.2 | |||
Party | Candidate | Votes | % | ±% | |
---|---|---|---|---|---|
Green | Dawnie Nilsson | 191 | 40.0 | +21.2 | |
Conservative | James Ransley | 163 | 34.1 | −7.0 | |
Ashford Ind. | Barry Ball | 101 | 21.1 | −7.4 | |
Labour | Terry Pavlou | 23 | 4.8 | N/A | |
Majority | 28 | 5.9 | |||
Turnout | 478 | 23.6 | |||
Green gain from Conservative | Swing | 14.1 | |||
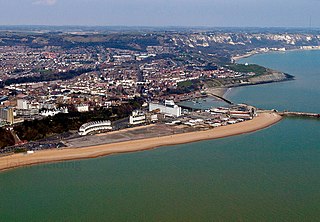
Folkestone and Hythe is a local government district in Kent, England. It lies in the south-east of the county, on the coast of the English Channel. The district was formed in 1974 and was originally named Shepway after one of the ancient lathes of Kent, which had covered a similar area. The district was renamed in 2018. The council is based in Folkestone, the district's largest town. The district also includes the towns of Hawkinge, Hythe, Lydd and New Romney, along with numerous villages and surrounding rural areas.
Spelthorne is a local government district with borough status in Surrey, England. Its council is based in Staines-upon-Thames; other settlements in the area include Ashford, Sunbury-on-Thames, Shepperton, Stanwell and Laleham. It is named after the medieval Spelthorne Hundred which had covered the area.
Rother is a local government district in East Sussex, England. Its council is based in Bexhill-on-Sea. The district is named after the River Rother which flows within its boundaries.
The Borough of Ashford is a local government district with borough status in Kent, England. It is named after its largest town, Ashford, where the council is based. The borough also includes the town of Tenterden and an extensive surrounding rural area including numerous villages; with an area of 580 square kilometres (220 sq mi), it is the largest district in Kent. Parts of the borough lie within the designated Areas of Outstanding Natural Beauty of High Weald and the Kent Downs.
Ashford is a constituency in Kent created in 1885 and represented in the House of Commons of the UK Parliament since 2024 by Sojan Joseph of the Labour Party.
Kennington is a suburb of Ashford and civil parish in Kent, England. It is about a mile northeast of the town centre and north of the M20 motorway, and contains the 12th-century church, St Mary's. The main A28 Canterbury Road and A2042 Faversham Road run through the village, and the A251 Trinity Road skirts the western edge. In recent years the village has expanded with the building of new housing estates in Little Burton, Trinity Road, Conningbrook Lakes, and planned for Conningbrook Park and Eureka Park.
Ashford Borough Council is the local authority for the Borough of Ashford in Kent, England. The council is elected every four years. Since the last boundary changes in 2019, 47 councillors have been elected from 39 wards.
Harriet Bronwen Yeo is a British trade unionist, a former Treasurer and President of Transport Salaried Staffs' Association (TSSA), and a UK Independence Party (UKIP) politician who stood unsuccessfully for parliament in Folkestone and Hythe at the 2015 general election.
The 1999 Ashford Borough Council election took place on 6 May 1999 to elect members of Ashford Borough Council in Kent, England. The whole council was up for election and the council stayed under no overall control.
Elections to Ashford Borough Council were held on 1 May 2003. The whole council was up for election with boundary changes since the last election in 1999 reducing the number of seats by 6. The Conservative Party gained control of the council from no overall control.
Elections to Ashford Borough Council were held on 3 May 2007. The whole council was up for election and the Conservative Party held on to overall control of the council.
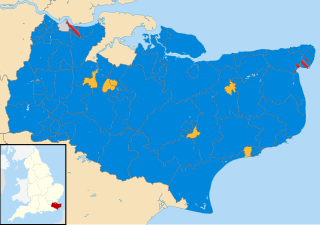
The Kent County Council election, 2009 was an election to all 84 seats on Kent County Council held on 2 May as part of the 2009 United Kingdom local elections. 84 councillors were elected from 72 electoral divisions, which returned either one or two county councillors each by first-past-the-post voting for a four-year term of office. The electoral divisions were the same as those used at the previous election in 2005. No elections were held in Medway, which is a unitary authority outside the area covered by the County Council.
Spelthorne Borough Council in Surrey, England is elected every four years. Since the last boundary changes in 2003, 39 councillors are elected from 13 wards.
The 2011 Ashford Borough Council election took place on 5 May 2011 to elect members of Ashford Borough Council in Kent, England. The whole council was up for election and the Conservative Party stayed in overall control of the council.
The Kent County Council election, 2013 was an election to all 84 seats on Kent County Council held on Thursday 2 May as part of the 2013 United Kingdom local elections. 84 councillors were elected from 72 electoral divisions, which returned either one or two county councillors each by first-past-the-post voting for a four-year term of office. The electoral divisions were the same as those used at the previous election in 2009. No elections were held in Medway, which is a unitary authority outside the area covered by the County Council. The election saw the Conservative Party narrowly retain overall control of the council.
The 2015 Ashford Borough Council election took place on 7 May 2015 to elect members of Ashford Borough Council in England. This was on the same day as other local elections.
The United Kingdom's component of the 2019 European Parliament election was held on Thursday 23 May 2019 and the local results were to be announced after 22:00 BST on Sunday 26 May 2019 when all the other EU countries had voted although the counting of votes started at 18:00 BST on that evening. The nine English regions and Wales announced their regional results overnight. Local results were also announced overnight in all Scottish council areas with the single exception of Na h-Eileanan Siar, which did not count their votes until the following morning due to local opposition to counting on the Sabbath. Thus the Scottish national declaration did not take place until around lunchtime on Monday 27 May. Northern Ireland also did not start to count their votes until the Monday morning as votes are by tradition not counted here on Sunday either, as a religious observance. Furthermore, due to the use of the single transferable vote (STV), it was expected that counting could take up to two days, but in the event it was completed on 27 May.
The 2023 Ashford Borough Council election took place on 4 May 2023 to elect members of Ashford Borough Council in Kent, England. This was on the same day as other local elections in England.
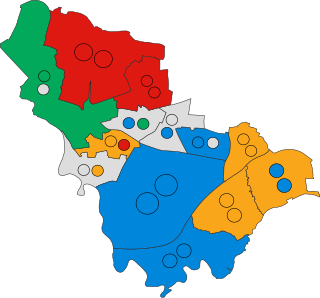
The 2023 Spelthorne Borough Council election took place on 4 May 2023 to elect members of Spelthorne Borough Council in Surrey, England. This was on the same day as other local elections across England.
The Ashford Independents are a local political party based in Ashford, Kent. The group was founded in 2003.