2019 Central Bedfordshire Council election

Last updated

2019 Central Bedfordshire Council election
Bedfordshire County Flag.svg
  2015 2 May 2019 (2019-05-02) 2023  

All 59 seats to Central Bedfordshire Council
30 seats needed for a majority
 First partySecond partyThird party
  No image wide.svg No image wide.svg No image wide.svg
Leader James Jamieson
Party Conservative Independent Liberal Democrats
Last election53 seats, 53.8%3 seats, 10.4%1 seat, 5.1%
Seats won41133
Seat changeDecrease2.svg 12Increase2.svg 10Increase2.svg 2
Popular vote61,37525,91313,745
Percentage43.3%18.3%9.7%
SwingDecrease2.svg 10.0%Increase2.svg 7.9%Increase2.svg 4.6%

 Fourth partyFifth party
  No image wide.svg No image wide.svg
Party Labour UKIP
Last election2 seats, 16.8%0 seats, 8.2%
Seats won11
Seat changeDecrease2.svg 1Increase2.svg 1
Popular vote28,1077,596
Percentage19.8%5.4%
SwingDecrease2.svg 2.5%Decrease2.svg 2.8%

Central Bedfordshire UK ward map 2019.svg
Winner of each seat at the 2019 Central Bedfordshire Council election

Council control before election


Conservative

Council control after election


Conservative

Elections to Central Bedfordshire Council were held on 2 May 2019, along with other local elections. [1] The whole council was up for election, with each successful candidate serving a four-year term of office, expiring in 2023.

Contents

Summary

Election result

2019 Central Bedfordshire Council election
PartyCandidatesSeatsGainsLossesNet gain/lossSeats %Votes %Votes+/−
  Conservative 5841012Decrease2.svg 1269.543.361,375–10.0
  Independent 2413100Increase2.svg 1022.018.325,913+7.9
  Liberal Democrats 28320Increase2.svg 25.19.713,745+4.6
  Labour 59101Decrease2.svg 11.719.828,107+2.5
  UKIP 18110Increase2.svg 11.75.47,596–2.8
  Green 9000Steady2.svg0.03.24,540–2.5
  Women's Equality 1000Steady2.svg0.00.2274N/A
  Renew 1000Steady2.svg0.00.2241N/A

Ward results

Ampthill

Ampthill
PartyCandidateVotes%±%
Independent Mark Smith 2,135 54.7
Conservative Michael Blair 1,595 40.9
Conservative Paul Duckett 1,564 40.1
Conservative Stephen Addy1,54239.5
Green Susan Clinch1,19330.6
Liberal Democrats Catherine Brown96724.8New
Labour Valerie Quinn44911.5
Labour Louise Chinnery3739.6
Labour Carmen Williams2636.7
Turnout 3,93038.3
Independent gain from Conservative
Conservative hold
Conservative hold

Arlesey

Arlesey
PartyCandidateVotes%±%
Conservative Ian Dalgarno 1,899 54.9
Conservative David Shelvey 1,858 53.7
Conservative Richard Wenham 1,799 52.0
Green Tom Hoeksma1,00229.0New
Labour Kevin O'Daly94227.2
Labour Douglas Landman88425.6
Labour Daniel Riley76722.2
Turnout 3,54129.9
Conservative hold
Conservative hold
Conservative hold

No UKIP (-20.7) or Independent (-16.4) candidates as previous.

Aspley and Woburn

Aspley and Woburn
PartyCandidateVotes%±%
Independent John Baker 1,686 78.5 New
Conservative Christopher Wells37117.3-55.9
Labour Susan Morris904.2New
Majority
Turnout 2,15257.4
Independent gain from Conservative Swing

No Green candidate as previous (-26.8).

Barton-le-Clay

Barton-le-Clay
PartyCandidateVotes%±%
Independent Ian Shingler 1,155 68.6 +17.5
Conservative Joseph Irwin25315.0-10.6
Liberal Democrats Jonathan Paxton19711.7-2.3
Labour Karl Bruckdorfer784.6-4.7
Majority
Turnout 1,68742.5
Independent hold Swing

Biggleswade North

Biggleswade North
PartyCandidateVotes%±%
Conservative Steven Watkins 1,161 57.1
Conservative Ian Bond 1,098 54.0
Labour Sarah Doyle78338.5
Labour Fiona Factor73836.3
Turnout 2,10329.0
Conservative hold
Conservative hold

No UKIP (-23.6) or Green (-11.0) candidates as previous.

Biggleswade South

Biggleswade South
PartyCandidateVotes%±%
Conservative Mark Foster 1,180 39.8
Independent Hayley Whitaker 1,072 36.1 New
Conservative Michael North96932.7
Labour Georgina Gale60220.3
Labour Julian Vaughan58819.8
Independent Timothy Woodward57719.5
UKIP Duncan Strachan43314.6
Turnout 2,98134.4
Conservative hold
Independent gain from Conservative

No Independent (-12.1) or Green (-10.0) candidates as previous.

Caddington

Caddington
PartyCandidateVotes%±%
Conservative Kevin Collins 1,418 48.5
Conservative Edward Perry 1,256 43.0
Independent John Waller1,04135.6New
Labour Shirley Smith55118.9
Labour Ian Lowery44515.2
Turnout 2,95537.0
Conservative hold
Conservative hold

No Independent (-22.4) or Green (-9.1) candidates as previous.

Cranfield and Marston Moretaine

Cranfield and Marston Moretaine
PartyCandidateVotes%±%
Conservative Susan Clark 1,508 45.3
Conservative Kenneth Matthews 1,285 38.6
Conservative Robert Morris 1,183 35.5
Independent John Guinn1,04231.3New
Green Alison Parker77223.2
UKIP Roger Baker69520.9
Labour Elizabeth Rooney63018.9
Labour Michelle White50715.2
Labour Karl O'Dell43513.1
Renew Alan Victor2417.2New
Turnout 3,34030.7
Conservative hold
Conservative hold
Conservative hold

Dunstable Central

Dunstable Central
PartyCandidateVotes%±%
Conservative Carole Hegley 573 54.5 +1.8
Labour Russell McCulloch29027.6-3.0
Liberal Democrats David Jones18817.9New
Majority
Turnout 1,08829.5
Conservative hold Swing

No Independent candidate as previous (-16.7).

Dunstable Icknield

Dunstable Icknield
PartyCandidateVotes%±%
Conservative John Chatterley 641 35.3
Conservative David McVicar 599 33.0
Independent Kayson Gurney59332.7
Independent Kenson Gurney51628.4
Labour Catherine Howes44224.4
Labour Michael Rogers37820.8
Liberal Democrats Susan Thorne1458.0
Liberal Democrats Richard Hunt1427.8
Turnout 1,83729.0
Conservative hold
Conservative hold

Dunstable Manshead

Dunstable Manshead
PartyCandidateVotes%±%
Conservative Philip Crawley 436 38.9
Labour Louise O'Riordan33730.0
UKIP Robert Brown18916.8
Liberal Democrats Patricia Larkman16014.3
Majority
Turnout 1,13127.3
Conservative hold Swing

Dunstable Northfields

Dunstable Northfields
PartyCandidateVotes%±%
Conservative Johnson Tamara 689 37.9
Conservative Gladys Sanders 655 36.0
Labour Kevin Flint60733.4
Labour Julian Mockridge60633.3
UKIP Martin Young35419.5
Liberal Democrats Elaine Morgan23212.7
Liberal Democrats Lynda Walmsley21812.0
Turnout 1,83524.3
Conservative hold
Conservative hold

Dunstable Watling

Dunstable Watling
PartyCandidateVotes%±%
Conservative Eugene Ghent 1,304 56.3
Conservative John Young 1,295 55.9
Labour Roger Pepworth47720.6
Labour Trudi Kleanthous47120.3
UKIP Steven Ashby38816.8
Liberal Democrats Ian Witherick29712.8
Turnout 2,34331.2
Conservative hold
Conservative hold

Eaton Bray

Eaton Bray
PartyCandidateVotes%±%
Conservative Philip Spicer 786 68.8
Green Andrew Waters26523.2
Labour Marc Windmill918.0
Majority
Turnout 1,17234.8
Conservative hold Swing

Flitwick

Flitwick
PartyCandidateVotes%±%
Conservative Neil Bunyan 1,466 41.1
Independent Gareth Mackey 1,397 39.2
Conservative Charles Gomm 1,187 33.3
Conservative Catherine Chapman1,12031.4
UKIP Russell Shaw61517.2
Labour Cathrine Jones60316.9
Labour Tania Malkani56615.9
Liberal Democrats Jack Moore55115.5
Labour Dan Toinko54315.2
Liberal Democrats Richard Kennedy52914.8
Liberal Democrats John White48813.7
Turnout 3,58834.0
Conservative hold
Independent gain from Conservative
Conservative hold

Heath and Reach

Heath and Reach
PartyCandidateVotes%±%
Conservative Mark Versallion 1,018 75.2
Green Dominic Scholfield20515.1
Labour Susan Wellstood-Eason1319.7
Majority
Turnout 1,37340.1
Conservative hold Swing

Houghton Conquest and Haynes

Houghton Conquest and Haynes
PartyCandidateVotes%±%
Independent Rebecca Hares 383 42.0
Conservative Martin Hawkins31134.1
Independent Richard James11112.2
Labour David Short10711.7
Majority
Turnout 91739.2
Independent gain from Conservative Swing

Houghton Hall

Houghton Hall
PartyCandidateVotes%±%
Liberal Democrats Susan Goodchild 825 50.3
Liberal Democrats Yvonne Farrell 630 38.4
Labour Jack Butler33420.4
UKIP Joe Angell32119.6
Conservative John Kane28917.6
Labour Ian Purvis27716.9
Independent James Carroll21012.8
Turnout 1,64725.5
Liberal Democrats hold
Liberal Democrats gain from Conservative

Leighton Buzzard North

Leighton Buzzard North
PartyCandidateVotes%±%
Conservative Brian Spurr 1,341 39.4
Conservative Kenneth Ferguson 1,294 38.1
Conservative Ewan Wallace 1,135 33.4
Labour Michael Bishop84324.8
Labour Daniel Scott74421.9
Labour Christie Melon68920.3
Liberal Democrats Christopher Feander63318.6
Liberal Democrats Anne Gray61918.2
Liberal Democrats Rosalind Mennie57817.0
UKIP Andrew Dore46213.6
UKIP Caroline Redwood46113.6
UKIP Michael Woodhouse39911.7
Women's Equality Nanci Hogan2748.1
Turnout 3,43130.0
Conservative hold
Conservative hold
Conservative hold

Leighton Buzzard South

Leighton Buzzard South
PartyCandidateVotes%±%
Conservative Amanda Dodwell 1,445 47.9
Conservative Raymond Berry 1,279 42.4
Conservative David Bowater 1,276 42.3
Labour Adrian Heffernan67422.3
Labour Christopher Northedge62420.7
Labour Robert Connelly62220.6
Liberal Democrats Anne Guess56618.8
Liberal Democrats Christopher Leaman48416.0
Liberal Democrats John Hewitt48216.0
UKIP Frank Lelliott36712.2
UKIP Antonio Vitiello34411.4
UKIP Steven Wildman32210.7
Turnout 3,03529.0
Conservative hold
Conservative hold
Conservative hold

Linslade

Linslade
PartyCandidateVotes%±%
Independent Victoria Harvey 1,347 35.9
Conservative Gordon Perham 1,222 32.6
Liberal Democrats Peter Snelling 1,139 30.3
Conservative Stephen Jones1,07628.7
Conservative Anthony Morris1,01327.0
Liberal Democrats Russell Goodchild91124.3
Liberal Democrats Nigel Carnell87423.3
Independent Susan James77920.8
Labour Christine Sheppard66517.7
Labour Jane Woodman56014.9
Independent Roy Walker44711.9
Labour Isaac Sibiya42611.3
Turnout 3,79141.4
Independent gain from Conservative
Conservative hold
Liberal Democrats gain from Conservative

Northill

Northill
PartyCandidateVotes%±%
Conservative Frank Firth 972 79.0
Labour Andrew Harland25921.0
Majority
Turnout 1,26636.0
Conservative hold Swing

Parkside

Parkside
PartyCandidateVotes%±%
Labour Antonia Ryan 251 28.4
Independent Janet Cooper19622.1
UKIP Angela White19021.5
Conservative Alan Corkhill13615.4
Liberal Democrats Ray Morgan859.6
Green Gillian Patrick273.1
Majority
Turnout 89225.2
Labour hold Swing

Potton

Potton
PartyCandidateVotes%±%
Independent Adam Zerny 2,729 85.8
Independent Tracey Wye 2,151 67.6
Conservative Doreen Gurney44013.8
Conservative Grant Fage37511.8
Labour Daniel Cherry1665.2
Labour Wendy Bater1023.2
Turnout 3,19250.1
Independent hold
Independent gain from Conservative

Sandy

Sandy
PartyCandidateVotes%±%
Independent Simon Ford 2,152 58.9
Conservative Caroline Maudlin 1,150 31.5
Conservative Tracey Stock 1,048 28.7
Liberal Democrats Peter Aldis99627.3
Conservative Peter Smith86023.5
Green Kenneth Lynch71119.5
Liberal Democrats Kevin Backhouse47813.1
Labour Alexandra Morris3178.7
Labour Richard Peters2807.7
Liberal Democrats Ben Gutteridge2717.4
Labour Orhan Tuncay2125.8
Turnout 3,66637.2
Independent gain from Conservative
Conservative hold
Conservative hold

Shefford

Shefford
PartyCandidateVotes%±%
Conservative Anthony Brown 1,374 65.7
Conservative Mark Liddard 1,368 65.4
Labour Glenda Tizard64330.7
Labour Sheila Woods52225.0
Turnout 2,19229.0
Conservative hold
Conservative hold

Silsoe and Shillington

Silsoe and Shillington
PartyCandidateVotes%±%
Independent Alison Graham 1,192 70.6
Conservative Blake Stephenson38422.7
Labour Sheila Gardner1126.6
Majority
Turnout 1,69539.8
Independent hold Swing

Stotfold and Langford

Stotfold and Langford
PartyCandidateVotes%±%
Conservative Alan Saunders 1,874 52.2
Conservative Steven Dixon 1,753 48.8
Conservative Nicola Harris 1,636 45.6
Labour Helen Wightwick1,04429.1
Labour Nicholas Andrews99827.8
Labour Matthew Brennan80922.5
UKIP Paul Francis77521.6
UKIP Binanti Cuzner63017.6
Turnout 3,64431.6
Conservative hold
Conservative hold
Conservative hold

Tithe Farm

Tithe Farm
PartyCandidateVotes%±%
UKIP Patrick Hamill 293 33.1
Labour Martin Kennedy23226.2
Independent Tracey McMahon15617.6
Conservative David Abbott12213.8
Liberal Democrats Kenneth Wattingham606.8
Green Catherine Aganoglu222.5
Majority
Turnout 90128.0
UKIP gain from Labour Swing

Toddington

Toddington
PartyCandidateVotes%±%
Independent Silvia Amantea-Collins 1,557 51.9
Independent Mary Walsh 1,289 43.0
Conservative Thomas Nicols80626.9
Conservative Gary Tubb58319.4
Labour Rhiannon Meades45915.3
Labour Barry James36812.3
UKIP Richard Roe33811.3
Turnout 3,01340.2
Independent gain from Conservative

Westoning, Flitton and Greenfield

Westoning, Flitton and Greenfield
PartyCandidateVotes%±%
Conservative James Jamieson 1,105 71.3
Green Richard Ellis34322.1
Labour Rachel Garnham1016.5
Majority
Turnout 1,56842.8
Conservative hold Swing

Related Research Articles

<span class="mw-page-title-main">2013 Norfolk County Council election</span>

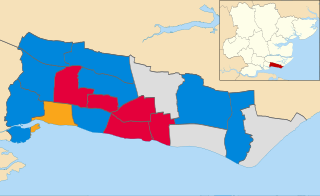
The Norfolk County Council election took place across Norfolk on 2 May 2013, coinciding with local elections for all county councils in England. The results were announced the following day, Friday 3 May 2013. The result brought to an end 12 years of Conservative administration, who finished three seats short of a majority after losing 20 seats, leaving the Council in no overall control (NOC). UKIP and the Labour Party both made gains of 14 and 11 seats respectively. The Liberal Democrats and the Green Party both lost three seats each, whilst an independent won a single seat in North Norfolk.

<span class="mw-page-title-main">2015 Hyndburn Borough Council election</span> 2015 UK local government election

A by-thirds Hyndburn Borough Council local election took place on 7 May 2015. Approximately one third of the second tier council's 35 seats fell up for election, and the General Election was held on the same day.

Elections for Boston Borough Council, which governs as a second-tier authority the Borough of Boston were held on Thursday 7 May 2015. Following Boundary Commission changes between this election and the previous in 2011 to the wards, 30 councillors were elected to serve 15 wards. The election was held on the same day as other local elections.

The 2015 Colchester Borough Council election took place on 7 May 2015 to elect one third of the members of Colchester Borough Council in England. This was the same day as other local elections and as the General Election. Colchester Borough Council is made up of 60 councillors: 20 councillors were up for election.

<span class="mw-page-title-main">2016 England and Wales police and crime commissioner elections</span>

Elections of police and crime commissioners in England and Wales were held on 5 May 2016.

<span class="mw-page-title-main">2017 Hampshire County Council election</span>

The 2017 Hampshire County Council election took place on 4 May 2017 as part of the 2017 local elections in the United Kingdom. All councillors were elected from electoral divisions by first-past-the-post voting for a four-year term of office. The electoral divisions were somewhat changed from the previous election, with some being split, merged or with boundary changes. No elections were held in Portsmouth and Southampton, which are unitary authorities and hold their elections in other years. Similarly the districts within Hampshire did also not hold elections this year.

<span class="mw-page-title-main">2017 Surrey County Council election</span>

The 2017 Surrey County Council election took place as part of the 2017 local elections in the UK. All 81 councillors were elected for single-member electoral divisions for a four-year term. The electoral system used is first-past-the-post voting.

<span class="mw-page-title-main">2018 Colchester Borough Council election</span> 2018 UK local government election

Elections to Colchester Borough Council took place on 3 May 2018. Seventeen members of the council - one-third of the whole — were elected, one from each of the seventeen wards. It was the first standard election to take place following comprehensive boundary changes in 2016. This set of seats were last up for election in 2016, with the third-placed elected candidates being up for election in 2018.

<span class="mw-page-title-main">2017 Stoke-on-Trent Central by-election</span>

There was a by-election in the constituency of Stoke-on-Trent Central on 23 February 2017 following the resignation of Labour's Tristram Hunt, who became director of the Victoria and Albert Museum in London. It took place alongside a by-election in Copeland.

<span class="mw-page-title-main">2018 Hyndburn Borough Council election</span> 2018 UK local government election

A by-thirds Hyndburn Borough Council local election, was held on Thursday 3 May 2018. Approximately one third of the local council's 35 seats fall up for election on that day.

<span class="mw-page-title-main">2018 Thurrock Council election</span> 2018 UK local government election

The 2018 Thurrock Council elections took place on 3 May 2018 to elect members of Thurrock Council in England. Councillors in 16 out of the 20 electoral wards were to be up for election. The council remained under no overall control, with a minority Conservative administration running the council.

<span class="mw-page-title-main">2018 Calderdale Metropolitan Borough Council election</span>

The 2018 Calderdale Metropolitan Borough Council election took place on 3 May 2018 to elect members of Calderdale Metropolitan Borough Council in England. This was on the same day as other local elections. One councillor was elected in each ward for a four-year term so the councillors elected in 2018 last stood for election in 2014. Each ward is represented by three councillors, the election of which is staggered, so only one third of the councillors were elected in this election. Before the election there was no overall control with a minority Labour administration. Following the election Labour, having gained one councillor, was still two councillors away from a majority so it remained no overall control.

<span class="mw-page-title-main">2018 City of Bradford Metropolitan District Council election</span>

The 2018 City of Bradford Metropolitan District Council took place on 3 May 2018 to elect members of Bradford District Council in England. This was on the same day as other local elections. One councillor was elected in each ward for a four-year term so the councillors elected in 2018 last stood for election in 2014. Each ward is represented by three councillors, the election of which is staggered, so only one third of the councillors were elected in this election. Before the election there was a Labour majority and afterwards Labour had increased their majority.

<span class="mw-page-title-main">2018 Southend-on-Sea Borough Council election</span> 2018 UK local government election

Elections to Southend-on-Sea Borough Council took place on 3 May 2018. This was on the same day as other local elections across the United Kingdom.

<span class="mw-page-title-main">2019 Breckland District Council election</span>

The 2019 Breckland District Council election took place on 2 May 2019 to elect members of Breckland District Council in England. This was on the same day as other local elections. The boundaries for this election were the same as those used in 2015.

<span class="mw-page-title-main">2019 Southend-on-Sea Borough Council election</span> 2019 UK local government election

Elections to Southend-on-Sea Borough Council took place on 2 May 2019. This was on the same day as other local elections across the United Kingdom.

<span class="mw-page-title-main">2019 Colchester Borough Council election</span> 2019 UK local government election

Elections to Colchester Borough Council were held on 2 May 2019. Seventeen members of the council were up for election, one from each of the 17 wards.

<span class="mw-page-title-main">2021 Peterborough City Council election</span> Local election in Peterborough, England

Elections to Peterborough City Council took place on 6 May 2021. 23 of the 60 seats were contested. The election was held alongside the elections for the Cambridgeshire Police and Crime Commissioner and Mayor of Cambridgeshire and Peterborough.

<span class="mw-page-title-main">2021 Havant Borough Council election</span>

Elections to Havant Borough Council took place on 6 May 2021 as part of the 2021 United Kingdom local elections. They took place at the same time as the elections for Hampshire County Council and the Hampshire Police and Crime Commissioner.

<span class="mw-page-title-main">2022 Peterborough City Council election</span> Local election in Peterborough, England

Elections to Peterborough City Council took place on 5 May 2022. 19 of the 60 seats were contested. The election will took place alongside other local elections across the United Kingdom.

References

  1. "Central Bedfordshire election results 2019 | Central Bedfordshire Council". www.centralbedfordshire.gov.uk. Retrieved 5 August 2021.