| |||||||||||||||||||||||||||||||||||||||||||||||||||||||||||||||||||||||||||||||||||||||||
17 out of 51 seats to Colchester Borough Council 26 seats needed for a majority | |||||||||||||||||||||||||||||||||||||||||||||||||||||||||||||||||||||||||||||||||||||||||
---|---|---|---|---|---|---|---|---|---|---|---|---|---|---|---|---|---|---|---|---|---|---|---|---|---|---|---|---|---|---|---|---|---|---|---|---|---|---|---|---|---|---|---|---|---|---|---|---|---|---|---|---|---|---|---|---|---|---|---|---|---|---|---|---|---|---|---|---|---|---|---|---|---|---|---|---|---|---|---|---|---|---|---|---|---|---|---|---|---|
Turnout | 32.6% ( 0.5%) | ||||||||||||||||||||||||||||||||||||||||||||||||||||||||||||||||||||||||||||||||||||||||
| |||||||||||||||||||||||||||||||||||||||||||||||||||||||||||||||||||||||||||||||||||||||||
Results map of the Colchester Borough Council election | |||||||||||||||||||||||||||||||||||||||||||||||||||||||||||||||||||||||||||||||||||||||||
|
Elections to Colchester Borough Council were held on 2 May 2019. Seventeen members of the council (one-third of the whole) were up for election, one from each of the 17 wards. [1]
Colchester Borough Council election, 2019 | ||||||||||
---|---|---|---|---|---|---|---|---|---|---|
Party | This election | Full council | This election | |||||||
Seats | Net | Seats % | Other | Total | Total % | Votes | Votes % | +/− | ||
Conservative | 6 | 2 | 35.3 | 17 | 23 | 45.1 | 15,387 | 35.2 | 5.2 | |
Liberal Democrats | 6 | 1 | 35.3 | 7 | 13 | 25.5 | 11,638 | 26.6 | 6.7 | |
Labour | 3 | 17.6 | 8 | 11 | 21.6 | 7,740 | 17.7 | 7.6 | ||
Independent | 1 | 5.9 | 2 | 3 | 5.9 | 2,775 | 6.3 | 0.8 | ||
Green | 1 | 1 | 5.9 | 0 | 1 | 2.0 | 5,939 | 13.6 | 6.6 | |
UKIP | 0 | 0.0 | 0 | 0 | 0.0 | 248 | 0.6 | New | ||
Prior to the election, the composition of the council was:
12 | 11 | 3 | 25 |
Liberal Democrats | Labour | Ind | Conservative |
Following the election, the composition of the council was:
13 | 11 | 3 | 1 | 23 |
Liberal Democrats | Labour | Ind | G | Conservative |
The Statement of Nominated Persons was released on 4 April 2019 detailing the persons standing as candidates at the Borough Council election. [2]
Incumbent councillors are marked with an asterisk*
Party | Candidate | Votes | % | ±% | |
---|---|---|---|---|---|
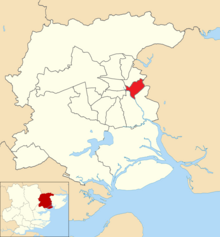
Labour Co-op | Chris Pearson* | 1,058 | 53.2 | 9.4 | |
Liberal Democrats | Mick Spindler | 490 | 24.6 | 15.9 | |
Conservative | Fabian Green | 301 | 15.1 | 9.9 | |
Green | Mary Bryan | 142 | 7.1 | 3.4 | |
Majority | 568 | 28.6 | 8.9 | ||
Turnout | 2,016 | 27.4 | 0.1 | ||
Registered electors | 7,367 | ||||
Labour Co-op hold | Swing | 12.7 | |||
Party | Candidate | Votes | % | ±% | |
---|---|---|---|---|---|
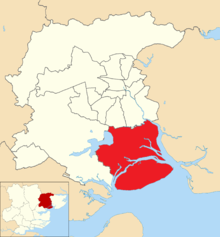
Green | Mark Goacher | 1,724 | 55.9 | 25.6 | |
Conservative | Darius Laws* | 901 | 29.2 | 1.5 | |
Labour | Victoria Weaver | 268 | 8.7 | 16.0 | |
Liberal Democrats | Verity Wooley | 193 | 6.3 | 8.0 | |
Majority | 823 | 26.7 | — | ||
Turnout | 3,111 | 40.5 | 0.7 | ||
Registered electors | 7,674 | ||||
Green gain from Conservative | Swing | 13.6 | |||
Party | Candidate | Votes | % | ±% | |
---|---|---|---|---|---|
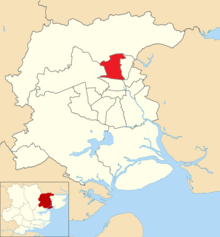
Labour | Tim Young* | 971 | 47.7 | 3.8 | |
Conservative | Christopher Piggott | 388 | 19.0 | 5.0 | |
Liberal Democrats | Chantelle-Louise Whyborn | 281 | 13.8 | 2.1 | |
Independent | Christopher Lee | 228 | 11.2 | 1.5 | |
Green | John Clifton | 169 | 8.3 | 5.1 | |
Majority | 583 | 28.7 | |||
Turnout | 2,067 | 20.4 | 4.0 | ||
Registered electors | 10,148 | ||||
Labour hold | Swing | 0.6 | |||
Party | Candidate | Votes | % | ±% | |
---|---|---|---|---|---|
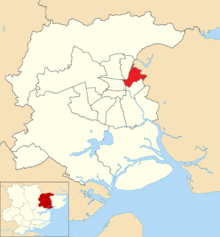
Independent | Beverly Oxford* | 1,119 | 52.6 | 7.2 | |
Conservative | Stephen Rowe | 409 | 19.3 | 8.3 | |
Labour | Jocelyn Law | 247 | 11.6 | 3.8 | |
Liberal Democrats | Mick Turrell | 196 | 9.2 | 1.3 | |
Green | Robbie Spence | 155 | 7.3 | 3.6 | |
Majority | 710 | 33.3 | — | ||
Turnout | 2,126 | 29.4 | 1.8 | ||
Registered electors | 7,273 | ||||
Independent hold | Swing | 7.8 | |||
Party | Candidate | Votes | % | ±% | |
---|---|---|---|---|---|
Conservative | Lewis Barber* | 1,745 | 62.3 | 3.9 | |
Liberal Democrats | Thomas Stevenson | 442 | 15.8 | 0.9 | |
Green | Roger Bamforth | 403 | 14.5 | 7.9 | |
Labour | Conrad Winch | 209 | 7.5 | 4.8 | |
Majority | 1,303 | 46.5 | — | ||
Turnout | 2,823 | 39.2 | 1.4 | ||
Registered electors | 7,205 | ||||
Conservative hold | Swing | 1.5 | |||
Party | Candidate | Votes | % | ±% | |
---|---|---|---|---|---|
Conservative | Andrew Ellis* | 1,560 | 64.6 | 6.6 | |
Green | Matt Stemp | 345 | 14.3 | 9.2 | |
Liberal Democrats | Mark Hull | 328 | 13.6 | 2.9 | |
Labour | Jan Plummer | 180 | 7.5 | 5.6 | |
Majority | 1,215 | 50.3 | — | ||
Turnout | 2,444 | 32.6 | 2.1 | ||
Registered electors | 7,488 | ||||
Conservative hold | Swing | 7.9 | |||
Party | Candidate | Votes | % | ±% | |
---|---|---|---|---|---|
Conservative | Patricia Moore* | 1,026 | 30.3 | 11.7 | |
Independent | John Akker | 969 | 28.6 | 8.2 | |
Independent | Carl Powling | 459 | 13.5 | New | |
Green | Peter Banks | 310 | 9.1 | 2.3 | |
Labour | Bry Mogridge | 263 | 7.8 | 1.1 | |
UKIP | David Broise | 248 | 7.3 | New | |
Liberal Democrats | Jenny Stevens | 114 | 3.4 | 0.4 | |
Majority | 57 | 1.7 | 3.5 | ||
Turnout | 3,413 | 42.4 | 1.9 | ||
Registered electors | 8,052 | ||||
Conservative hold | Swing | 1.8 | |||
Party | Candidate | Votes | % | ±% | |
---|---|---|---|---|---|
Liberal Democrats | Phil Coleman* | 1,447 | 62.2 | 13.1 | |
Conservative | Natalie Rowe | 463 | 19.9 | 10.4 | |
Green | Amanda Kirke | 216 | 9.3 | 5.2 | |
Labour | Sarah Ryder | 201 | 8.6 | 6.1 | |
Majority | 984 | 42.7 | 23.9 | ||
Turnout | 2,327 | 28.6 | 2.3 | ||
Registered electors | 8,182 | ||||
Liberal Democrats hold | Swing | 11.8 | |||
No Independent candidate as previous (−1.8).
Party | Candidate | Votes | % | ±% | |
---|---|---|---|---|---|
Liberal Democrats | Nick Cope* | 1,128 | 36.2 | 10.4 | |
Labour | Elisa Vasquez-Walters | 992 | 31.9 | 9.8 | |
Conservative | Carla Hales | 604 | 19.4 | 5.2 | |
Green | Bob Brannan | 390 | 12.5 | 6.9 | |
Majority | 136 | 4.3 | — | ||
Turnout | 3,139 | 33.4 | 0.4 | ||
Registered electors | 9,415 | ||||
Liberal Democrats hold | Swing | 10.1 | |||
No Independent candidate as previous (−2.3).
Party | Candidate | Votes | % | ±% | |
---|---|---|---|---|---|
Labour | Adam Fox* | 1,181 | 52.0 | 9.5 | |
Conservative | Michael McDonnell | 475 | 20.9 | 0.5 | |
Green | Andrew Canessa | 323 | 14.2 | 9.0 | |
Liberal Democrats | Mark Kiley | 292 | 12.9 | 3.7 | |
Majority | 706 | 31.1 | — | ||
Turnout | 2,299 | 27.5 | 3.3 | ||
Registered electors | 8,349 | ||||
Labour hold | Swing | 5.0 | |||
No Independent candidate as previous (−3.8).
Party | Candidate | Votes | % | ±% | |
---|---|---|---|---|---|
Conservative | Beverly Davis* | 1,520 | 54.1 | 6.9 | |
Liberal Democrats | John Loxley | 600 | 21.4 | 9.5 | |
Labour | Jamie Overland | 351 | 12.5 | 7.3 | |
Green | Clare Palmer | 336 | 12.0 | 4.8 | |
Majority | 920 | 32.7 | — | ||
Turnout | 2,857 | 36.3 | 1.3 | ||
Registered electors | 7,866 | ||||
Conservative hold | Swing | 8.2 | |||
Party | Candidate | Votes | % | ±% | |
---|---|---|---|---|---|
Conservative | Nigel Chapman* | 1,786 | 61.4 | 7.1 | |
Green | Sue Bailey | 454 | 15.6 | 6.0 | |
Liberal Democrats | Will Brown | 445 | 15.3 | 5.2 | |
Labour | Judith Short | 225 | 7.7 | 4.1 | |
Majority | 1,332 | 45.8 | — | ||
Turnout | 2,951 | 34.9 | 0.3 | ||
Registered electors | 8,455 | ||||
Conservative hold | Swing | 6.6 | |||
Party | Candidate | Votes | % | ±% | |
---|---|---|---|---|---|
Liberal Democrats | Sam McCarthy | 878 | 41.6 | 16.7 | |
Conservative | Vic Flores* | 714 | 33.8 | 4.4 | |
Labour Co-op | Rosalind Scott | 364 | 17.3 | 13.3 | |
Green | Blake Roberts | 154 | 7.3 | 2.5 | |
Majority | 164 | 7.8 | — | ||
Turnout | 2,136 | 27.3 | 1.8 | ||
Registered electors | 7,820 | ||||
Liberal Democrats gain from Conservative | Swing | 10.6 | |||
No Independent candidate as previous (−3.8).
Party | Candidate | Votes | % | ±% | |
---|---|---|---|---|---|
Liberal Democrats | Helen Chuah* | 1,238 | 44.4 | 7.5 | |
Conservative | Thomas Rowe | 1,118 | 40.1 | 3.3 | |
Green | Megan Maltby | 217 | 7.8 | 4.0 | |
Labour | HK Norman | 213 | 7.7 | 4.7 | |
Majority | 120 | 4.3 | — | ||
Turnout | 2,824 | 34.3 | 0.1 | ||
Registered electors | 8,235 | ||||
Liberal Democrats hold | Swing | 5.4 | |||
No Independent candidate as previous (−3.5).
Party | Candidate | Votes | % | ±% | |
---|---|---|---|---|---|
Liberal Democrats | Lesley Scott-Boutell* | 1,237 | 52.7 | 13.1 | |
Conservative | Jeremy Hagon | 795 | 33.9 | 12.1 | |
Green | Katie Francis | 171 | 7.3 | 3.4 | |
Labour | John Spademan | 143 | 6.1 | 4.3 | |
Majority | 442 | 18.8 | — | ||
Turnout | 2,361 | 35.0 | 1.8 | ||
Registered electors | 6,756 | ||||
Liberal Democrats hold | Swing | 12.6 | |||
Party | Candidate | Votes | % | ±% | |
---|---|---|---|---|---|
Conservative | Barbara Wood* | 1,315 | 64.2 | 2.4 | |
Labour | Paul Jeffs | 303 | 14.8 | 4.1 | |
Green | Wolfgang Fauser | 232 | 11.3 | 6.0 | |
Liberal Democrats | Gemma Graham | 198 | 9.7 | 0.5 | |
Majority | 1,012 | 49.4 | — | ||
Turnout | 2,095 | 29.3 | 0.1 | ||
Registered electors | 7,156 | ||||
Conservative hold | Swing | 0.9 | |||
Party | Candidate | Votes | % | ±% | |
---|---|---|---|---|---|
Liberal Democrats | Mark Cory* | 2,131 | 67.3 | 17.8 | |
Labour | Harry Nathan | 571 | 18.0 | 18.7 | |
Conservative | Jodie Clark | 267 | 8.4 | 2.1 | |
Green | John McArthur | 198 | 6.3 | 2.9 | |
Majority | 1,560 | 49.3 | — | ||
Turnout | 3,194 | 39.1 | 0.7 | ||
Registered electors | 8,166 | ||||
Liberal Democrats hold | Swing | 18.3 | |||
The 2006 Colchester Borough Council election took place on 4 May 2006 to elect members of Colchester Borough Council in Essex, England. One third of the council was up for election and the council stayed under no overall control.
The 2012 Colchester Borough Council election took place on 3 May 2012 to elect members of Colchester Borough Council in Essex, England. One third of the council was up for election and the council stayed under no overall control.
The 2002 Colchester Borough Council election took place on 2 May 2002 to elect members of Colchester Borough Council in Essex, England. This was the same day as the other 2002 local elections in the United Kingdom.
The 2003 Colchester Borough Council election took place on 1 May 2003 to elect members of Colchester Borough Council in Essex, England. This was the same day as the other 2003 United Kingdom local elections. One third of the seats were up for election and the council stayed under no overall control.
The 2004 Colchester Borough Council election took place on 10 June 2004 to elect members of Colchester Borough Council in Essex, England. This was the same day as the other 2004 United Kingdom local elections and as the 2004 European Parliament Elections. One third of the seats were up for election and the council stayed under no overall control.
The 2000 Colchester Borough Council election took place on 4 May 2000 to elect members of Colchester Borough Council in Essex, England. One third of the council was up for election and the council stayed under no overall control.
The 2008 Colchester Borough Council election took place on 1 May 2008 to elect members of Colchester Borough Council in Essex, England. One third of the council was up for election and the Conservative party lost overall control of the council to no overall control.
The 2014 Colchester Borough Council election took place on 22 May 2014 to elect members of Colchester Borough Council in Essex, England. One third of the council was up for election and the council stayed under no overall control.
The 2015 Colchester Borough Council election took place on 7 May 2015 to elect one third of the members of Colchester Borough Council in England. This was the same day as other local elections and as the General Election. Colchester Borough Council is made up of 60 councillors: 20 councillors were up for election.
Elections to Colchester Borough Council took place on 5 May 2016. Colchester Borough Council normally elects one third of its councillors each year, however, due to boundary changes, the whole council is up for election.
Elections to Colchester Borough Council took place on 3 May 2018. Seventeen members of the council - one-third of the whole — were elected, one from each of the seventeen wards. It was the first standard election to take place following comprehensive boundary changes in 2016. This set of seats were last up for election in 2016, with the third-placed elected candidates being up for election in 2018.
A by-thirds Hyndburn Borough Council local election, was held on Thursday 3 May 2018. Approximately one third of the local council's 35 seats fall up for election on that day.
The 2018 Calderdale Metropolitan Borough Council election took place on 3 May 2018 to elect members of Calderdale Metropolitan Borough Council in England. This was on the same day as other local elections. One councillor was elected in each ward for a four-year term so the councillors elected in 2018 last stood for election in 2014. Each ward is represented by three councillors, the election of which is staggered, so only one third of the councillors were elected in this election. Before the election there was no overall control with a minority Labour administration. Following the election Labour, having gained one councillor, was still two councillors away from a majority so it remained no overall control.
A by-thirds Hyndburn Borough Council local election, was held on Thursday 2 May 2019. Approximately one third of the local council's 35 seats fell up for election on that day.
Elections to Southend-on-Sea Borough Council took place on 2 May 2019. This was on the same day as other local elections across the United Kingdom.
The 2019 Wokingham Borough Council election took place on Thursday 2 May 2019. That was the same day as other United Kingdom local elections in order to elect members of Wokingham Unitary Council in Berkshire, England. One third of the council was up for election.
Elections to Amber Valley Borough Council in Derbyshire, England took place on Thursday 2 May 2019. One third of the council seats were up for election. The Labour Party gained overall control of the council, taking a total of five seats from the Conservatives. In addition, the Green Party gained representation for the first time. After the election, the composition of the council was:-
Elections to Colchester Borough Council were held on 6 May 2021. They were originally planned for 7 May 2020, but postponed until 2021 due to the COVID-19 pandemic. Seventeen members of the council were up for election, one from each of the 17 wards. There were also two additional by-elections in Prettygate and Lexden & Braiswick wards, bringing the total number of elected members to nineteen.
Elections to Colchester Borough Council took place on 5 May 2022. Eighteen members of the council were elected: one from 16 of the 17 wards, and two councillors from New Town & Christ Church ward, following the death of incumbent councillor Nick Cope, elected in 2019 and due to serve until 2023.
The 2023 Colchester City Council election took place on 4 May 2023 to elect members of Colchester City Council in Essex, England. This was on the same day as other local elections across England. There were 17 of the 51 seats on the council up for election, being the usual third of the council, with one seat available for each ward. This set of seats were last contested at the 2019 election.