This article needs additional citations for verification .(June 2020) |
The 2007 Braintree District Council election took place on 3 May 2007 to elect members of Braintree District Council in England. [1] This was on the same day as other local elections.
| |||||||||||||||||||||||||||||||||||||||||||||||||||||||||||||||||||||
59 seats to Braintree District Council 30 seats needed for a majority | |||||||||||||||||||||||||||||||||||||||||||||||||||||||||||||||||||||
---|---|---|---|---|---|---|---|---|---|---|---|---|---|---|---|---|---|---|---|---|---|---|---|---|---|---|---|---|---|---|---|---|---|---|---|---|---|---|---|---|---|---|---|---|---|---|---|---|---|---|---|---|---|---|---|---|---|---|---|---|---|---|---|---|---|---|---|---|---|
| |||||||||||||||||||||||||||||||||||||||||||||||||||||||||||||||||||||
|
Party | Seats | Gains | Losses | Net gain/loss | Seats % | Votes % | Votes | +/− | |
---|---|---|---|---|---|---|---|---|---|
Conservative | 42 | 15 | 0 | 15 | 70.0 | 50.3 | 39,088 | +14.6 | |
Labour | 9 | 0 | 11 | 11 | 15.0 | 28.1 | 21,847 | -5.5 | |
Halstead Residents | 5 | 0 | 0 | 8.3 | 4.8 | 3,747 | -1.9 | ||
Green | 2 | 0 | 0 | 3.3 | 5.6 | 4,359 | -0.4 | ||
Liberal Democrats | 1 | 0 | 3 | 3 | 1.7 | 7.2 | 5,584 | -5.3 | |
Independent | 1 | 0 | 1 | 1 | 1.7 | 2.3 | 1,786 | -3.1 | |
English Democrat | 0 | 0 | 0 | 0.0 | 1.2 | 917 | N/A | ||
UKIP | 0 | 0 | 0 | 0.0 | 0.6 | 453 | N/A | ||
Party | Candidate | Votes | % | ±% | |
---|---|---|---|---|---|
Conservative | Margaret Galione | 805 | 65.3 | +26.3 | |
Conservative | Andrew Meyer | 752 | 61.0 | +31.6 | |
Labour | Juliet Walton | 192 | 15.6 | -0.1 | |
Labour | Tony Bennett | 165 | 13.4 | +1.6 | |
Liberal Democrats | Anthony Weaver | 159 | 12.9 | -26.4 | |
Green | Joyce Wells | 133 | 10.8 | N/A | |
Turnout | 1,232 | 41.2 | -2.8 | ||
Conservative gain from Liberal Democrats | |||||
Conservative hold | |||||
Party | Candidate | Votes | % | ±% | |
---|---|---|---|---|---|
Conservative | David Reid | 1,099 | 55.3 | +12.2 | |
Conservative | Wendy Schmitt | 1,099 | 55.3 | +11.0 | |
Conservative | Liz Edey | 1,065 | 53.5 | +11.1 | |
Liberal Democrats | Terry Brooks | 634 | 31.9 | +12.5 | |
Labour | Richard Green | 474 | 23.8 | -15.3 | |
Labour | Richard Parsons | 452 | 22.7 | -11.9 | |
Labour | Michael Coughlan | 338 | 17.0 | -14.9 | |
Turnout | 1,989 | 34.0 | +6.2 | ||
Conservative hold | |||||
Party | Candidate | Votes | % | ±% | |
---|---|---|---|---|---|
Labour | David Mann | 573 | 46.7 | -7.4 | |
Labour | Tony Everard | 547 | 44.6 | -4.5 | |
Conservative | Vanessa Santomauro | 426 | 34.7 | +2.0 | |
Conservative | Jennifer Smith | 374 | 30.5 | +0.5 | |
UKIP | Michael Ford | 187 | 15.3 | N/A | |
Liberal Democrats | Eileen Fierheller | 131 | 10.7 | -6.2 | |
Turnout | 1,226 | 38.0 | +10.5 | ||
Labour hold | |||||
Labour hold | |||||
Party | Candidate | Votes | % | ±% | |
---|---|---|---|---|---|
Conservative | John Baugh | 619 | 47.2 | +15.0 | |
Labour | Moia Thorogood | 551 | 42.0 | -16.1 | |
Conservative | Stephen Sandbrook | 538 | 41.0 | +16.9 | |
Labour | Lynn Watson | 534 | 40.7 | -20.6 | |
Liberal Democrats | Peter Braley | 141 | 10.7 | N/A | |
Turnout | 1,312 | 33.2 | +8.6 | ||
Conservative gain from Labour | |||||
Labour hold | |||||
Party | Candidate | Votes | % | ±% | |
---|---|---|---|---|---|
Green | James Abbott | 895 | 75.2 | +17.1 | |
Green | Philip Hughes | 865 | 72.7 | +21.2 | |
Labour | Greta Tew | 258 | 21.7 | -7.9 | |
Labour | Tony Tearle | 229 | 19.2 | -8.0 | |
Turnout | 1,190 | 34.0 | -6.2 | ||
Green hold | |||||
Green hold | |||||
Party | Candidate | Votes | % | ±% | |
---|---|---|---|---|---|
Conservative | John McKee | 1,042 | 52.1 | +18.6 | |
Conservative | Trevor McArdle | 999 | 49.9 | +16.4 | |
Conservative | Lene Shepherd | 970 | 48.5 | N/A | |
Labour | Agnes Bishop | 573 | 28.6 | -5.3 | |
Labour | Martin Green | 529 | 26.4 | -9.3 | |
Labour | Bill Edwards | 492 | 24.6 | -10.4 | |
Liberal Democrats | Pauline Brooks | 423 | 21.1 | -15.5 | |
Green | Rachel Brunton | 321 | 16.0 | +6.0 | |
Turnout | 2,001 | 35.6 | +10.6 | ||
Conservative gain from Liberal Democrats | |||||
Conservative gain from Labour | |||||
Conservative gain from Labour |
Party | Candidate | Votes | % | ±% | |
---|---|---|---|---|---|
Labour | Elwyn Bishop | 581 | 39.4 | -12.6 | |
Conservative | Caroline Denise | 546 | 37.0 | +10.5 | |
Labour | Eric Lynch | 541 | 36.7 | -9.6 | |
Labour | Eileen Davidson | 516 | 35.0 | -8.7 | |
Conservative | Nigel Edey | 507 | 34.4 | N/A | |
Conservative | David Messer | 483 | 32.8 | N/A | |
UKIP | Philip Shute | 266 | 18.0 | N/A | |
Liberal Democrats | Paul Lemon | 247 | 16.8 | -2.3 | |
Liberal Democrats | Keith Miller | 244 | 16.6 | -2.2 | |
Turnout | 1,474 | 31.3 | +5.6 | ||
Labour hold | |||||
Conservative gain from Labour | |||||
Labour hold | |||||
Party | Candidate | Votes | % | ±% | |
---|---|---|---|---|---|
Liberal Democrats | Doug Rice | 673 | 39.4 | -1.0 | |
Conservative | Russell Wilkins | 607 | 35.5 | +7.1 | |
Labour | Michael Lynch | 582 | 34.1 | -12.7 | |
Conservative | David Finch | 529 | 31.0 | +5.2 | |
Labour | Gordon Currie | 518 | 30.3 | -9.5 | |
Conservative | David Morse | 498 | 29.1 | N/A | |
Labour | Allan Millam | 474 | 27.7 | -15.4 | |
Green | Dawn Holmes | 259 | 15.2 | +0.9 | |
English Democrat | Albert Da | 247 | 14.5 | N/A | |
Turnout | 1,709 | 34.2 | +8.3 | ||
Liberal Democrats hold | |||||
Conservative gain from Labour | |||||
Labour hold | |||||
Party | Candidate | Votes | % | ±% | |
---|---|---|---|---|---|
Conservative | John Collar | 515 | 62.2 | -8.8 | |
Labour | Steven Trumm | 313 | 37.8 | +8.8 | |
Majority | 202 | 24.4 | -17.6 | ||
Turnout | 828 | 43.0 | +3.3 | ||
Conservative hold | Swing | 8.8 | |||
Party | Candidate | Votes | % | ±% | |
---|---|---|---|---|---|
Conservative | Patricia Newton | 1,134 | 68.9 | +20.7 | |
Conservative | Malcolm Dunn | 1,045 | 63.4 | +17.0 | |
Labour | Robert Alston | 536 | 32.5 | -5.1 | |
Labour | Cathie Joyce | 513 | 31.1 | -9.1 | |
Turnout | 1,647 | 42.4 | +1.4 | ||
Conservative hold | |||||
Party | Candidate | Votes | % | ±% | |
---|---|---|---|---|---|
Independent | Lynette Flint | 564 | 82.5 | +26.6 | |
Labour | Michael Shirvington | 120 | 17.5 | N/A | |
Majority | 444 | 65.0 | +53.2 | ||
Turnout | 684 | 40.8 | +12.8 | ||
Independent hold | Swing | N/A | |||
Party | Candidate | Votes | % | ±% | |
---|---|---|---|---|---|
Conservative | John O'Reilly-Cicconi | 638 | 74.6 | +19.5 | |
Labour | Maureen Bennett | 217 | 25.4 | +11.1 | |
Majority | 421 | 49.2 | +24.6 | ||
Turnout | 855 | 44.7 | -3.3 | ||
Conservative hold | Swing | 4.2 | |||
Party | Candidate | Votes | % | ±% | |
---|---|---|---|---|---|
Conservative | Graham Butland | 1,158 | 72.3 | +11.9 | |
Conservative | Claire Sandbrook | 1,129 | 70.5 | +14.9 | |
Conservative | Roger Walters | 1,010 | 63.0 | +9.3 | |
Liberal Democrats | David Rice | 284 | 17.7 | -6.2 | |
Independent | Tony Watts | 203 | 12.7 | -0.7 | |
Labour | Richard Tincknell | 184 | 11.5 | -0.3 | |
Labour | Steven Goodfellow | 148 | 9.2 | -1.9 | |
Labour | Daniel Ezra | 132 | 8.2 | -1.7 | |
Turnout | 1,602 | 32.0 | -0.1 | ||
Conservative hold | |||||
Party | Candidate | Votes | % | ±% | |
---|---|---|---|---|---|
Halstead Residents | David Hume | 949 | 58.6 | -10.8 | |
Halstead Residents | Beryl Gage | 911 | 56.2 | -13.8 | |
Halstead Residents | Michael Gage | 822 | 50.7 | -19.6 | |
English Democrat | Raymond Brown | 564 | 34.8 | N/A | |
Labour | Grahame McCoyd | 398 | 24.6 | -0.8 | |
Labour | Adrian Axtell | 397 | 24.5 | -0.6 | |
Labour | Nancy Freeman | 358 | 22.1 | -1.2 | |
Turnout | 1,620 | 31.4 | +2.9 | ||
Halstead Residents hold | |||||
Party | Candidate | Votes | % | ±% | |
---|---|---|---|---|---|
Halstead Residents | Jacqueline Pell | 604 | 61.4 | -15.9 | |
Halstead Residents | Howard Messenger | 461 | 46.9 | -10.7 | |
Labour | Malcolm Fincken | 357 | 36.3 | +2.2 | |
Labour | Stuart Gilbert | 291 | 29.6 | -2.8 | |
Turnout | 983 | 28.4 | -1.6 | ||
Halstead Residents hold | |||||
Party | Candidate | Votes | % | ±% | |
---|---|---|---|---|---|
Conservative | David Bebb | 1,006 | 78.0 | +12.9 | |
Conservative | Keith Bigden | 987 | 76.6 | -0.1 | |
Labour | Carole Hine | 283 | 22.0 | -2.5 | |
Labour | Neil Coughlan | 187 | 14.5 | -6.9 | |
Turnout | 1,289 | 38.6 | +8.1 | ||
Conservative hold | |||||
Party | Candidate | Votes | % | ±% | |
---|---|---|---|---|---|
Conservative | Jo Beavis | 1,283 | 65.3 | +3.5 | |
Conservative | Wendy Scattergood | 1,114 | 56.7 | +13.4 | |
Conservative | Fred Swallow | 1,103 | 56.1 | -0.2 | |
Liberal Democrats | Steve Bolter | 726 | 36.9 | +3.9 | |
Labour | Ted Snarey | 326 | 16.6 | +0.8 | |
Labour | John Kotz | 236 | 12.0 | -0.1 | |
Labour | Noel Owen | 224 | 11.4 | -8.8 | |
Turnout | 1,966 | 40.0 | +7.1 | ||
Conservative hold | |||||
Party | Candidate | Votes | % | ±% | |
---|---|---|---|---|---|
Conservative | Thomas Foster | 881 | 52.8 | +10.9 | |
Conservative | Robert Mitchell | 845 | 50.7 | +13.2 | |
Labour | Ian Marshall | 432 | 25.9 | -7.2 | |
Labour | Terrence Lazell | 335 | 20.1 | -13.8 | |
Green | Cheryl Gerrard | 278 | 16.7 | N/A | |
Turnout | 1,668 | 43.7 | -1.3 | ||
Conservative hold | |||||
Party | Candidate | Votes | % | ±% | |
---|---|---|---|---|---|
Conservative | Tim Wilkinson | 630 | 80.5 | +9.7 | |
Labour | Carl May-Smith | 153 | 19.5 | -9.7 | |
Majority | 477 | 61.0 | +19.4 | ||
Turnout | 783 | 47.8 | +11.8 | ||
Conservative hold | Swing | 9.7 | |||
Party | Candidate | Votes | % | ±% | |
---|---|---|---|---|---|
Conservative | Mike Banthorpe | 399 | 58.9 | +9.7 | |
Liberal Democrats | Lesley Beckett | 121 | 17.9 | -32.9 | |
English Democrat | Colin Morris | 106 | 15.7 | N/A | |
Labour | Ken Tew | 51 | 7.5 | N/A | |
Majority | 278 | 41.0 | N/A | ||
Turnout | 677 | 41.5 | -1.7 | ||
Conservative gain from Liberal Democrats | Swing | 21.3 | |||
Party | Candidate | Votes | % | ±% | |
---|---|---|---|---|---|
Conservative | Nigel Harley | 650 | 77.8 | +15.1 | |
Labour | Betty Kotz | 186 | 22.2 | +4.0 | |
Majority | 464 | 55.6 | +12.0 | ||
Turnout | 836 | 50.4 | +9.2 | ||
Conservative hold | Swing | 5.6 | |||
Party | Candidate | Votes | % | ±% | |
---|---|---|---|---|---|
Conservative | Tony Shelton | 555 | 64.5 | -8.6 | |
Liberal Democrats | Alan Crowe | 245 | 28.5 | N/A | |
Labour | Fred Hearn | 60 | 7.0 | -19.9 | |
Majority | 310 | 36.0 | -10.2 | ||
Turnout | 860 | 51.0 | +14.0 | ||
Conservative hold | Swing | N/A | |||
Party | Candidate | Votes | % | ±% | |
---|---|---|---|---|---|
Conservative | Rosemary O'Shea | 752 | 50.4 | N/A | |
Conservative | Gabrielle Spray | 686 | 46.0 | -7.6 | |
Independent | Bernard Gaught | 532 | 35.7 | -24.6 | |
Independent | Jim Bond | 487 | 32.6 | N/A | |
Labour | Dais Marshall | 148 | 9.9 | -15.7 | |
Labour | Holly Barlow | 146 | 9.8 | -15.0 | |
Turnout | 1,492 | 38.3 | +6.1 | ||
Conservative gain from Independent | |||||
Conservative hold | |||||
Party | Candidate | Votes | % | ±% | |
---|---|---|---|---|---|
Conservative | John Finbow | 1,066 | 78.6 | +6.4 | |
Conservative | Simon Walsh | 1,029 | 75.9 | +5.2 | |
Labour | Corinne Green | 226 | 16.7 | -4.1 | |
Labour | Miles Scrivens | 204 | 15.0 | -4.9 | |
Turnout | 1,356 | 44.3 | +7.8 | ||
Conservative hold | |||||
Party | Candidate | Votes | % | ±% | |
---|---|---|---|---|---|
Conservative | Robert Bolton | 579 | 83.1 | +16.1 | |
Labour | Peter Long | 118 | 16.9 | +3.5 | |
Majority | 697 | 66.2 | +18.8 | ||
Turnout | 697 | 42.0 | +8.0 | ||
Conservative hold | Swing | 6.3 | |||
Party | Candidate | Votes | % | ±% | |
---|---|---|---|---|---|
Conservative | Michael Lager | 609 | 43.7 | +6.9 | |
Conservative | Sandra Howell | 593 | 42.6 | N/A | |
Labour | Phil Barlow | 517 | 37.1 | +0.3 | |
Labour | Cynthia Woodhouse | 390 | 28.0 | -2.9 | |
Liberal Democrats | Pamela Hooper | 250 | 17.9 | -12.2 | |
Green | Nelson Brunton | 228 | 16.4 | -4.8 | |
Turnout | 1,393 | 40.5 | +7.5 | ||
Conservative gain from Labour | |||||
Conservative hold | |||||
Party | Candidate | Votes | % | ±% | |
---|---|---|---|---|---|
Labour | Bob Evans | 507 | 46.4 | -9.1 | |
Labour | John Gyford | 453 | 41.5 | -10.8 | |
Conservative | Patricia Lee | 406 | 37.2 | +11.4 | |
Conservative | Paula Cohen | 376 | 34.4 | N/A | |
Green | Nicholas Scales | 225 | 20.6 | +4.0 | |
Turnout | 1,092 | 32.0 | +9.2 | ||
Labour hold | |||||
Labour hold | |||||
Party | Candidate | Votes | % | ±% | |
---|---|---|---|---|---|
Conservative | Janet Money | 829 | 46.7 | +8.1 | |
Conservative | Ron Ramage | 794 | 44.7 | +7.4 | |
Conservative | John Elliott | 771 | 43.4 | +8.3 | |
Labour | Paul Heath | 588 | 33.1 | -9.9 | |
Labour | Jacqueline Martin | 587 | 33.0 | -10.7 | |
Labour | Wayne Tearle | 580 | 32.6 | -6.4 | |
Green | Patricia Brunton | 296 | 16.7 | +3.4 | |
Liberal Democrats | Bernard Dearlove | 257 | 14.5 | -1.9 | |
Green | Stephanie Bills | 239 | 13.4 | N/A | |
Turnout | 1,777 | 30.9 | +3.1 | ||
Conservative gain from Labour | |||||
Conservative gain from Labour |
Party | Candidate | Votes | % | ±% | |
---|---|---|---|---|---|
Conservative | Stephen Lambourne | 864 | 49.0 | +15.3 | |
Conservative | Bill Rose | 636 | 36.1 | N/A | |
Labour | Lucy Barlow | 584 | 33.1 | -9.1 | |
Labour | Kathie Tearle | 561 | 31.8 | -11.4 | |
Labour | Kerin Boylan | 539 | 30.6 | -14.1 | |
Liberal Democrats | Joy Reekie | 367 | 20.8 | -2.5 | |
Green | Stephen Hicks | 357 | 20.2 | -4.7 | |
Liberal Democrats | Barry Fleet | 341 | 19.3 | N/A | |
Liberal Democrats | Helen Waring | 341 | 19.3 | N/A | |
Green | Wendy Partridge | 263 | 14.9 | -8.6 | |
Turnout | 1,764 | 35.4 | +10.6 | ||
Conservative gain from Labour | |||||
Labour hold | |||||
Party | Candidate | Votes | % | ±% | |
---|---|---|---|---|---|
Conservative | Nigel McCrea | 373 | 72.6 | +30.1 | |
Labour | David Green | 141 | 27.4 | -1.8 | |
Majority | 232 | 45.2 | +31.9 | ||
Turnout | 514 | 33.5 | -3.0 | ||
Conservative hold | Swing | 16.0 | |||
Party | Candidate | Votes | % | ±% | |
---|---|---|---|---|---|
Conservative | 668 | 50.7 | +17.4 | ||
Labour | 406 | 30.8 | -4.6 | ||
Green | 125 | 9.5 | N/A | ||
Liberal Democrats | 119 | 9.0 | -6.1 | ||
Majority | 262 | 19.9 | |||
Turnout | 1,318 | ||||
Conservative hold | Swing | 11.0 | |||
Party | Candidate | Votes | % | ±% | |
---|---|---|---|---|---|
Conservative | 782 | 78.1 | +0.1 | ||
Labour | 138 | 13.8 | -8.2 | ||
Green | 81 | 8.1 | N/A | ||
Majority | 644 | 64.3 | +8.3 | ||
Turnout | 1,001 | ||||
Conservative hold | Swing | 4.2 | |||
Party | Candidate | Votes | % | ±% | |
---|---|---|---|---|---|
Conservative | 508 | 40.9 | +1.1 | ||
Labour | 373 | 30.1 | +3.2 | ||
Liberal Democrats | 182 | 14.7 | -2.2 | ||
Green | 178 | 14.3 | -2.1 | ||
Majority | 135 | 10.8 | N/A | ||
Turnout | 1,241 | ||||
Conservative hold | Swing | 1.1 | |||
Party | Candidate | Votes | % | ±% | |
---|---|---|---|---|---|
Conservative | 647 | 77.0 | +24.5 | ||
Labour | 121 | 14.4 | +4.1 | ||
Green | 72 | 8.6 | N/A | ||
Majority | 526 | 62.6 | N/A | ||
Turnout | 840 | ||||
Conservative hold | Swing | 10.2 | |||
A by-election was called due to the disqualification of Cllr Russell Wilkins (Conservative) for non-attendance.
Party | Candidate | Votes | % | ±% | |
---|---|---|---|---|---|
Conservative | Abi Olumbori | 351 | 33.0 | +7.4 | |
Labour | Gordon Currie | 316 | 29.7 | +5.1 | |
Liberal Democrats | David Toombs | 216 | 20.3 | -8.1 | |
Independent | Andy Beatty | 138 | 13.0 | N/A | |
Green | Wendy Partridge | 44 | 4.1 | -6.8 | |
Majority | 35 | 3.3 | N/A | ||
Turnout | 1,065 | ||||
Conservative hold | Swing | 1.2 | |||
Antony Harold Newton, Baron Newton of Braintree, OBE, PC, DL was a British Conservative politician and former Cabinet member. He was the member of Parliament for Braintree from 1974 to 1997, and was later a member of the House of Lords.
Braintree District is a local government district in Essex, England. The district is named after its largest town, Braintree, where the council is based. The district also includes the towns of Halstead and Witham and surrounding rural areas.
Braintree is a constituency in Essex represented in the House of Commons of the UK Parliament since 2015 by James Cleverly, a member of the Conservative Party.
Saffron Walden is a constituency in Essex, represented in the House of Commons of the UK Parliament since 2017 by Kemi Badenoch, a Conservative.
Braintree District Council in Essex, England is elected every four years. Since the last comprehensive boundary changes in 2015, 49 councillors have been elected from 26 wards.
Chelmsford City Council in Essex, England is elected every four years. Since the last boundary changes in 2003 the council has comprised 57 councillors elected from 24 wards.
Braintree is a town in Essex, England. The principal settlement of Braintree District, it is located 10 miles northeast of Chelmsford, 35 miles (56 km) northwest of Southend-on-Sea, and 15 mi (24 km) west of Colchester. According to the 2021 Census, the town had a population of 43,492, while the urban area, which includes Great Notley, Rayne, Tye Green and High Garrett, had a population of 55,792.
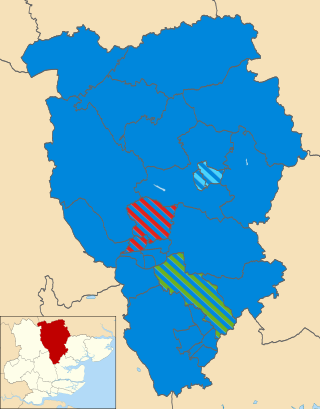
The 2015 Braintree District Council election was scheduled to take place on 7 May 2015 to elect members of Braintree District Council in England. This was on the same day as other local elections.
The 2011 Braintree District Council Elections took place on 5 May 2011 to elect members of Braintree District Council in England. This was on the same day as other local elections. All 60 councillors in 30 wards were up for election.
The 2019 Braintree District Council election took place on 2 May 2019 to elect members of Braintree District Council in England. This was on the same day as other local elections.
The 1991 Braintree District Council election took place on 2 May 1991 to elect members of Braintree District Council in England. This was on the same day as other local elections.
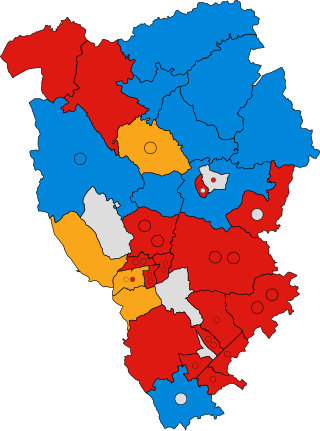
The 1995 Braintree District Council election took place on 4 May 1995 to elect members of Braintree District Council in England. This was on the same day as other local elections.
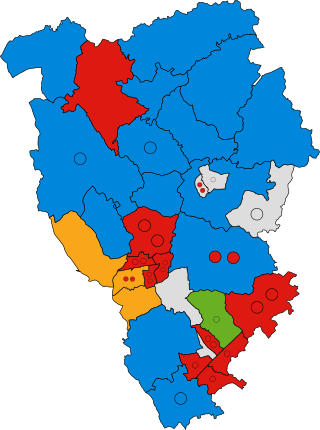
The 1999 Braintree District Council election took place on 6 May 1999 to elect members of Braintree District Council in England. This was on the same day as other local elections.
The 2003 Braintree District Council election took place on 1 May 2003 to elect members of Braintree District Council in England. This was on the same day as other local elections.
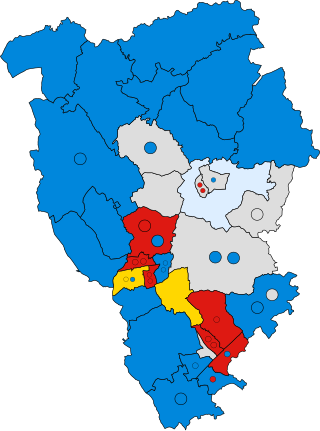
Elections to Essex County Council took place on 6 May 2021 as part of the 2021 United Kingdom local elections. All 75 councillors were elected from 70 electoral divisions, with each returning either one or two councillors by first-past-the-post voting for a four-year term of office.
The 1973 Braintree District Council election took place on 7 June 1973 to elect members of Braintree District Council in England. This was on the same day as other local elections.
The 1976 Braintree District Council election took place on 6 May 1976 to elect members of Braintree District Council in England. This was on the same day as other local elections.
The 1979 Braintree District Council election took place on 3 May 1979 to elect members of Braintree District Council in England. This was on the same day as the 1979 UK general election and other local elections across the United Kingdom.
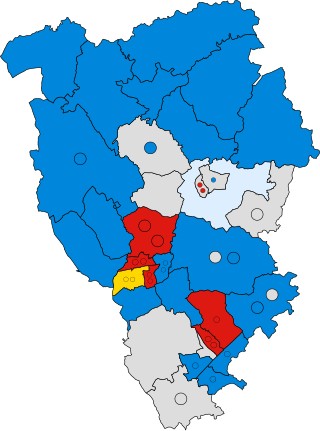
The 1983 Braintree District Council election took place on 5 May 1983 to elect members of Braintree District Council in England. This was on the same day as other local elections.
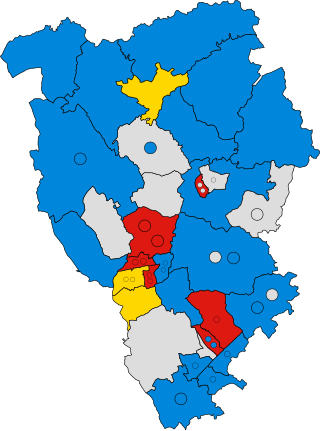
The 1987 Braintree District Council election took place on 7 May 1987 to elect members of Braintree District Council in England. This was on the same day as other local elections.