2009 Essex County Council election

Last updated

2009 Essex County Council election
Flag of Essex.svg
  2005 4 June 2009 2013  

All 75 seats to Essex County Council
38 seats needed for a majority
 First partySecond partyThird party
  No image wide.svg No image wide.svg No image wide.svg
Leader Paul White Tom Smith-HughesPaul Kirkman
Party Conservative Liberal Democrats Labour
Leader since>1998May 2005May 2005
Leader's seatStockChelmsford NorthPitsea (Defeated)
Last election52 seats, 44.5%8 seats, 22.9%13 seat, 24.3%
Seats before49813
Seats won60121
Seat changeIncrease2.svg8Increase2.svg4Decrease2.svg12
Popular vote169,97579,08542,334
Percentage43.3%20.1%10.8%
SwingDecrease2.svg 1.2%Decrease2.svg 2.8%Decrease2.svg 13.8%

 Fourth partyFifth partySixth party
  No image wide.svg No image wide.svg No image wide.svg
Leader Chris Pond Dave BlackwellN/a
Party Loughton Residents CIIP BNP
Leader sinceMay 200522 April 2004N/a
Leader's seatLoughton CentralN/aN/a
Last election1 seat, 0.4%Did Not Stand0 seats, 0.2%
Seats before100
Seats won110
Seat changeSteady2.svgIncrease2.svg1Steady2.svg
Popular vote2,8241,65535,037
Percentage0.7%0.4%8.9%
SwingIncrease2.svg0.3%Increase2.svg0.4%Increase2.svg 8.7%

 Seventh party
  No image wide.svg
Party Green
Last election0 seats, 5.6%
Seats before0
Seats won0
Seat changeSteady2.svg
Popular vote26,547
Percentage6.8%
SwingIncrease2.svg 1.2%

Essex UK local election 2009 map update.svg
Results by electoral division.Conservatives in blue, Liberal Democrats in yellow, Labour in red and in grey the Canvey Island Independent Party and Independent Loughton Residents Association.

Council control before election

Conservative

Council control after election

Conservative

An election to Essex County Council took place on 4 June 2009 as part of the 2009 United Kingdom local elections. The elections had been delayed from 7 May, to coincide with elections to the European Parliament. 75 councillors were elected from various electoral divisions, which returned either one or two county councillors each by first-past-the-post voting for a four-year term of office. The electoral divisions were the same as those used at the previous election in 2005.

Contents

All locally registered electors (British, Irish, Commonwealth and European Union citizens) who were aged 18 or over on Thursday 2 May 2013 were entitled to vote in the local elections. Those who were temporarily away from their ordinary address (for example, away working, on holiday, in student accommodation or in hospital) were also entitled to vote in the local elections, [1] although those who had moved abroad and registered as overseas electors cannot vote in the local elections. It is possible to register to vote at more than one address (such as a university student who had a term-time address and lives at home during holidays) at the discretion of the local Electoral Register Office, but it remains an offence to vote more than once in the same local government election. [2]

Previous composition

2005 election

PartySeats
Conservative 52
Labour 13
Liberal Democrats 8
Community Representative1
Loughton Residents 1
Total75

Composition of council seats before election

PartySeats
Conservative 49
Labour 13
Liberal Democrats 8
Tendring First 3
Loughton Residents 1
Independent 1
Total75

Summary

The Conservatives were re-elected with an increased majority. As in several other Tory councils, the Liberal Democrats replaced Labour as the main opposition party as Labour lost all but one seat, reflecting the Labour Party's declining national popularity at that time.

A notable feature of this election was the number of minor parties and local groups. These included right wing and anti-European parties, that appear to have siphoned support from the main parties and, in some divisions, out-polled them. Local groups enjoyed strong local support, challenging the successful candidates and winning seats.

Results summary

In summaries, Labour and Labour Co-operative results are amalgamated. In multi-member divisions, the "majority" is the number of votes by which the loser with the highest number of votes fell short of being elected.

2009 Essex County Council election [3]
PartySeatsGainsLossesNet gain/lossSeats %Votes %Votes+/−
  Conservative 60124Increase2.svg880.043.3169,975−1.2
  Liberal Democrats 1240Increase2.svg416.020.179,085−2.8
  Labour 1012Decrease2.svg 121.310.842,334−13.8
  Loughton Residents 100Steady2.svg1.30.72,764+0.3
  CIIP 110Increase2.svg 11.30.41,655N/A
  BNP 000Steady2.svg08.935,037+8.7
  Green 000Steady2.svg06.826,547+1.2
  UKIP 000Steady2.svg04.618,186+4.0
  Tendring First 000Steady2.svg01.55,866N/A
  English Democrat 000Steady2.svg01.35,212+1.2
  Independent 000Steady2.svg01.14,322+0.8
  Community Representative 001Decrease2.svg 100.41,523−0.5

Election of Group Leaders

Paul White (Stock) was re elected leader of the Conservative Group and Tom Smith-Hughes (Chelmsford North) was re elected leader of the Liberal Democratic Group.

In April 2012, Smith-Hughes died after a long battle with cancer. [4] [5] Deputy leader Michael Mackrory (Springfield) was elected to replace him.

Election of Leader of the Council

Paul White the leader of the conservative group was duly elected leader of the council and formed a conservative administration.

White was forced to resign after being charged with false accounting as part of the ongoing expenses scandal. [6] Peter Martin (Chelmer) was elected as his successor, with David Finch (Hedingham) as his deputy.

Results by District

Basildon

District Summary

PartySeats+/-Votes%+/-
Conservative 9Increase2.svg 431,64843.4−2.4
Labour 0Decrease2.svg 411,64016.0−15.5
Liberal Democrat 0Steady2.svg11,00915.1−3.1
BNP 0Steady2.svg10,11413.9+13.9
UKIP 0Steady2.svg7,64810.5+10.5
English Democrats 0Steady2.svg7951.1+0.7

Division Results

Basildon Westley Heights
PartyCandidateVotes%±%
Conservative John Schofield * 1,936 34.6 −3.3
Liberal Democrats Geoffrey Williams1,67930.0+1.4
UKIP Imelda Clancy71112.7N/A
Labour Mark Witzer67912.1−13.7
BNP Geoffrey McCarthy59610.6N/A
Majority2575.4
Turnout 5,60135.9
Conservative hold Swing
Billericay and Burstead
PartyCandidateVotes%±%
Conservative Anthony Headley * 6,224 62.4 –3.4
Conservative Kay Twitchen * 5,021 50.4 –0.2
UKIP Susan McCaffery1,72117.3N/A
Liberal Democrats Martin Howard1,63816.4–6.9
Liberal Democrats Stephen Nice1,51915.2–7.2
Labour Margaret Viney9139.2–6.9
English Democrat Kim Gandy7956.6N/A
BNP Michael Bateman7357.4N/A
Labour Anthony Borlase7177.2–7.1
BNP Irene Bateman6566.6N/A
Turnout 19,93939.3
Conservative hold
Conservative hold
Laindon Park and Fryerns
PartyCandidateVotes%±%
Conservative John Dornan 2,349 33.4 +0.1
Conservative Terri Sargent 2,282 32.4 +0.8
Labour William Archibald *2,09429.7–24.6
Labour Rachel Liebeschuetz *1,68623.9–19.4
BNP David King1,61222.9N/A
BNP Leonard Heather1,60822.8N/A
Liberal Democrats Arnold Lutton1,24017.6+2.2
Liberal Democrats Linda Williams1,21417.2+4.7
Turnout 14,08526.1
Conservative gain from Labour
Pitsea
PartyCandidateVotes%±%
Conservative David Abrahall 2,437 30.9 −4.5
Conservative Sandra Hillier 2,122 26.9 –3.9
Labour Keith Bobbin *2,02725.7−24.6
Labour Paul Kirkman *1,83623.3–21.3
UKIP Terry McBride1,72521.9N/A
UKIP Janet Davies1,63720.7N/A
BNP Philip Howell1,43918.2N/A
BNP Raymond Pearce1,07213.6N/A
Liberal Democrats Elizabeth Grant78810.0–6.1
Liberal Democrats Emma Peall6978.8–5.4
Turnout 15,78028.2
Conservative gain from Labour
Wickford Crouch
PartyCandidateVotes%±%
Conservative Don Morris * 4,732 54.2 −2.7
Conservative Iris Pummell * 4,545 52.1 –2.1
UKIP Ron Long1,85421.3N/A
BNP Anthony Gladwin1,44916.6N/A
Liberal Democrats Philip Jenkins1,18913.6−2.1
Liberal Democrats Benjamin Williams1,04512.0–3.3
BNP Christopher Roberts94710.9N/A
Labour Santa Bennett87510.0−15.3
Labour Patricia Rackley8139.3–15.6
Turnout 17,44934.1
Conservative hold
Conservative hold

Braintree

District Summary

PartySeats+/-Votes%+/-
Conservative 8Increase2.svg 218,19944.0+0.8
Labour 0Decrease2.svg 25,67513.7−17.0
Liberal Democrat 0Steady2.svg5,26612.7−4.8
Green 0Steady2.svg4,61311.1+4.3
UKIP 0Steady2.svg3,0527.4+5.5
BNP 0Steady2.svg2,7796.7+6.7
English Democrats 0Steady2.svg1,8144.4+4.4

Division Results

Bocking
PartyCandidateVotes%±%
Conservative John Baugh 1,814 37.3 −0.1
Labour Lynn Watson *99720.5−19.6
UKIP Gordon Helm85917.7New
Liberal Democrats Terry Brooks57211.8−5.1
BNP Carole Gladwin3186.5New
Green Nicholas Scales2996.2+0.6
Majority81716.8
Turnout 4,85936.5
Conservative gain from Labour Swing
Braintree Eastern
PartyCandidateVotes%±%
Conservative Nigel Edey * 2,316 45.5 +2.5
Labour Eric Lynch74714.7−18.9
Liberal Democrats Paul Lemon60711.9−2.7
Green Andrea Bunn55410.9+6.1
English Democrat Perry Blye4939.7New
BNP Matthew Taylor3687.2New
Majority1,56930.9
Turnout 5,08540.0
Conservative hold Swing
Braintree Town
PartyCandidateVotes%±%
Conservative Graham Butland 1,575 35.3 −7.7
Labour Elwyn Bishop *87619.6−14.0
UKIP Philip Shute65214.6New
Liberal Democrats Doug Rice60013.4−1.2
Green Wendy Partridge2796.2+1.4
BNP Paul Hooks2545.7New
English Democrat Albert Day2315.2New
Majority69915.6
Turnout 4,46735.3
Conservative gain from Labour Swing
Halstead
PartyCandidateVotes%±%
Conservative Joe Pike * 2,196 40.8 −6.2
UKIP Michael Ford79014.7New
Labour Malcolm Fincken60011.2−15.5
Liberal Democrats Alan Crowe58410.9−9.4
English Democrat Raymond Brown5299.8New
Green Patricia Brunton4137.7+1.7
BNP Linda Henry2654.9New
Majority1,40626.1
Turnout 5,37736.9
Conservative hold Swing
Hedingham
PartyCandidateVotes%±%
Conservative David Finch * 3,329 54.5 +2.0
Liberal Democrats Stephen Bolter1,13018.5−4.6
Green Agnes Wells70611.6+5.4
BNP Richard Higby5048.3New
Labour John Kotz4357.1−11.1
Majority2,19938.8
Turnout 6,10444.7
Conservative hold Swing
Three Fields with Great Notley
PartyCandidateVotes%±%
Conservative Roger Walters * 2,648 55.9 +4.0
Liberal Democrats Peter Braley61212.9−6.0
English Democrat Colin Morris56111.8New
Green Stephen Hicks4128.7+4.6
Labour Moia Thorogood2745.8−15.8
BNP Michael Keeble2314.9New
Majority2,03643.0
Turnout 4,73840.8
Conservative hold Swing
Witham Northern
PartyCandidateVotes%±%
Conservative Michael Lager * 1,793 31.8 −6.0
Green James Abbott1,30723.2+6.5
Labour Phillip Barlow94616.8−18.2
UKIP David Hodges75113.3+8.8
Liberal Democrats Pamela Hooper4908.7+2.7
BNP Robert Rundell3496.2New
Majority4868.6
Turnout 5,63641.9
Conservative hold Swing
Witham Southern
PartyCandidateVotes%±%
Conservative Derrick Louis * 2,528 49.3 +8.6
Labour Lucy Barlow80015.6−20.6
Liberal Democrats Bernard Dearlove67113.1−3.3
Green Philip Hughes64312.5+5.8
BNP Rodney Leveridge4909.5New
Majority1,72833.7
Turnout 5,13236.0
Conservative hold Swing

Brentwood

District Summary

PartySeats+/-Votes%+/-
Conservative 2Decrease2.svg 211,66849.3±0.0
Liberal Democrat 2Increase2.svg 27,08129.9+0.3
Labour 0Steady2.svg1,7397.3−5.6
BNP 0Steady2.svg1,6917.1+7.1
UKIP 0Steady2.svg1,3005.5+0.2
English Democrats 0Steady2.svg1980.8+0.8

Division Results

Brentwood Hutton
PartyCandidateVotes%±%
Conservative John Roberts * 4,052 65.4 +7.6
Liberal Democrats Ross Carter1,11918.1−5.0
BNP Clifford Houghton6029.7New
Labour Kees Maxey4206.8−6.6
Majority2,93347.4
Turnout 6,19342.6
Conservative hold Swing
Brentwood North
PartyCandidateVotes%±%
Liberal Democrats Barry Aspinell 2,698 45.5 +14.9
Conservative Phil Baker *2,39740.4−6.3
Labour Michele Wigram5629.5−3.5
BNP Carolyn Rossiter2764.6New
Majority3015.1
Turnout 5,93345.2
Liberal Democrats gain from Conservative Swing
Brentwood Rural
PartyCandidateVotes%±%
Conservative Ann Naylor * 2,953 48.7 −1.0
UKIP Yvonne Maguire1,30021.4+15.0
Liberal Democrats Karen Chilvers99116.3−15.7
Labour Dennis Norman3145.2−3.5
BNP Sidney Chaney3125.1New
English Democrat Maureen Davies1983.3New
Majority1,65327.2
Turnout 6,06844.5
Conservative hold Swing
Brentwood South
PartyCandidateVotes%±%
Liberal Democrats David Kendall 2,273 41.5 +7.6
Conservative Lionel Lee *2,26641.3+0.3
BNP Kevin Swaby5019.1New
Labour Gareth Paul Barrett4438.1−8.8
Majority70.1
Turnout 5,48341.5
Liberal Democrats gain from Conservative Swing

Castle Point

District Summary

PartySeats+/-Votes%+/-
Conservative 4Decrease2.svg 111,30347.0−3.2
CIIP 1Increase2.svg 13,43714.3+14.3
Labour 0Steady2.svg2,78911.6−22.7
BNP 0Steady2.svg2,76011.5+11.5
Liberal Democrat 0Steady2.svg1,6787.0−3.8
Green 0Steady2.svg1,1684.9+0.2
UKIP 0Steady2.svg916 3.8+3.8

Division Results

Canvey Island East
PartyCandidateVotes%±%
CIIP Brian Wood 1,782 34.8 New
Conservative Mark Howard *1,61231.5−13.8
BNP Laurence Morgan85216.7New
Labour John Payne55310.8−31.1
Liberal Democrats Nicole Nunn3166.2−2.0
Majority1703.3
Turnout 5,11534.6
CIIP gain from Conservative Swing
Canvey Island West
PartyCandidateVotes%±%
Conservative Ray Howard * 1,948 43.1 −7.7
CIIP Peter May1,65536.6New
BNP John Morgan50511.2New
Labour Jackie Reilly3147.0−31.0
Liberal Democrats Ashley Final972.2−5.5
Majority2936.5
Turnout 4,51934.6
Conservative hold Swing
Hadleigh
PartyCandidateVotes%±%
Conservative Jillian Reeves * 2,965 52.0 −3.6
Say No to European UnionBob Eldridge1,02317.9New
Labour Co-op John Trollope5078.9−15.9
Green Lesley Morgan4277.5−0.7
Liberal Democrats Paul Westlake4067.1−4.3
BNP Peter Barber3786.6New
Majority1,94234.0
Turnout 5,70642.3
Conservative hold Swing
South Benfleet
PartyCandidateVotes%±%
Conservative Colin Riley * 2,702 54.0 +3.6
Labour Emma Spicer75715.1−16.2
BNP Mark Cooling65213.0New
Liberal Democrats Jeni Goldfinch4759.5−6.7
Green Nanine Pachy4228.4+6.3
Majority1,94538.8
Turnout 5,00838.7
Conservative hold Swing
Thundersley
PartyCandidateVotes%±%
Conservative Bill Dick * 2,076 43.9 −4.9
UKIP Jean Hulse91619.4New
Labour Co-op Joe Cooke65813.9−22.6
Liberal Democrats Ian Fuller3848.1−2.1
BNP Linda England3737.9New
Green Eileen Peck3196.7+2.2
Majority1,16024.5
Turnout 4,72638.6
Conservative hold Swing

Chelmsford

District Summary

PartySeats+/-Votes%+/-
Liberal Democrat 5Steady2.svg15,36631.6−0.1
Conservative 4Steady2.svg21,47044.1+0.5
Green 0Steady2.svg3,4937.1+2.2
Labour 0Steady2.svg3,2726.7−11.3
BNP 0Steady2.svg3,2036.6+6.6
SWFCTA0Steady2.svg1,0762.2+1.2
UKIP 0Steady2.svg7851.6+1.0

Division Results

Broomfield and Writtle
PartyCandidateVotes%±%
Conservative John Aldridge * 3,234 56.7 +11.3
Liberal Democrats Don Bacon1,17620.6−6.6
Green Reza Hossain4898.6+3.2
BNP Daniel Warden4347.6New
Labour Co-op John Knott3696.5−10.5
Majority2,05836.1
Turnout 5,70239.3
Conservative hold Swing
Chelmer
PartyCandidateVotes%±%
Conservative Peter Martin * 3,431 57.9 +4.4
Liberal Democrats David Whiteing1,16219.6−3.1
Green Eleanor Burgess5899.9+3.4
Labour David Howell3786.4−10.9
BNP Viktor Underwood3666.2New
Majority2,26938.3
Turnout 5,92637.1
Conservative hold Swing
Chelmsford Central
PartyCandidateVotes%±%
Liberal Democrats Margaret Hutchon 2,076 44.5 +6.6
Conservative Robert Pontin1,57033.6−1.7
Green Peter Lynn3818.2+2.3
Labour Jonathan Legg3587.7−13.2
BNP Jay Slaven2846.1New
Majority50610.8
Turnout 4,66939.6
Liberal Democrats hold Swing
Chelmsford North
PartyCandidateVotes%±%
Liberal Democrats Tom Smith-Hughes * 2,418 46.7 +7.6
Conservative Dick Madden1,65932.0−3.3
Labour Co-op Jim Webb4057.8−16.5
Green Angela Thomson3767.3+1.4
BNP Paul Maylin3236.2New
Majority75914.6
Turnout 5,18138.7
Liberal Democrats hold Swing
Chelmsford West
PartyCandidateVotes%±%
Liberal Democrats Jude Deakin 2,040 41.2 +5.2
Conservative James Morgan1,61332.6+3.0
Labour Co-op Joan Bliss54611.0−16.1
BNP Christine Mitchell3767.6New
Green Nelson Brunton3727.5+2.2
Majority4278.6
Turnout 4,94735.5
Liberal Democrats hold Swing
Great Baddow
PartyCandidateVotes%±%
Liberal Democrats Maureen Miller * 2,545 40.9 +1.6
Conservative Janette Potter2,08933.6−3.6
UKIP Jesse Pryke78512.6New
Labour James French3265.2−13.6
Green Colin Budgey2604.2−0.5
BNP Jemma Cutts2163.5New
Majority4567.3
Turnout 6,22140.8
Liberal Democrats hold Swing
South Woodham Ferrers
PartyCandidateVotes%±%
Conservative Norman Hume * 1,808 43.9 −7.6
SWFCTA Ian Roberts1,07626.1+15.6
Liberal Democrats Barry Passingham3939.5−6.9
BNP Victor Scott3598.7New
Labour Margaret Vanner2917.1−11.2
Green Stephanie Bills1934.7+1.4
Majority73217.8
Turnout 4,12032.8
Conservative hold Swing
Springfield
PartyCandidateVotes%±%
Liberal Democrats Michael Mackrory * 2,845 45.7 +4.2
Conservative Paul Hutchinson234037.6−0.7
BNP Bernard Corby4036.5New
Green John Bills3405.5New
Labour Co-op Robert Jones3024.8−15.4
Majority5058.1
Turnout 6,23040.7
Liberal Democrats hold Swing
Stock
PartyCandidateVotes%±%
Conservative Paul White * 3,726 65.7 ±0.0
Liberal Democrats Angela Robinson71112.5−12.2
Green Richard Monk4938.7−0.9
BNP Charlotte Davis4427.8New
Labour Una Norman2975.2New
Majority3,01553.2
Turnout 5,66942.1
Conservative hold Swing

Colchester

District Summary

PartySeats+/-Votes%+/-
Conservative 5Steady2.svg16,44236.1−1.3
Liberal Democrat 4Increase2.svg 115,28233.6+2.3
Labour 1Decrease2.svg 15,49812.1−10.9
Green 0Steady2.svg4,68310.3+3.7
BNP 0Steady2.svg2,6165.7+5.7
UKIP 0Steady2.svg8801.9+1.9
Independent 0Steady2.svg1070.2−1.5

Division Results

Abbey
PartyCandidateVotes%±%
Liberal Democrats Margaret Fisher * 2,384 50.4 +7.5
Green Linda Wonnacott84517.9+6.9
Conservative Darius Laws82817.5−5.4
Labour Rossanna Trudgian3657.7−15.7
BNP John Alfred Key3056.4N/A
Majority1,53932.6
Turnout 4,72731.0
Liberal Democrats hold Swing
Constable
PartyCandidateVotes%±%
Conservative Anne Brown 3,209 51.5 +1.4
UKIP George Curtis88014.1N/A
Liberal Democrats Barry Woodward82113.2−10.4
Green Roger Bamforth5839.4+2.6
Labour David Alexander Hough4066.5−13.0
BNP James Butler2233.6N/A
Independent Bruno Hickman1071.7N/A
Majority2,32937.4
Turnout 6,22942.6
Conservative hold Swing
Drury
PartyCandidateVotes%±%
Conservative Jeremy Lucas * 2,402 40.6 −3.3
Liberal Democrats John Loxley238340.3+7.6
Green Stephen Ford5639.5+2.8
Labour Michael Donnachie3235.5−11.0
BNP Graham Carter2384.0N/A
Majority190.3
Turnout 5,90944.4
Conservative hold Swing
Maypole
PartyCandidateVotes%±%
Liberal Democrats Lyn Barton 1,344 32.3 +0.5
Labour Dave Harris1,22629.4−5.4
Conservative Roger Buston1,02124.5−4.2
BNP Daniel Hack2977.1N/A
Green Pamela Nelson2776.7
Majority1182.1
Turnout 4,16532.5
Liberal Democrats gain from Labour Swing
Mersea and Tiptree
PartyCandidateVotes%±%
Conservative John Jowers * 3,004 56.7 +12.7
Liberal Democrats Jon Longman90017.0+0.8
Green Kathy Bamforth56210.6+6.0
BNP Michael Newbury4378.2N/A
Labour John Wood3957.5−13.3
Majority2,10439.7
Turnout 5,29837.2
Conservative hold Swing
Mile End and Highwoods
PartyCandidateVotes%±%
Liberal Democrats Anne Turrell * 2,509 54.2 +16.1
Conservative Brian Jarvis1,33728.9−8.8
Green Mary Bryan3156.8+1.0
Labour Robert Fisher2625.7−12.7
BNP Benjamin Jones2094.5N/A
Majority1,17225.3
Turnout 4,63234.3
Liberal Democrats hold Swing
Parsons Heath and East Gates
PartyCandidateVotes%±%
Liberal Democrats Theresa Higgins * 2,183 49.3 +5.9
Conservative Christopher Arnold1,18326.7+3.2
Green Maria Iacovou4199.5+4.4
BNP Gary Saveall3287.4N/A
Labour Adam Fox3177.2−14.4
Majority1,00022.6
Turnout 4,43034.7
Liberal Democrats hold Swing
Stanway and Pyefleet
PartyCandidateVotes%±%
Conservative Kevin Bentley 2,394 44.7 +0.4
Liberal Democrats Colin Sykes1,53828.7−2.4
Labour Michael Lilley55110.3−9.7
Green Walter Schwarz53910.1+4.5
BNP Shaun Cuming3316.2N/A
Majority85616.0
Turnout 5,35337.9
Conservative hold Swing
Wivenhoe St Andrew
PartyCandidateVotes%±%
Labour Julie Young * 1,653 34.7 −2.4
Liberal Democrats Mark Cory1,22025.6+2.9
Conservative Eugene Kraft1,06422.3−3.0
Green Chris Fox58012.2+3.2
BNP Samantha Paterson2485.2N/A
Majority4339.1
Turnout 4,76533.0
Labour hold Swing

Epping Forest

District Summary

PartySeats+/-Votes%+/-
Conservative 5Decrease2.svg 116,00943.9−5.2
Liberal Democrat 1Increase2.svg 16,92119.0−3.7
Loughton Residents 1Steady2.svg2,7647.6+2.9
BNP 0Steady2.svg3,80910.4+8.0
Labour 0Steady2.svg2,5487.0−10.5
Green 0Steady2.svg2,1946.0+3.1
UKIP 0Steady2.svg1,5351.9+4.2
English Democrat 0Steady2.svg5051.4+1.4
Independent 0Steady2.svg1770.5+0.5

Division Results

Buckhurst Hill and Loughton South
PartyCandidateVotes%±%
Conservative Valerie Metcalfe 2,601 40.1 −8.7
Liberal Democrats Ann Haigh1,95230.1−5.0
UKIP Gerard Wadsworth6379.8New
Green Steven Neville3926.0New
BNP Alexander Copland3705.7New
Labour Tom Owen3595.5−10.6
Independent Neville Wright1772.7New
Majority64910.0
Turnout 6,48841.4
Conservative hold Swing
Chigwell and Loughton Broadway
PartyCandidateVotes%±%
Conservative John Knapman 2,363 53.2 +3.4
Labour Ruth Montefiore61813.9−6.7
BNP Edward Butler 54012.2+3.9
Liberal Democrats Katie Holmes50911.5−6.4
Green Chris Lord4109.2+5.8
Majority1,74539.3
Turnout 4,44033.9
Conservative hold Swing
Epping and Theydon Bois
PartyCandidateVotes%±%
Liberal Democrats Janet Whitehouse 2,481 42.3 +1.9
Conservative James Surguy2,08035.5−6.4
UKIP Andrew Smith5819.9New
BNP Tony Frankland3065.2New
Green Daniel Kieve2193.7+0.3
Labour Simon Bullough1923.3−6.6
Majority4016.8
Turnout 5,85945.9
Liberal Democrats gain from Conservative Swing
Loughton Central
PartyCandidateVotes%±%
Loughton Residents Chris Pond * 2,764 55.2 +20.0
Conservative Mitchell Cohen91118.2−9.8
BNP Rodney Law52910.6+0.7
UKIP Michael McGough3176.3New
Labour Martin Lawford2505.0−12.2
Green Jesse Briton1202.4−1.1
Liberal Democrats Christopher Spence1172.3−3.9
Majority1,85337.0
Turnout 5,00837.6
Loughton Residents hold Swing
North Weald and Nazeing
PartyCandidateVotes%±%
Conservative Anthony Jackson * 3,119 61.0 +2.7
BNP Julian Leppert61212.0New
Liberal Democrats Matthew Lake52410.2−7.7
Green Nicola Harries4428.6+3.0
Labour Kelvin Morris4198.2−10.0
Majority2,50749.0
Turnout 5,11637.9
Conservative hold Swing
Ongar and Rural
PartyCandidateVotes%±%
Conservative Gerard McEwen * 2,358 53.0 −5.3
Liberal Democrats Derek Jacobs65614.7−3.2
English Democrat Robin Tilbrook 50511.3New
BNP Peter Turpin3808.5New
Green Jessica Barnecutt2886.5+0.9
Labour Sheila Spring2656.0−12.2
Majority1,70238.2
Turnout 4,45237.3
Conservative hold Swing
Waltham Abbey
PartyCandidateVotes%±%
Conservative Liz Webster * 2,577 50.5 −6.1
BNP Patricia Richardson 1,07221.0New
Liberal Democrats Pat Brooks68213.4−0.9
Labour Mitch Diamond-Conway4458.7−15.5
Green Nicky Fuller3236.3+1.5
Majority1,50529.5
Turnout 5,09931.3
Conservative hold Swing

Harlow

District Summary

PartySeats+/-Votes%+/-
Conservative 4Increase2.svg 39,96835.3−1.9
Labour 0Decrease2.svg 37,36326.1−15.3
Liberal Democrat 0Steady2.svg4,93917.5+0.3
BNP 0Steady2.svg4,09214.5+14.5
Green 0Steady2.svg1,8586.6+2.5

Division Results

Harlow North
PartyCandidateVotes%±%
Conservative Michael Garnett 1,838 33.2 −0.6
Labour Paul Sztumpf *1,37824.9−17.2
Liberal Democrats Ian Jackson1,12920.4+1.7
BNP Geoffrey Williams71612.9New
Green Robert King4728.5+3.1
Majority4608.3
Turnout 5,53335.4
Conservative gain from Labour Swing
Harlow South East
PartyCandidateVotes%±%
Conservative Eddie Johnson * 1,956 40.8 −0.7
Labour Mike Danvers98320.5−17.1
Liberal Democrats Linda Pailing85917.9+0.6
BNP Thomas Richardson67714.1New
Green Suzzanne King3206.7+3.1
Majority97320.3
Turnout 4,79532.5
Conservative hold Swing
Harlow West
PartyCandidateVotes%±%
Conservative Lee Dangerfield 3,235 36.2 –1.4
Conservative Guy Mitchinson 2,939 32.9 –3.6
Labour Tony Durcan *2,54928.5−14.0
Labour Jenny Holland *2,45327.4–14.7
Liberal Democrats Tim Sanderson1,50416.8−0.7
Liberal Democrats Manny Doku1,44716.2+0.2
BNP Paul Richard Evans1,38115.4N/A
BNP Scott Cato1,31814.7N/A
Green Cheryl Gerrard1,06611.9+4.1
Turnout 17,89232.7
Conservative gain from Labour

Maldon

District Summary

PartySeats+/-Votes%+/-
Conservative 3Steady2.svg8,51846.9−4.4
Liberal Democrat 0Steady2.svg2,22712.3−4.9
Green 0Steady2.svg1,84310.2+2.5
Labour 0Steady2.svg1,5398.5−15.3
BNP 0Steady2.svg1,4668.1+8.1
UKIP 0Steady2.svg1,3767.6+7.6
Independent 0Steady2.svg1,1806.5+6.5

Division Results

Heybridge and Tollesbury
PartyCandidateVotes%±%
Conservative Rodney Bass * 3,338 53.9
Liberal Democrats Matthew Bellard99216.0
Green Robert Graves80313.0
BNP Adrian Litscher5859.4
Labour Norman Hunt4737.6
Majority2,34637.9
Turnout 6,19139.6
Conservative hold Swing
Maldon
PartyCandidateVotes%±%
Conservative Penny Channer 2,359 41.6
Independent Brian Mead *1,18020.8
Liberal Democrats Christopher Crowther62111.0
Green Janet Carden60010.6
Labour Michael Bentley5159.1
BNP Len Blain3916.9
Majority1,17920.8
Turnout 5,66639.2
Conservative hold Swing
Southminster
PartyCandidateVotes%±%
Conservative Bob Boyce * 2,821 44.8
UKIP Tim Drain1,37621.9
Liberal Democrats Marian Elsden6149.8
Labour Pauline Wells5518.8
BNP Nev Saveall4907.8
Green Jonathan King4407.0
Majority1,44523.0
Turnout 6,29235.8
Conservative hold Swing

Rochford

District Summary

PartySeats+/-Votes%+/-
Conservative 5Steady2.svg11,71849.1−1.0
Liberal Democrat 0Steady2.svg4,44918.6−1.9
BNP 0Steady2.svg2,75111.5+11.5
Labour 0Steady2.svg1,8237.6−15.8
English Democrats 0Steady2.svg1,5656.6+6.6
Green 0Steady2.svg1,1354.8−1.3
UKIP 0Steady2.svg4161.7+1.7

Division Results

Rayleigh North
PartyCandidateVotes%±%
Conservative Stephen Castle * 2,095 38.3
Liberal Democrats Chris Black1,73931.8
English Democrat John Hayter71813.1
UKIP Tony Smith4167.6
BNP Lisa Byrne2785.1
Labour David Bodimeade2264.1
Majority3566.5
Turnout 5,47241.8
Conservative hold Swing
Rayleigh South
PartyCandidateVotes%±%
Conservative Mavis Webster * 2,165 48.9
English Democrat Paula Hayter84719.1
Liberal Democrats Lindsay Frend77717.6
BNP Donna-Marie Loughran3477.8
Labour Alan Bennett2896.5
Majority1,31829.8
Turnout 4,42535.4
Conservative hold Swing
Rochford North
PartyCandidateVotes%±%
Conservative Tracey Chapman * 2,490 51.7
BNP John Curtin70514.6
Liberal Democrats Debbie Taylor67914.1
Green Andrew Vaughan61812.8
Labour David Kirkman3286.8
Majority1,78537.0
Turnout 4,82037.4
Conservative hold Swing
Rochford South
PartyCandidateVotes%±%
Conservative Roy Pearson * 1,996 51.1
BNP Earl Strobridge54714.0
Green Douglas Copping51713.2
Labour David Lench49112.6
Liberal Democrats Lester Wakeling3549.1
Majority1,44937.1
Turnout 3,90532.2
Conservative hold Swing
Rochford West
PartyCandidateVotes%±%
Conservative Bonnie Hart * 2,972 56.8
Liberal Democrats Sid Cumberland90017.2
BNP Sandra Matthews87416.7
Labour Angelina Marriott4899.3
Majority2,07239.6
Turnout 5,23538.2
Conservative hold Swing

Tendring

District Summary

PartySeats+/-Votes%+/-
Conservative 8Increase2.svg 317,02041.1+0.2
Tendring First 0Steady2.svg5,86614.2+14.2
Liberal Democrat 0Steady2.svg4,75811.5−7.3
Labour 0Decrease2.svg 24,65211.2−16.0
BNP 0Steady2.svg3,9749.6+9.6
Green 0Steady2.svg2,9727.2+2.7
CRP0Decrease2.svg 11,5233.7−5.5
UKIP 0Steady2.svg8922.2+2.2

Division Results

Brightlingsea
PartyCandidateVotes%±%
Conservative Derek Robinson * 2,387 43.0 −2.1
Liberal Democrats Gary Scott157728.4+3.9
Labour Co-op Tracey Osben58810.6−14.6
BNP Jim Taylor5379.7New
Green Stephen Whiteman4688.4+3.2
Majority81014.6
Turnout 5,55739.0
Conservative hold Swing
Clacton East
PartyCandidateVotes%±%
Conservative Linda Mead 2,270 42.6 −8.7
Tendring First Pierre Oxley *1,36125.5New
BNP Keith Beaumont62611.8New
Labour Norman Jacobs5089.5−19.3
Green Eleanor Mary Gordon3256.1+3.0
Liberal Democrats Dominique Azid2384.5−9.8
Majority90917.1
Turnout 5,32840.7
Conservative hold Swing
Clacton North
PartyCandidateVotes%±%
Conservative Stephen Mayzes 1,566 39.8 +9.0
Liberal Democrats Brian Whitson78219.9−4.6
BNP Loraine Henry65116.6New
Labour Co-op Delia Aldis64916.5−22.9
Green Robbie Spence2827.2+4.8
Majority78419.9
Turnout 3,93031.4
Conservative gain from Labour Swing
Clacton West
PartyCandidateVotes%±%
Conservative Chris Griffiths 1,639 40.0 +10.9
Tendring First Kevin Watson69416.9New
BNP Tracey Worsley60614.8New
Labour Co-op Roy Raby46911.4−15.8
Liberal Democrats John Candler3488.5−2.4
Green Clare Palmer2235.4+3.4
Community Representative Kenneth Sargeant1233.0−27.8
Majority94523.0
Turnout 4,10235.5
Conservative gain from Community Representative Swing
Frinton and Walton
PartyCandidateVotes%±%
Conservative Mick Page * 3,215 46.2 −10.6
Tendring First Terry Allen2,25332.4New
BNP Pat Henry5007.2New
Green Sandra Moog5007.2+3.9
Labour Co-op James Osben4957.1−17.4
Majority96213.8
Turnout 6,96345.6
Conservative hold Swing
Harwich
PartyCandidateVotes%±%
Conservative Ricky Callender 1,746 36.5 +15.8
Community Representative Steven Henderson1,11523.3−8.0
Labour Co-op Les Double *99620.8−21.5
BNP Anthony Evennett3316.9New
Liberal Democrats Kate Douglas3026.3New
Green Frank Barton2936.1+0.4
Majority63113.2
Turnout 4,78337.0
Conservative gain from Labour Swing
Tendring Rural East
PartyCandidateVotes%±%
Conservative Mick Skeels 2,002 35.3 −4.8
Tendring First Mark Cossens *1,27122.4New
Labour Charlie Powell58910.4−20.9
Liberal Democrats Joyce O'Brien5289.3−13.4
BNP Peter Hack5189.1New
Green Chris Southall4477.9+4.9
Community Representative Tony Colbourne2534.5+2.3
Majority73112.9
Turnout 5,60838.7
Conservative hold Swing
Tendring Rural West
PartyCandidateVotes%±%
Conservative Sarah Candy * 2,195 40.8 −5.1
Liberal Democrats Ann Elvin98318.3−20.4
UKIP David Macdonald89216.6New
Green Duncan Gordon4348.1−2.2
Labour John Ford3586.6New
Tendring First Jack Robertson2875.3New
BNP Debbie Hack2053.8New
Community Representative Martyn Donn320.6−4.4
Majority1,21222.5
Turnout 5,38640.9
Conservative hold Swing

Uttlesford

District Summary

PartySeats+/-Votes%+/-
Conservative 4Steady2.svg12,92152.6+4.3
Liberal Democrat 0Steady2.svg6,03124.6−9.4
Green 0Steady2.svg2,58810.5+3.6
BNP 0Steady2.svg1,3835.6+5.6
Labour 0Steady2.svg1,3015.3−4.3
English Democrat 0Steady2.svg3351.4+1.4

Division Results

Dunmow
PartyCandidateVotes%±%
Conservative Susan Barker * 3,780 60.9 +5.1
Liberal Democrats Alan Thawley90614.6−21.1
Green Simon Whittle63210.2+1.7
BNP Lynne Turpin5008.1New
Labour Bill McCarthy3906.3New
Majority2,87446.3
Turnout 6,20838.3
Conservative hold Swing
Saffron Walden
PartyCandidateVotes%±%
Conservative Robert Chambers * 3,287 50.6 +8.7
Liberal Democrats Richard Freeman150623.2−8.3
Green Trilby Roberts89113.7+6.9
Labour Yvonne Morton4837.4−7.9
BNP Susan Clapp3325.1New
Majority1,78127.4
Turnout 6,49942.3
Conservative hold Swing
Stansted
PartyCandidateVotes%±%
Conservative Ray Gooding * 2,748 43.6 ±0.0
Liberal Democrats Alan Dean2,65142.0+0.1
Green Karmel Stannard4216.7+2.1
BNP George Martin2884.6New
Labour Barbara Light1983.1−6.9
Majority971.5
Turnout 6,30646.7
Conservative hold Swing
Thaxted
PartyCandidateVotes%±%
Conservative Simon Walsh * 3,106 56.0 +3.4
Liberal Democrats Ron Clover96817.5−8.9
Green Peter Vernon64411.6+4.0
English Democrat Gloria Meredew3356.0New
BNP Edward Long2634.7New
Labour Yad Zanganah2304.1−9.3
Majority2,13838.6
Turnout 5,54641.3
Conservative hold Swing

By-elections

Harlow West

A by-election was held following the disqualification of Cllr Lee Dangerfield (Conservative) for non-attendance.

Harlow West: 5 May 2011 [7]
PartyCandidateVotes%±%
Labour Tony Durcan 5,320 48.4 +22.2
Conservative Mark Gough4,56441.6+8.4
Liberal Democrats John Strachan1,10010.0–5.4
Majority7566.8N/A
Turnout 10,984
Labour gain from Conservative Swing Increase2.svg6.9

No BNP (14.2%) or Green (11.0%) candidates as previous.

Chelmsford Central

A by-election was called following the death of Cllr Margaret Hutcheon (Liberal Democrat).

Chelmsford Central: 9 June 2011 [8]
PartyCandidateVotes%±%
Conservative Dick Madden 1,496 43.6 +10.0
Liberal Democrats Graham Pooley1,32338.6–5.9
Labour Russell Kennedy61017.8+10.1
Majority1735.0N/A
Turnout 3,429
Conservative gain from Liberal Democrats Swing Increase2.svg8.0

No Green (8.2%) or BNP (6.1%) candidates as previous.

Stock

A by-election was called due to the disqualification of Cllr Paul White, Lord Hanningfield (Conservative) after he was sentenced to nine months in prison for false accounting. [9]

Stock: 8 September 2011 [10]
PartyCandidateVotes%±%
Conservative Ian Grundy 1,820 59.3 –6.4
UKIP Jesse Pryke73624.0N/A
Labour Maurice Austin2759.0+3.8
Liberal Democrats Marian Elsden1605.2–7.3
Green Reza Hossain802.6–6.1
Majority1,08435.3–17.9
Turnout 3,071
Conservative hold Swing N/A

No BNP candidate as previous (7.8%).

Chelmsford North

A by-election was called due to the death of Cllr Tom Smith-Hughes (Liberal Democrat).

Chelmsford North: 28 June 2012 [11]
PartyCandidateVotes%±%
Liberal Democrats Stephen Robinson 1,614 42.1 –4.6
Conservative Robert Pontin94124.5–7.5
Labour Nastassia Player71118.5+10.7
UKIP Leslie Retford43511.3N/A
Green Reza Hossain1343.5–3.8
Majority67317.6+3.0
Turnout 3,835
Liberal Democrats hold Swing Increase2.svg1.5

No BNP candidate as previous (6.2%).

Related Research Articles

<span class="mw-page-title-main">Chelmsford (UK Parliament constituency)</span> Parliamentary constituency in the United Kingdom, 2010 onwards

Chelmsford is a constituency in Essex represented in the House of Commons of the UK Parliament since 2024 by Marie Goldman of the Liberal Democrats.

<span class="mw-page-title-main">2005 Suffolk County Council election</span> 2005 UK local government election

Elections to Suffolk County Council were held on 5 May 2005. The whole council was up for election with boundary changes since the last election in 2001 reducing the number of seats by 5. The Conservative Party gained control of the council from no overall control.

<span class="mw-page-title-main">2010 Barking and Dagenham London Borough Council election</span> 2010 local election in England

The 2010 Barking and Dagenham Council election took place on 6 May 2010 to elect members of Barking and Dagenham London Borough Council in London, England.

<span class="mw-page-title-main">2009 Suffolk County Council election</span> 2009 UK local government election

Elections to Suffolk County Council were held on 4 June 2009 as part of the 2009 United Kingdom local elections on the same day as the elections to the European Parliament. 75 councillors were elected from 63 electoral divisions, which returned either one or two county councillors each by first-past-the-post voting for a four-year term of office. The electoral divisions were the same as those used at the previous election in 2005.

<span class="mw-page-title-main">2009 Cumbria County Council election</span> 2009 UK local government election

An election to Cumbria County Council took place on 2 May 2009 as part of the 2009 United Kingdom local elections. All 84 councillors were elected from various electoral divisions, which returned one or two county councillors each by first-past-the-post voting for a four-year term of office. They coincided with an election for the European Parliament. All 84 seats in the Council were up for election, and a total of 301 candidates stood. The total number of people registered to vote was 392,931. Prior to the election local Conservatives were leading a coalition with the Liberal Democrats with the Labour party as the council's official opposition.

<span class="mw-page-title-main">2009 Cornwall Council election</span>

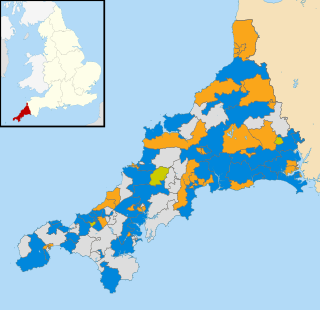
The Cornwall Council election, 2009, was an election for all 123 seats on the council. Cornwall Council is a unitary authority that covers the majority of the ceremonial county of Cornwall, with the exception of the Isles of Scilly which have an independent local authority. The elections took place concurrently with other local elections across England and Wales as well as the UK component of the elections to the European Parliament. Cornwall had seen its district and county councils abolished, replaced by a single 123-member Cornish unitary authority, for which councillors were elected for a full term.

<span class="mw-page-title-main">2002 Basildon District Council election</span> 2002 UK local government election

The 2002 Basildon District Council election took place on 2 May 2002 to elect members of Basildon District Council in Essex, England. The whole council was up for election with boundary changes since the last election in 2000. The council stayed under no overall control.

<span class="mw-page-title-main">2011 Basildon Borough Council election</span> 2011 UK local government election

The 2011 Basildon Council election took place on 5 May 2011 to elect members of Basildon Borough Council in Essex, England. One third of the council was up for election and the Conservative party stayed in overall control of the council.

<span class="mw-page-title-main">2012 England and Wales police and crime commissioner elections</span> Local elections in England and Wales

The 2012 police and crime commissioner elections were polls held in most police areas in England and Wales on Thursday 15 November. The direct election of police and crime commissioners (PCCs) was originally scheduled for May 2012 but was postponed in order to secure the passage of the Police Reform and Social Responsibility Act 2011 through the House of Lords. The government considers the elected commissioners to have a stronger mandate than the "unelected and invisible police authorities that they replace". The elections took place alongside by-elections for the House of Commons in Cardiff South and Penarth, Corby and Manchester Central, and a mayoral election in Bristol.

<span class="mw-page-title-main">2013 Cambridgeshire County Council election</span> 2013 UK local government election

An election to Cambridgeshire County Council took place on 2 May 2013 as part of the 2013 United Kingdom local elections. 69 councillors were elected from 60 electoral divisions, which returned either one or two county councillors each by first-past-the-post voting for a four-year term of office. The electoral divisions were the same as those used at the previous election in 2009. No elections were held in Peterborough, which is a unitary authority outside the area covered by the County Council. The election saw the Conservative Party lose overall control of the council.

<span class="mw-page-title-main">2013 Essex County Council election</span> 2013 UK local government election

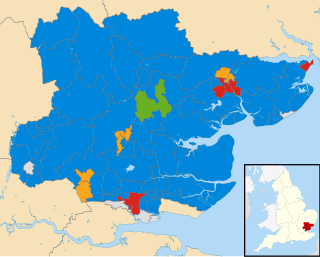
The 2013 Essex County Council election took place on 2 May 2013 to elect members of Essex County Council in Essex, England. They were held on the same day as other local elections. 75 councillors were elected from 70 electoral divisions, which returned either one or two county councillors each by first-past-the-post voting for a four-year term of office. The electoral divisions were the same as those used at the previous election in 2009. No elections were held in Thurrock or Southend-on-Sea, which are unitary authorities outside the area covered by the County Council.

<span class="mw-page-title-main">2013 Suffolk County Council election</span> 2013 UK local government election

Elections to Suffolk County Council took place on 2 May 2013 as part of the 2013 United Kingdom local elections. 75 councillors were elected from 63 electoral divisions, which returned either one or two county councillors each by first-past-the-post voting for a four-year term of office. The electoral divisions were the same as those used at the previous election in 2009.

<span class="mw-page-title-main">2005 Essex County Council election</span> English local authority election

An election to Essex County Council took place on 9 May 2005 as part of the 2005 United Kingdom local elections. 75 councillors were elected from various electoral divisions, which returned either one or two county councillors each by first-past-the-post voting for a four-year term of office. The electoral divisions were redrawn for this election.

An election to Essex County Council took place on 7 June 2001 as part of the 2001 United Kingdom local elections. 79 councillors were elected from various electoral divisions, which returned either one or two county councillors each by first-past-the-post voting for a four-year term of office. The electoral divisions were the same as those used at the previous election in 1997.

An election to Essex County Council took place on 1 May 1997 as part of the 1997 United Kingdom local elections. 79 councillors were elected from various electoral divisions, which returned either one or two county councillors each by first-past-the-post voting for a four-year term of office. With the creation of Southend-on-Sea Borough Council and Thurrock Council in 1998 the number of seats contested at this election was reduced by 19. In 1993 the breakdown of these seats were, Lab 9 Con 5 LD 5.

<span class="mw-page-title-main">2017 Essex County Council election</span> 2017 UK local government election

Elections to Essex County Council took place on 4 May 2017 as part of the 2017 local elections. All 75 councillors were elected from 70 electoral divisions, which each returned either one or two councillors by first-past-the-post voting for a four-year term of office.

<span class="mw-page-title-main">2021 Essex County Council election</span> 2021 UK local government election

The 2021 Essex County Council election took place on 6 May 2021 as part of the 2021 United Kingdom local elections. All 75 councillors were elected from 70 electoral divisions, with each returning either one or two councillors by first-past-the-post voting for a four-year term of office.

<span class="mw-page-title-main">2022 Dumfries and Galloway Council election</span> Dumfries and Galloway Council election

Elections to Dumfries and Galloway Council took place on 5 May 2022 on the same day as the 31 other Scottish local government elections. As with other Scottish council elections, it was held using single transferable vote (STV) – a form of proportional representation – in which multiple candidates are elected in each ward and voters rank candidates in order of preference.

<span class="mw-page-title-main">2022 Angus Council election</span> Angus Council election

Elections to Angus Council took place on 5 May 2022, the same day as the 31 other Scottish local government elections. As with other Scottish council elections, it was held using single transferable vote (STV) – a form of proportional representation – in which multiple candidates are elected in each ward and voters rank candidates in order of preference.

<span class="mw-page-title-main">2022 Aberdeenshire Council election</span> Aberdeenshire Council election

Elections to Aberdeenshire Council took place on Thursday 5 May 2022 on the same day as the 31 other Scottish local government elections. As with other Scottish council elections, it was held using single transferable vote (STV) – a form of proportional representation – in which multiple candidates are elected in each ward and voters rank candidates in order of preference.

References

  1. "The Representation of the People (Form of Canvass) (England and Wales) Regulations 2006, Schedule Part 1". Legislation.gov.uk. 13 October 2011. Retrieved 18 April 2012.
  2. "I have two homes. Can I register at both addresses?". The Electoral Commission. Archived from the original on 7 May 2019. Retrieved 5 January 2011.
  3. "Local Elections Archive Project - 2009 - Essex".
  4. "Essex County Council opposition leader Tom Smith-Hughes dies". bbc.co.uk. BBC. 19 April 2012. Retrieved 13 April 2022.
  5. "Tom Smith-Hughes: a life serving the community - Lib Dem tribute". 24 April 2012. Retrieved 13 April 2022.
  6. "Charged leader of council resigns". BBC News. 5 February 2010.
  7. "Harlow West Division - Essex". Andrew Teale. Local Elections Archive Project. Retrieved 11 January 2023.
  8. "Chelmsford Central Division - Essex". Andrew Teale. Local Elections Archive Project. Retrieved 11 January 2023.
  9. "Lord Hanningfield jailed for nine months". Caroline Davies. The Guardian. 1 July 2011. Retrieved 11 January 2023.
  10. "Stock Division - Essex". Andrew Teale. Local Elections Archive Project. Retrieved 11 January 2023.
  11. "Chelmsford North Division - Essex". Andrew Teale. Local Elections Archive Project. Retrieved 11 January 2023.