2009 Isle of Wight Council election

Last updated

2009 local election results on the Isle of Wight Isle of Wight wards 2009.svg
2009 local election results on the Isle of Wight
The composition of the Isle of Wight Council after the 2009 election. Composition of the Isle of Wight Council after the 2009 election.jpg
The composition of the Isle of Wight Council after the 2009 election.

The 2009 Isle of Wight Council elections were held on Thursday 4 June 2009.

Contents

After a review by the Local Government Boundary Commission for England, the number of seats on the council was reduced from 48 single-member wards, to a 40-member council, consisting of 38 single member wards, and one double-member ward. [1]

Overview

The result of the election was 'no change', with the Conservatives retaining an overall majority by winning twenty-four of the forty seats available. Of the sixteen remaining seats, ten went to independents, five to the Liberal Democrats and just one to the Labour Party. [2] Although the Conservatives managed to retain control, the Isle of Wight was still the only council in England in which they lost seats. [3] Among the factors which could have led to this relatively poor performance are the recent education reforms on the Isle of Wight, which led to protests over the closure of island primary schools. The "Standards not Tiers" independent candidate Chris Welsford beat the sitting Conservative councillor Jonny Fitzgerald-Bond by 141 votes in the Ventnor East ward. In the Cowes West and Gurnard ward, which was at the heart of education reforms, sitting Tory councillor Alan Wells was beaten by independent candidate Paul Fuller. [2] The large numbers of independent candidates standing at this election and the increased level of support for them could also be attributed to the ongoing United Kingdom Parliamentary expenses scandal, pushing voters away from the mainstream political parties represented in the House of Commons.

Results

The party standings following the election:

Party2005 Cllrs2005 Cllrs, restated [4] Gain/Loss2009 Cllrs
Conservative Party 3529−524
Independents 54+37
Liberal Democrats 54+15
Labour Party 22−11
Others [5] 11+23
Total484040

Ward results

The following are results from each electoral ward. [6]

Arreton and Newchurch
PartyCandidateVotes%±%
Liberal Democrats Colin Richards69151.68
Conservative Erica Oulton64648.31
Turnout 133744.62
Binstead and Fishbourne
PartyCandidateVotes%±%
Conservative Ivan Bulwe51942.47
Independent Ivor Warlow51542.14
Liberal Democrats Tony Zeid18815.38
Turnout 122245.17
Brading, St Helens and Bembridge (two seats)
PartyCandidateVotes%±%
Independent Patrick Joyce1444
Independent Jonathan Bacon1289
Conservative Sally Pigot1117
Conservative Joe Robertson1097
Liberal Democrats Anouska Blake406
Liberal Democrats David Cleaver338
Turnout 439148.49
Carisbrooke
PartyCandidateVotes%±%
Conservative John Hobart583
Independent Barbara Foster475
Turnout 105841.27
Central Wight
PartyCandidateVotes%±%
Conservative Peter Bingham894
Liberal Democrats Jill Wareham732
Turnout 162657.98
Chale, Niton and Whitwell
PartyCandidateVotes%±%
Conservative William Wyatt-Millington641
Liberal Democrats Malcolm Groves404
Turnout 104545.27
Cowes Medina
PartyCandidateVotes%±%
Conservative Lora Peacy-Wilcox617
Liberal Democrats Hugh Reid148
Labour Steve Cooper121
Turnout 88630.74
Cowes North
PartyCandidateVotes%±%
Conservative George Brown542
Independent Wendy Wardrop276
Labour Peter Laugharne98
Turnout 91635.27
Cowes South and Northwood
PartyCandidateVotes%±%
Conservative Roger Mazillius987
Liberal Democrats Charlotte Witheridge230
Labour Nicholas Wray85
Turnout 130245.53
Cowes West and Gurnard
PartyCandidateVotes%±%
Independent Paul Fuller819
Conservative Alan Wells649
Turnout 146847.99
East Cowes
PartyCandidateVotes%±%
Conservative Margaret Webster642
Liberal Democrats Margaret Lloyd543
Labour Jane McKean68
Turnout 125342.07
Freshwater North
PartyCandidateVotes%±%
Conservative Andy Sutton541
Liberal Democrats Martin Wareham226
Labour Clive Burland134
Turnout 90139.20
Freshwater South
PartyCandidateVotes%±%
Conservative George Cameron435
Liberal Democrats John Medland389
Independent David Baggott245
Turnout 106944.53
Godshill and Wroxall
PartyCandidateVotes%±%
Independent Rodney Downer570
Conservative Alison Child509
Liberal Democrats Dave Hardy112
Turnout 119145.14
Havenstreet, Ashey and Haylands
PartyCandidateVotes%±%
Independent Vanessa Churchman420
Conservative Conrad Gauntlett395
Liberal Democrats Richard Fraser-Tait210
Turnout 102537.27
Lake North
PartyCandidateVotes%±%
Conservative Jerry White401
Liberal Democrats Peter Harris356
Labour Deborah Gardiner333
Turnout 109039.11
Lake South
PartyCandidateVotes%±%
Conservative Tim Hunter-Henderson591
Liberal Democrats John Fleming301
Labour Alan Hollands128
BNP Dot Clynch89
Turnout 110942.46
Nettlestone and Seaview
PartyCandidateVotes%±%
Liberal Democrats Reg Barry855
Conservative Diana Tuson607
Turnout 146254.57
Newport Central
PartyCandidateVotes%±%
Conservative Julie Jones-Evans291
Liberal Democrats Andrew Garratt186
Independent Jackie Hawkins157
Independent Julian Whittaker103
Labour Andy Woodhouse70
Turnout 80728.46
Newport East
PartyCandidateVotes%±%
Labour Geoff Lumley449
Conservative Peter Humber191
Liberal Democrats Cathy Wright73
Turnout 71330.31
Newport North
PartyCandidateVotes%±%
Conservative Dawn Cousins508
Liberal Democrats Peter Whiteman342
Turnout 85034.07
Newport South
PartyCandidateVotes%±%
Conservative Roger Dixcey395
Liberal Democrats Shirley Smart315
Labour David Stott135
Turnout 84532.29
Newport West
PartyCandidateVotes%±%
Conservative David Whittaker501
Independent Brian Rushton182
Liberal Democrats Mike Carr165
Turnout 84837.32
Parkhurst
PartyCandidateVotes%±%
Conservative Richard Hollis312
Liberal Democrats Garry Price185
Independent Clive Page145
Labour Steve Falla63
Turnout 70529.75
Ryde East
PartyCandidateVotes%±%
Liberal Democrats Dave Knowles626
Conservative Peter Tuson479
Turnout 110538.67
Ryde North East
PartyCandidateVotes%±%
Independent Wayne Whittle364
Conservative Adrian Axford318
Liberal Democrats Henry Adams285
Turnout 96733.56
Ryde North West
PartyCandidateVotes%±%
Conservative Arthur Taylor531
Liberal Democrats Tim Wakeley441
Turnout 97233.53
Ryde South
PartyCandidateVotes%±%
Liberal Democrats Adrian Whittaker275
Independent Charles Chapman263
Conservative Gary Axford217
Labour Ernest 'Jim' White67
Turnout 82228.61
Ryde West
PartyCandidateVotes%±%
Independent Ian Stephens652
Conservative Sarah Doran249
Liberal Democrats John Timmons209
Turnout 111039.20
Sandown North
PartyCandidateVotes%±%
Independent Heather Humby747
Conservative Rajesh Patel179
Turnout 92639.46
Sandown South
PartyCandidateVotes%±%
Conservative Ian Ward547
Liberal Democrats Bob Blezzard283
Independent Richard Davis177
Labour Eric Goacher43
Turnout 105035.19
Shanklin Central
PartyCandidateVotes%±%
Conservative David Williams634
Independent Lincoln Wyatt231
Liberal Democrats Sara Sheath191
Labour Doreen Armstrong61
Turnout 111735.95
Shanklin South
PartyCandidateVotes%±%
Conservative David Pugh 804
Liberal Democrats Lynda Fleming161
Independent Anne Bishop156
Labour Peter Coleman58
Turnout 117940.46
Totland
PartyCandidateVotes%±%
Liberal Democrats John Howe442
Conservative David Eccles396
Independent Carol Bryan304
Turnout 114246.17
Ventnor East
PartyCandidateVotes%±%
Independent Chris Welsford503
Conservative Jonathan Fitzgerald-Bond362
Liberal Democrats Harry Rees150
Turnout 101540.15
Ventnor West
PartyCandidateVotes%±%
Conservative Susan Scoccia562
Independent Stephen Stubbings555
Liberal Democrats Wendy Ford86
Turnout 120347.18
West Wight
PartyCandidateVotes%±%
Independent Stuart Dyer719
Conservative Bill Burt624
Turnout 134346.04
Whippingham and Osborne
PartyCandidateVotes%±%
Conservative Edward Giles414
Independent Charles Hancock398
Liberal Democrats Peter Lloyd235
Labour Laraine Pascoe60
Turnout 110737.63
Wootton Bridge
PartyCandidateVotes%±%
Conservative Barry Abraham866
Liberal Democrats Ernest Smith290
Turnout 115641.22

See also

Related Research Articles

<span class="mw-page-title-main">Isle of Wight Council</span> Principal local authority of the Isle of Wight

The Isle of Wight Council, known until 1995 as Isle of Wight County Council, is the unitary authority which governs the county of the Isle of Wight in South East England. The council is controlled by the Alliance Group, a coalition of Independent, Green, Independent Network, and Our Island councillors. Its headquarters is County Hall in Newport.

As a geographical entity distinct from the mainland, the Isle of Wight has always fought to have this identity recognised. The Isle of Wight is currently a ceremonial and Non-metropolitan county and local government is by unitary authority. The island is also the highest populated Westminster constituency in the country.

<span class="mw-page-title-main">2004 Wyre Forest District Council election</span> Election in Worcestershire, England

The 2004 Wyre Forest District Council election took place on 10 June 2004 to elect members of Wyre Forest District Council in Worcestershire, England. The whole council was up for election with boundary changes since the last election in 2003. The council stayed under no overall control, but with the Conservatives taking over as the largest party on the council from the Health Concern party.

<span class="mw-page-title-main">David Pugh (Conservative politician)</span>

David Pugh is a former Conservative councillor and served as leader of the Isle of Wight Council between September 2007 and May 2013, making him the longest serving leader of the local authority since its inception in 1995. He was first elected to the Isle of Wight Council at the local elections in May 2005 as a member for the Shanklin Central Ward, re-elected in the June 2009 elections to the Shanklin South Ward, losing his seat in the 2013 local elections after 2 other candidates withdrew, making the election a straight choice between Pugh and Independent, Richard Priest. Consequently, he ceased to be council leader.

<span class="mw-page-title-main">2013 Cornwall Council election</span>

The Cornwall Council election, 2013, was an election for all 123 seats on the council. Cornwall Council is a unitary authority that covers the majority of the ceremonial county of Cornwall, with the exception of the Isles of Scilly which have an independent local authority. The elections took place concurrently with other local elections across England and Wales.

<span class="mw-page-title-main">2013 Isle of Wight Council election</span>

The 2013 Isle of Wight Council election was held on 2 May 2013 to elect all 40 members for a four-year term to the Isle of Wight Council, a unitary authority which governs the Isle of Wight. Going into the election, the Conservative Party was looking to gain a third term in power after first being elected to overall control in 2005, but in one of the shock results of the wider local elections being held in the country, the Conservatives lost overall control of the council, having been reduced to 15 seats, 6 short of a majority of 21. The 'Island Independents', a mutually supporting group of candidates and councillors running as independents, gained the same number of seats, whilst other independents, UKIP, Labour, and a Liberal Democrat made up the remainder.

<span class="mw-page-title-main">2019 United Kingdom local elections</span> Elections to local councils and mayoralties

The 2019 United Kingdom local elections took place on Thursday 2 May 2019, with 248 English local councils, six directly elected mayors in England, and all 11 local councils in Northern Ireland being contested.

<span class="mw-page-title-main">2019 Fenland District Council election</span> 2019 local election in Fenland, Cambridgeshire, England

The 2019 Fenland District Council election took place on 2 May 2019 for all 39 seats of the Fenland District Council in England. It was held on the same day as other local elections.

<span class="mw-page-title-main">2021 Isle of Wight Council election</span>

Elections to Isle of Wight Council took place on 6 May 2021 as part of the 2021 United Kingdom local elections. These were held at the same time as the elections for the Hampshire Police and Crime Commissioner. The elections saw the Conservatives lose control of the council, losing seats against the national trend for the party.

<span class="mw-page-title-main">2022 Cardiff Council election</span> Local election in Wales

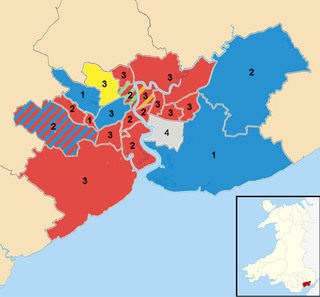
The 2022 Cardiff Council election took place on 5 May 2022 to elect 79 members to Cardiff Council. On the same day, elections were held to the other 21 local authorities and to community councils in Wales as part of the 2022 Welsh local elections.

Elections to The Highland Council were held on 5 May 2022, the same day as the 31 other Scottish local government elections. The election used the 21 wards created under the Local Governance (Scotland) Act 2004, with 74 councillors being elected. Each ward elected either 3 or 4 members, using the STV electoral system.

The 2022 Carmarthenshire County Council election took place on Thursday 5 May 2022 to elect 75 members to Carmarthenshire Council. On the same day, elections were held to the other 21 local authorities and to community councils in Wales as part of the 2022 Welsh local elections.

<span class="mw-page-title-main">2023 Guildford Borough Council election</span> Local election in Surrey, England

The 2023 Guildford Borough Council election was held on 4 May 2023, to elect all 48 seats to the Guildford Borough Council in Surrey, England as part of the 2023 local elections. The results saw the Liberal Democrat take overall control of Guildford Borough Council.

Elections to North Ayrshire Council took place on 5 May 2022 on the same day as the 31 other Scottish local government elections. As with other Scottish council elections, it was held using single transferable vote (STV) – a form of proportional representation – in which multiple candidates are elected in each ward and voters rank candidates in order of preference.

The 1983 Reading Borough Council election was held on 5 May 1983, at the same time as other local elections across England and Wales. Following ward boundary changes, the number of seats on the council had been reduced from 49 to 45, arranged as 15 wards with three councillors each. All 45 seats on Reading Borough Council were up for election on the new boundaries.

<span class="mw-page-title-main">2022 Vale of Glamorgan Council election</span>

The 2022 Vale of Glamorgan Council election took place as of 5 May 2022 to elect 54 members across 24 wards to Vale of Glamorgan Council. On the same day, elections were held to the other 21 local authorities and to community councils in Wales as part of the 2022 Welsh local elections. The previous Vale of Glamorgan all-council election took place in May 2017 and future elections will take place every five years.

<span class="mw-page-title-main">2022 Argyll and Bute Council election</span> Argyll and Bute Council election

Elections to Argyll and Bute Council took place on 5 May 2022 on the same day as the 31 other Scottish local government elections. As with other Scottish council elections, it was held using single transferable vote (STV) – a form of proportional representation – in which multiple candidates are elected in each ward and voters rank candidates in order of preference.

<span class="mw-page-title-main">2022 Newport City Council election</span> Local election in Wales

Elections to Newport City Council were held on 5 May 2022 along with elections to the other 21 local authorities in Wales, community council elections in Wales and 2022 United Kingdom local elections. The previous full council election took place in May 2017, though there had also been a number of by-elections in the city in the intervening period.

The 2023 Fenland District Council election took place on 4 May 2023 to elect members of Fenland District Council in Cambridgeshire, England. This was on the same day as other local elections across England. The Conservatives retained their majority on the council.
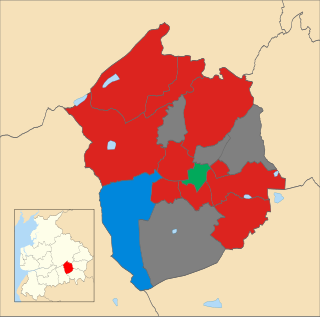
References

  1. "Future electoral arrangements for the Isle of Wight" (PDF). Boundary Committee for England . Retrieved 29 November 2009.
  2. 1 2 "Tories surge back in island polls". Isle of Wight County Press . Retrieved 4 December 2009.
  3. "Letters – Sickened voters stayed at home". Isle of Wight County Press . Retrieved 4 December 2009.
  4. The number of councillors received in 2005 multiplied by 0.833 to reflect the reduced number of councillors. No attempt has been made to account for altered boundaries and geographic distribution of support.
  5. Those individuals who chose not to state a political affiliation, or be named as 'independents' on the ballot.
  6. "Isle of Wight Council election results". Isle of Wight County Press . Retrieved 11 June 2009.