1981 Isle of Wight County Council election

Last updated

Local elections of 1981 to the Isle of Wight County Council , a county council in south east England, were held on 7 May 1981. The whole council was up for election, with boundary changes since the last election in 1977, which increased the number of seats by one. [1] The election resulted in a council with Liberal members holding more than half of the seats.

Contents

Election result

Isle of Wight County Council election result 1981 [1]
PartySeatsGainsLossesNet gain/lossSeats %Votes %Votes+/−
  Liberal 27Increase2.svg2062.850.4%22,482
  Conservative 12Decrease2.svg1127.934.0%15,150
  Independent 4Decrease2.svg49.322.8%10,146
  Labour 0Decrease2.svg10.04.7%2,081
  RA 0Decrease2.svg30.01.3%565
  Independent Liberal 0Steady2.svg0.01.0%465

This result had the following consequences for the total number of seats on the council after the elections:

PartyPrevious councilNew council
Liberal727
Conservatives2312
Independent84
Residents30
Labour10
Total4243
Working majority 4  11 

Ward results

Arreton & Newchurch

Arreton & Newchurch
PartyCandidateVotes%±%
Liberal M. Lanfear67259.4N/A
Conservative P. Jarrett45940.6N/A
Majority21318.8
Turnout 1,13151.9
Liberal win (new seat)

Ashey

Ashey
PartyCandidateVotes%±%
Liberal G. Wilson61357.5N/A
Conservative F. Winter37435.1N/A
Labour L. Cuthbert807.5N/A
Majority23922.4
Turnout 1,06753.6
Liberal win (new seat)

Bembridge

Bembridge
PartyCandidateVotes%±%
Conservative R. Rowsell1,06463.3Decrease2.svg8.1
Liberal A. Naylor56233.4N/A
Labour S. Sutters563.3N/A
Majority50229.9
Turnout 1,68254.8
Conservative hold Swing

Binstead

Binstead
PartyCandidateVotes%±%
Conservative R. Jewitt51952.6N/A
Liberal M. Perfitt46847.4N/A
Majority515.2
Turnout 98748.2
Liberal win (new seat)

Brading

Brading
PartyCandidateVotes%±%
Conservative Janusz TrzebskiUnopposedN/AN/A
Conservative hold Swing N/A

Brighstone & Shorwell

Brighstone & Shorwell
PartyCandidateVotes%±%
Liberal P. Leyton56150.4N/A
Conservative A. Currie50445.3N/A
Labour D. White484.3N/A
Majority575.1
Turnout 1,11363.8
Liberal win (new seat)

Calbourne Shalfleet & Yarmouth

Calbourne Shalfleet & Yarmouth
PartyCandidateVotes%±%
Conservative S. Laird74651.0N/A
Liberal J. Hancock71749.0N/A
Majority292.0
Turnout 1,46353.9
Conservative win (new seat)

Carisbrooke East

Carisbrooke East
PartyCandidateVotes%±%
Liberal Stephen Ross 404 71.6 N/A
Conservative P. Dobson14849.0N/A
Labour R. Jones122.1N/A
Majority292.0
Turnout 56445.4
Conservative win (new seat)

Carisbrooke West

Carisbrooke West
PartyCandidateVotes%±%
Liberal J. Kitchington90293.9N/A
Labour R. Stringer596.1N/A
Majority84387.7
Turnout 96147.2
Liberal win (new seat)

Chale & Niton

Chale & Niton
PartyCandidateVotes%±%
Conservative P. Fradgley68252.6N/A
Liberal D. Waddleton57544.4N/A
Labour C. Sullivan393.0N/A
Majority1078.2
Turnout 1,29658.3
Conservative win (new seat)

Cowes Castle

Cowes Castle
PartyCandidateVotes%±%
Liberal C. Carter90458.7N/A
Conservative S. Flynn63541.3Decrease2.svg58.7
Majority26917.4
Turnout 1,53952.9
Liberal gain from Conservative Swing

Cowes Central

Cowes Central
PartyCandidateVotes%±%
Liberal D. Lennox58652.2N/A
Independent N. Butchers48142.8Decrease2.svg57.2
Labour P. Ray565.0N/A
Majority1059.4
Turnout 1,12359.3
Liberal gain from Independent Swing

Cowes Medina

Cowes Medina
PartyCandidateVotes%±%
Liberal E. Bird81572.3N/A
Labour S. Smith17015.1Decrease2.svg33.6
Conservative M. Billington14212.6Decrease2.svg38.7
Majority64557.2
Turnout 1,12756.9
Liberal gain from Conservative Swing

East Cowes

East Cowes
PartyCandidateVotes%±%
Independent H. Moon71361.0Increase2.svg8.3
Independent Liberal A. Guy45639.0N/A
Majority25722.0
Turnout 1,16943.2
Independent hold Swing

Fairlee

Fairlee
PartyCandidateVotes%±%
Liberal P. Breach69865.4
Conservative R. Dixon33231.1Decrease2.svg20.0
Labour D. Wood383.6
Majority36634.3
Turnout 1,06853.9
Liberal gain from Conservative Swing

Freshwater Afton

Freshwater Afton
PartyCandidateVotes%±%
Conservative E. Le Brecht65251.3N/A
Liberal J. Cooper61948.7N/A
Majority332.6
Turnout 1,27161.3
Conservative win (new seat)

Freshwater Norton

Freshwater Norton
PartyCandidateVotes%±%
Conservative A. Parker48442.4N/A
Liberal A. Smith46540.8N/A
Liberal B. Fitzsimmons19216.8N/A
Majority191.6
Turnout 1,14153.6
Conservative win (new seat)

Gatcombe & Godshill

Gatcombe & Godshill
PartyCandidateVotes%±%
Conservative R. Westmore57454.3N/A
Liberal A. Smith48445.7N/A
Majority908.6
Turnout 1,05857.4
Conservative win (new seat)

Gurnard

Gurnard
PartyCandidateVotes%±%
Liberal S. Sutherland52553.0N/A
Conservative M. Halpin46647.0N/A
Majority596.0
Turnout 99157.4
Liberal win (new seat)

Mount Joy

Mount Joy
PartyCandidateVotes%±%
Liberal R. Smith74755.8Increase2.svg8.7
Conservative E. Giles50637.8Decrease2.svg15.1
Labour C. Wilson856.4N/A
Majority24118.0
Turnout 1,33850.5
Liberal gain from Conservative Swing

Nettlestone & St. Helens

Nettlestone & St.Helens
PartyCandidateVotes%±%
Liberal S. Rains79651.3N/A
Conservative L. Hollis70745.6N/A
Labour E. Kitchen483.1N/A
Majority895.7
Turnout 1,55166.5
Liberal gain from Independent Swing

Newport Central

Newport Central
PartyCandidateVotes%±%
Liberal R. Rowsell79163.5Increase2.svg8.0
Conservative J. Tungate40132.2Decrease2.svg12.3
Labour L. O'Flaherty544.3N/A
Majority39031.3
Turnout 1,24651.0
Liberal hold Swing

Northwood

Northwood
PartyCandidateVotes%±%
Liberal B. Drake89474.1Increase2.svg32.1
Conservative J. Powe25921.5Decrease2.svg23.7
Labour P. Millar534.4Decrease2.svg8.4
Majority63552.6
Turnout 1,20672.5
Liberal hold Swing

Osborne

Osborne
PartyCandidateVotes%±%
Liberal J. Augustus86969.7N/A
Labour S. Glossop37730.3Decrease2.svg21.3
Majority10839.4
Turnout 1,24649.4
Liberal gain from Labour Swing

Pan

Pan
PartyCandidateVotes%±%
Liberal M. Barton89767.3Increase2.svg18.8
Labour A. Beere26119.6Decrease2.svg4.4
Conservative A. Jenner17513.1Decrease2.svg14.4
Majority63647.7
Turnout 1,26356.0
Liberal hold Swing

Parkhurst

Parkhurst
PartyCandidateVotes%±%
Liberal B. Pratt67966.8Increase2.svg13.7
Conservative D. Eden28027.5Decrease2.svg19.4
Labour A. Jenner585.7N/A
Majority39939.3
Turnout 1,01740.9
Liberal hold Swing

Ryde North East

Ryde North East
PartyCandidateVotes%±%
Liberal P. White66458.2N/A
Conservative N. Bartholomew41236.1N/A
Labour P. Westmore645.6N/A
Majority25222.1
Turnout 1,14045.7
Liberal gain from Independent Swing

Ryde North West

Ryde North West
PartyCandidateVotes%±%
Independent E. Minghella47151.8Increase2.svg4.7
Conservative L. Sharp43848.2Decrease2.svg4.7
Majority333.6
Turnout 90939.9
Independent gain from Conservative Swing

Ryde South East

Ryde South East
PartyCandidateVotes%±%
Liberal J. WilliamsUnopposedN/AN/A
Liberal hold Swing

Ryde South West

Ryde South West
PartyCandidateVotes%±%
Liberal M. Robinson68261.5N/A
Conservative D. Harley32128.9Decrease2.svg18.1
Labour R. Scholes1069.6Decrease2.svg6.8
Majority36132.6
Turnout 1,10947.1
Liberal gain from Conservative Swing

Sandown Lake

Sandown Lake
PartyCandidateVotes%±%
Liberal P. Harris77553.4N/A
RA G. Buttle56538.9N/A
Labour I. Williams1117.6N/A
Majority21014.5
Turnout 1,45144.4
Liberal win (new seat)

Sandown North

Sandown North
PartyCandidateVotes%±%
Independent W. GrayUnopposedN/AN/A
Independent hold Swing

Sandown South

Sandown South
PartyCandidateVotes%±%
Liberal P. Davis36652.9N/A
Conservative T. Findon32647.1Decrease2.svg18.1
Majority405.8
Turnout 69248.9
Liberal hold Swing

Seaview & Appley

Seaview & Appley
PartyCandidateVotes%±%
Conservative A. Hersey80562.8N/A
Liberal R. Hayes47637.2N/A
Majority32925.6
Turnout 1,28152.5
Liberal win (new seat)

Shanklin Central

Shanklin Central
PartyCandidateVotes%±%
Liberal G. Cassidy48050.9N/A
Conservative J. Holmes46349.1N/A
Majority171.8
Turnout 94341.9
Liberal win (new seat)

Shanklin North

Shanklin North
PartyCandidateVotes%±%
Liberal H. Howe42760.6Increase2.svg21.8
Independent G. Orchard24534.8Decrease2.svg4.3
Labour C. Cotton334.7N/A
Majority18225.8
Turnout 70540.6
Liberal gain from Independent Swing

Shanklin South

Shanklin South
PartyCandidateVotes%±%
Conservative F. FryUnopposedN/AN/A
Conservative hold Swing N/A

St. Lawrence & Lowther

St. Lawrence & Lowther
PartyCandidateVotes%±%
Conservative D. Ross36537.2Decrease2.svg31.5
Liberal D. Orchard34935.5N/A
Independent T. Norton26827.3N/A
Majority161.7
Turnout 98263.5
Conservative hold Swing

St. Johns

St. Johns
PartyCandidateVotes%±%
Liberal E. Jarman53354.0N/A
Independent B. Heath31131.5N/A
Labour B. Waters818.2N/A
Independent R. Allen626.3N/A
Majority22222.5
Turnout 98739.0
Liberal gain from Conservative Swing

Totland

Totland
PartyCandidateVotes%±%
Conservative T. Cokes86878.8
Liberal A. Brewer23321.2Decrease2.svg15.9
Majority63557.6
Turnout 1,10160.0
Conservative gain from RA Swing

Ventnor Central

Ventnor Central
PartyCandidateVotes%±%
Liberal P. Graham-Stewart87860.3Increase2.svg11.8
Conservative R. Farthing57839.7Decrease2.svg2.6
Majority30020.6
Turnout 1,45649.4
Liberal hold Swing

Wootton

Wootton
PartyCandidateVotes%±%
Liberal M. Stolworthy84164.4N/A
Conservative R. Garbett46535.6N/A
Majority37628.8
Turnout 1,30655.5
Liberal win (new seat)

Wroxall & Bonchurch

Wroxall & Bonchurch
PartyCandidateVotes%±%
Liberal E. Crossley43752.8Increase2.svg15.8
Independent A. Wadsworth39047.2Decrease2.svg15.8
Majority475.6
Turnout 82753.3
Liberal gain from Independent Swing

See also

Related Research Articles

<span class="mw-page-title-main">Isle of Wight Council</span> Principal local authority of the Isle of Wight

The Isle of Wight Council, known until 1995 as Isle of Wight County Council, is the unitary authority which governs the county of the Isle of Wight in South East England. The council is controlled by the Alliance Group, a coalition of Independent, Green, Independent Network, and Our Island councillors. Its headquarters is County Hall in Newport.

As a geographical entity distinct from the mainland, the Isle of Wight has always fought to have this identity recognised. The Isle of Wight is currently a ceremonial and Non-metropolitan county and local government is by unitary authority. The island is also the highest populated Westminster constituency in the country.

<span class="mw-page-title-main">Isle of Wight (UK Parliament constituency)</span> Parliamentary constituency in the United Kingdom

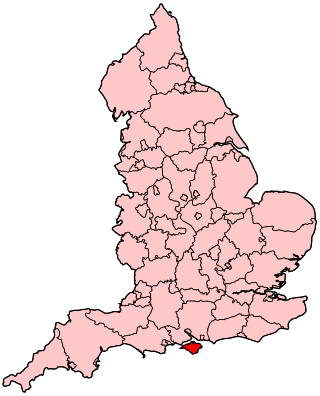
Isle of Wight is a constituency represented in the House of Commons of the UK Parliament since 2017 by Bob Seely, a Conservative.

<span class="mw-page-title-main">Na h-Eileanan an Iar (UK Parliament constituency)</span> Parliamentary constituency in the United Kingdom, 1918 onwards

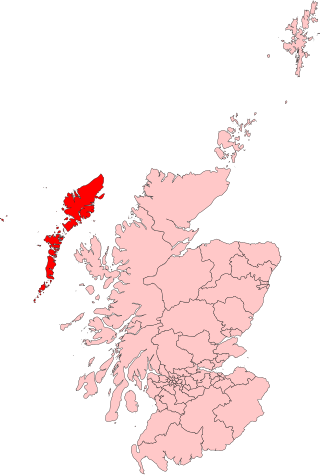
Na h-Eileanan an Iar, formerly Western Isles, is a constituency of the House of Commons of the Parliament of the United Kingdom, created in 1918. It elects one Member of Parliament (MP) by the first past the post system of election.

<span class="mw-page-title-main">2005 United Kingdom local elections</span>

The 2005 United Kingdom local elections were held on Thursday 5 May 2005, with various councils and local government seats being contested in England and Northern Ireland, and a local referendum taking place on the Isle of Wight on the issue of a directly elected mayor. These local elections were held in conjunction with the 2005 general election across the entire United Kingdom.

Newtown was a parliamentary borough located in Newtown on the Isle of Wight, which was represented in the House of Commons of England until 1707, then in the House of Commons of Great Britain from 1707 to 1800, and finally in the House of Commons of the United Kingdom from 1801 to 1832. It was represented by two members of parliament (MPs), elected by the bloc vote system.

<span class="mw-page-title-main">Constituencies of the Parliament of the United Kingdom</span> Electoral divisions of the parliament of the United Kingdom

The Parliament of the United Kingdom currently has 650 parliamentary constituencies across the constituent countries, each electing a single member of parliament (MP) to the House of Commons by the plurality voting system, ordinarily every five years. Voting last took place in all 650 of those constituencies at the United Kingdom general election on 12 December 2019.

<span class="mw-page-title-main">2009 Isle of Wight Council election</span>

The 2009 Isle of Wight Council elections were held on Thursday 4 June 2009.

The 2005 Isle of Wight Council elections were held on the Isle of Wight, England, on 5 May 2005. The result led to a landslide Conservative victory gaining 22 councillors, leading the Isle of Wight to Conservative control from no overall control previously.

<span class="mw-page-title-main">David Pugh (Conservative politician)</span> British politician (born 1980)

David Pugh is a former Conservative councillor and served as leader of the Isle of Wight Council between September 2007 and May 2013, making him the longest serving leader of the local authority since its inception in 1995. He was first elected to the Isle of Wight Council at the local elections in May 2005 as a member for the Shanklin Central Ward, re-elected in the June 2009 elections to the Shanklin South Ward, losing his seat in the 2013 local elections after 2 other candidates withdrew, making the election a straight choice between Pugh and Independent, Richard Priest. Consequently, he ceased to be council leader.

<span class="mw-page-title-main">1993 United Kingdom local elections</span>

The 1993 United Kingdom local elections were held on Thursday 6 May 1993 in England and Wales, and Wednesday 19 May 1993 in Northern Ireland. The results showed a decline for the governing Conservative Party, who were still reeling from the fallout of Black Wednesday; with the third-placed party, the Liberal Democrats, gaining most seats.

<span class="mw-page-title-main">1977 United Kingdom local elections</span>

Local elections were held in the United Kingdom in 1977. The results were a major mid-term setback for the Labour government, and the Conservatives, the main opposition, comprehensively regained control of the Greater London Council with 64 seats against Labour's 28. Elections were also held in the county councils and in Northern Ireland.

<span class="mw-page-title-main">1981 United Kingdom local elections</span>

Local elections were held in the United Kingdom in May 1981.

The 1911 Barnstaple by-election was a Parliamentary by-election held on 6 May 1911. It returned one Member of Parliament (MP) to the House of Commons of the Parliament of the United Kingdom, elected by the first past the post voting system.

<span class="mw-page-title-main">2013 Isle of Wight Council election</span>

The 2013 Isle of Wight Council election was held on 2 May 2013 to elect all 40 members for a four-year term to the Isle of Wight Council, a unitary authority which governs the Isle of Wight. Going into the election, the Conservative Party was looking to gain a third term in power after first being elected to overall control in 2005, but in one of the shock results of the wider local elections being held in the country, the Conservatives lost overall control of the council, having been reduced to 15 seats, 6 short of a majority of 21. The 'Island Independents', a mutually supporting group of candidates and councillors running as independents, gained the same number of seats, whilst other independents, UKIP, Labour, and a Liberal Democrat made up the remainder.

South Wight was a non-metropolitan district in Isle of Wight, England. It was abolished on 1 April 1995 and replaced by Isle of Wight Council.

Medina was a non-metropolitan district in Isle of Wight, England. It was abolished on 1 April 1995 and replaced by Isle of Wight Council.

Isle of Wight Council is the local authority for the Isle of Wight, a unitary authority and non-metropolitan county in England.

<span class="mw-page-title-main">2017 Isle of Wight Council election</span>

The 2017 Isle of Wight Council election took place on 4 May 2017 as part of the 2017 local elections in the United Kingdom. All 40 Councillors were elected from 39 electoral divisions, which each returned either one or two Councillors by first-past-the-post voting for a four-year term of office.

<span class="mw-page-title-main">2021 Isle of Wight Council election</span>

Elections to Isle of Wight Council took place on 6 May 2021 as part of the 2021 United Kingdom local elections. These were held at the same time as the elections for the Hampshire Police and Crime Commissioner. The elections saw the Conservatives lose control of the council, losing seats against the national trend for the party.

References

  1. 1 2 Rallings, Colin; Thrasher, Michael. "Isle of Wight County Council Election Results 1973-1993" (PDF). Elections Centre. Retrieved 15 June 2021.