
Nottinghamshire County Council is the upper-tier local authority for the non-metropolitan county of Nottinghamshire in England. It consists of 66 county councillors, elected from 56 electoral divisions every four years. The most recent election was held in 2021.

Elections to Nottinghamshire County Council took place on 4 June 2009, having been delayed from 7 May, in order to coincide with elections to the European Parliament.

Local elections were held in the United Kingdom in May 1981.

The Nottinghamshire County Council Election took place on 2 May 2013 as part of the 2013 United Kingdom local elections. 67 councillors were elected from 54 electoral divisions, which returned either one or two county councillors each by first-past-the-post voting for a four-year term of office. The electoral divisions were the same as those used at the previous election in 2009. No elections were held in the City of Nottingham, which is a unitary authority outside the area covered by the County Council. The Labour Party won a narrow majority of one seat, gaining overall control from the Conservative Party who had controlled the council since the 2009 election.
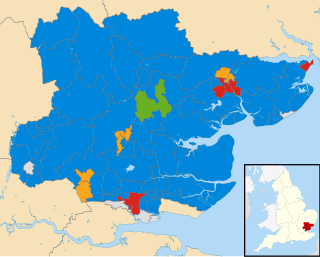
Elections to Essex County Council took place on 4 May 2017 as part of the 2017 local elections. All 75 councillors were elected from 70 electoral divisions, which each returned either one or two councillors by first-past-the-post voting for a four-year term of office.

The 1985 Nottinghamshire County Council election was held on Thursday, 2 May 1985. The whole council of eighty-eight members was up for election and the result was that the Labour Party retained control of the Council, winning forty-eight seats. The Conservatives won thirty-seven councillors and the SDP–Liberal Alliance made gains in terms of percentage vote share, but won just two seats. An Independent councillor was elected in the Retford North division.

The 1989 Nottinghamshire County Council election was held on Thursday, 4 May 1989. The whole council of eighty-eight members was up for election and the result was that the Labour Party retained control of the Council, winning fifty seats. The Conservatives won thirty-four councillors and the Social and Liberal Democrats won four seats.
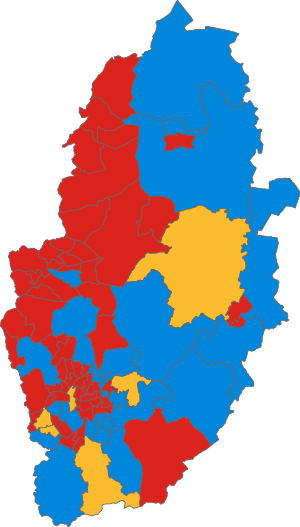
The 1993 Nottinghamshire County Council election was held on Thursday, 6 May 1993. The whole council of eighty-eight members was up for election.

The 2005 Nottinghamshire County Council election was held on Thursday, 5 May 2005. The whole council was up for election and the result was the Labour Party retaining its control of the council.
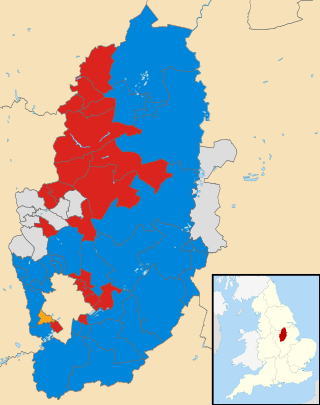
The 2017 Nottinghamshire County Council election took place on 4 May 2017 as part of the 2017 local elections in the United Kingdom. The whole council of 66 councillors was elected for a four-year term spanning 56 electoral divisions, a minority of which return two councillors. The voting system used is first-past-the-post.

The 2017 Cambridgeshire County Council election was held on 4 May 2017 as part of the 2017 local elections in the United Kingdom. All 61 councillors were elected from 59 electoral divisions, which returned either one or two county councillors each by first-past-the-post voting for a four-year term of office.
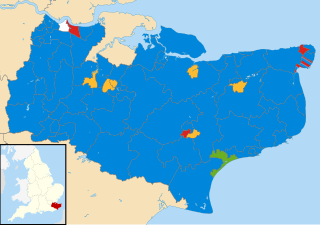
The 2017 Kent County Council election was held on 4 May 2017 as part of the 2017 local elections in the United Kingdom. All 81 councillors were elected from 72 electoral divisions, each of which returned either one or two county councillors by first-past-the-post voting for a four-year term of office. The Conservative Party retained control. UKIP, previously the second-largest party on the council, lost all their seats.

The 2017 Suffolk County Council election took place on 4 May 2017 as part of the 2017 local elections in the United Kingdom. All 75 councillors were elected from 63 electoral divisions, which returned either one or two county councillors each, by first-past-the-post voting, for a four-year term of office.
The 1973 Nottinghamshire County Council election was held on Thursday, 12 April 1973. The election resulted in the Labour Party winning an overall majority of seats on the council.
The 1977 Nottinghamshire County Council election was held on Thursday, 5 May 1977. The election resulted in a landslide victory for the Conservative Party, which won 66 of the 89 seats on the county council. The Labour Party won just 20 seats, compared to 54 at the previous election.
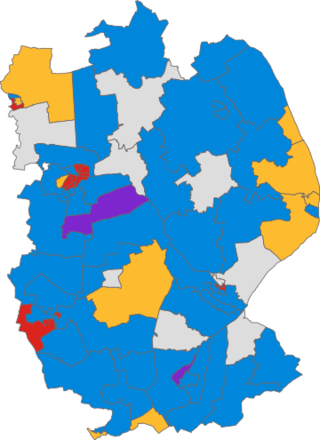
The 1981 Lincolnshire County Council election was held on Thursday, 7 May 1981, following boundary changes to the county's electoral divisions. The whole council of 76 members was up for election and the election resulted in the Conservative Party retaining control of the council, winning 42 seats.

The 2001 Lincolnshire County Council election was held on Thursday, 7 June 2001, the same day as the general election. Boundary changes to the electoral divisions of the county took effect at this election, with the number of seats increased by 1. The whole council of 77 members was up for election and the election resulted in the Conservative Party retaining control of the council, winning 49 seats.

The 1973 Tyne and Wear County Council election was held on 12 April 1973 as part of the first elections to the new local authorities established by the Local Government Act 1972 in England and Wales. 104 councillors were elected from 95 electoral divisions across the region's five boroughs. Each division returned either one or two county councillors each by First-past-the-post voting for a four-year term of office. The election took place ahead of the elections to the area's metropolitan borough councils, which followed on 10 May 1973.
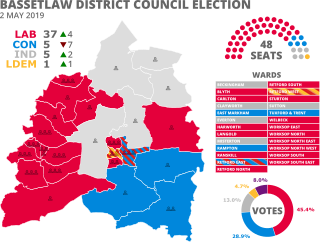
The 2019 Bassetlaw District Council election took place on 2 May 2019 to elect all 48 members of Bassetlaw District Council in England. This was on the same day as other local elections.

The 2021 Nottinghamshire County Council election took place on 6 May 2021 as part of the 2021 local elections in the United Kingdom. All 66 councillors were elected from 56 electoral divisions, which returned either one or two county councillors each by first-past-the-post voting for a four-year term of office.


