2005 Nottinghamshire County Council election

Last updated

2005 Nottinghamshire County Council election
County Flag of Nottinghamshire.svg
  2001 5 May 2005 2009  

All 67 seats to Nottinghamshire County Council
34 seats needed for a majority
Turnout62% (Increase2.svg+1.5)
 First partySecond partyThird party
 
Party Labour Conservative Liberal Democrats
Seats won38254
Popular vote134,152117,59860,788
Percentage37.5%32.9%17.0%
SwingDecrease2.svg-6.7Decrease2.svg-3.2Increase2.svg+2.3

Nottinghamshire County Council election, 2005.svg
Map of the results of the election in each division. Colours denote the winning party, as shown in the main table of results.

Council control before election

Labour

Council control after election

Labour

The 2005 Nottinghamshire County Council election was held on Thursday, 5 May 2005, the same day as the 2005 UK General Election. The whole council was up for election and the Labour Party retained control of the council. [1] [2]

Contents

Boundary changes to the electoral divisions took effect at this election, with the number of seats increased by four.

Overall election results

Political composition of the council following the election 2005 Nottinghamshire County Council election composition.svg
Political composition of the council following the election
Overall Turnout
Registered electors567,217
Votes cast351,848
Turnout62.0% (Increase2.svg+1.5)
2005 Nottinghamshire County Council election
PartyCandidatesSeatsGainsLossesNet gain/lossSeats %Votes %Votes+/−
  Labour 663837.5134,152Decrease2.svg-6.7
  Conservative 572532.9117,598Decrease2.svg-3.2
  Liberal Democrats 46417.060,788Increase2.svg+2.3
  Independent 3309.032,030Increase2.svg+5.2
  Green 2002.910,294Increase2.svg+1.7
  BNP 200.31,093Increase2.svg+0.2
  Ashfield Ind. 100.3985NEW
  UKIP 100.1531NEW
  Veritas 100.1149NEW

Results by District


Each electoral division returned either one, two or three county councillors. [2]

Ashfield

(10 seats, 8 electoral divisions)

Ashfield District
PartyCandidatesVotes
StoodElectedGainedUnseatedNet % of total %No.Net %
  Labour 101045.922,556Decrease2.svg-11.9
  Independent 11018.99,277Increase2.svg+7.9
  Conservative 6015.07,396Decrease2.svg-12.6
  Liberal Democrats 7011.85,805NEW
  Green 806.43,132Increase2.svg+3.6
  Ashfield Ind. 102.0985NEW
Ashfield Turnout
Registered electors82,960
Votes cast48,391
Turnout58.3% (Increase2.svg+5.0)

Hucknall

Hucknall (3 seats)
PartyCandidateVotes%
Labour Dave Shaw 6,619 52.8
Labour Chris Baron (inc)* 6,576 52.5
Labour Nellie Smedley (inc)✝ 6,566 52.4
Conservative G Riley4,27834.1
Conservative S Robbins4,12532.9
Conservative B Andrews3,82430.5
Green S Boffey1,54012.3
Green A Hilton1,32010.5
Green D Lowe1,1499.2
Independent T Goodall8546.8
Independent Robert Sears-Piccavey7425.9
Turnout 12,53154.5
Registered electors 23,010
Labour win (new seat)

* Incumbent councillor for Hucknall East division prior to boundary changes. ✝ Incumbent councillor for Hucknall West division prior to boundary changes.

Kirkby in Ashfield North

Kirkby in Ashfield North
PartyCandidateVotes%
Labour John Knight 1,897 36.7
Independent J Baird1,42327.5
Independent Wendy Harvey1,08320.9
Liberal Democrats Austin Raithe77114.9
Turnout 5,17453.4
Registered electors 9,695
Labour win (new boundaries)

Kirkby in Ashfield South

Kirkby in Ashfield South
PartyCandidateVotes%
Labour Yvonne Davidson (inc) 2,457 39.3
Independent Rachel Madden1,23019.7
Ashfield Ind. T Brown98515.7
Liberal Democrats T Theaker94815.2
Green M Harrison63410.1
Turnout 6,25460.3
Registered electors 10,376
Labour win (new boundaries)

Selston

Selston
PartyCandidateVotes%
Labour Joan Taylor (inc) 2,523 43.4
Independent Gail Turner2,27239.1
Liberal Democrats B Charlesworth1,01317.4
Turnout 5,80858.7
Registered electors 9,893
Labour win (new boundaries)

Sutton in Ashfield Central

Sutton in Ashfield Central
PartyCandidateVotes%
Labour Edward Llewellyn-Jones (inc) 2,301 51.0
Conservative Christine Vernon86019.1
Liberal Democrats L Bradshaw73116.2
Independent J Ross3167.0
Independent C Perry1533.4
Green A Finlayson1513.3
Turnout 4,51253.5
Registered electors 8,433
Labour win (new boundaries)

Sutton in Ashfield East

Sutton in Ashfield East
PartyCandidateVotes%
Labour Steve Carroll (inc) 2,364 52.6
Liberal Democrats L Mullaney1,03423.0
Independent C Madin76817.1
Green C Davenport3267.3
Turnout 4,49253.8
Registered electors 8,342
Labour win (new boundaries)

Sutton in Ashfield North

Sutton in Ashfield North
PartyCandidateVotes%
Labour Dick Anthony (inc) 2,105 44.8
Conservative J Baker1,11823.8
Liberal Democrats P Birkitt65413.9
Independent P Thorpe59812.7
Green F Keen2234.7
Turnout 4,69856.8
Registered electors 8,278
Labour win (new boundaries)

Sutton in Ashfield West

Sutton in Ashfield West
PartyCandidateVotes%
Labour David Kirkham (inc) 2,290 46.5
Conservative S Lyons1,14023.2
Liberal Democrats A Fell65413.3
Independent H Greasley58011.8
Green K Bradford2585.2
Turnout 4,92257.4
Registered electors 8,572
Labour win (new boundaries)

Bassetlaw

(9 seats, 9 electoral divisions)

Bassetlaw District
PartyCandidatesVotes
StoodElectedGainedUnseatedNet % of total %No.Net %
  Labour 9749.223,607Decrease2.svg-0.8
  Conservative 7237.417,977Decrease2.svg-1.2
  Independent 5013.46,432Increase2.svg+12.4
Bassetlaw Turnout
Registered electors82,572
Votes cast48,016
Turnout58.2% (Increase2.svg+0.2)

Blyth and Harworth

Blyth and Harworth
PartyCandidateVotes%
Labour Sheila Place (inc) 2,612 52.7
Independent David Challinor2,34247.3
Turnout 4,95453.7
Registered electors 9,226
Labour win (new boundaries)

Misterton

Misterton
PartyCandidateVotes%
Conservative Kenneth Bullivant (inc) 4,172 62.5
Labour Rory Palmer 2,50137.5
Turnout 6,67364.7
Registered electors 10,306
Conservative win (new boundaries)

Retford East

Retford East
PartyCandidateVotes%
Labour Mick Storey (inc)* 2,675 52.3
Conservative Michael Quigley2,43847.7
Turnout 5,11360.0
Registered electors 8,522
Labour win (new seat)

* Incumbent councillor for Retford South division prior to boundary changes.

Retford West

Retford West
PartyCandidateVotes%
Labour James Napier (inc)* 2,343 52.9
Conservative J Bush2,09047.1
Turnout 4,43356.6
Registered electors 7,831
Labour win (new seat)

* Incumbent councillor for Retford North division prior to boundary changes.

Tuxford

Tuxford
PartyCandidateVotes%
Conservative John Hempsall (inc) 4,120 62.7
Labour Pamela Skelding2,44937.3
Turnout 6,56965.4
Registered electors 10,051
Conservative win (new boundaries)

Worksop East

Worksop East
PartyCandidateVotes%
Labour Glynn Gilfoyle (inc) 2,983 62.6
Independent Geoff Coe1,77937.4
Turnout 4,76252.0
Registered electors 9,165
Labour win (new boundaries)

Worksop North

Worksop North
PartyCandidateVotes%
Labour Sybil Fielding 2,855 53.1
Conservative Barry Bowles1,46527.3
Independent R Barsley1,05619.6
Turnout 5,37654.7
Registered electors 9,827
Labour win (new seat)

Worksop North East and Carlton

Worksop North East and Carlton
PartyCandidateVotes%
Labour Alan Rhodes 2,913 51.9
Conservative Val Bowles1,98935.5
Independent A Barsley70812.6
Turnout 5,61059.9
Registered electors 9,363
Labour win (new seat)

Worksop West

Worksop West
PartyCandidateVotes%
Labour Alan Davison (inc) 2,276 50.3
Conservative Chris Wanless1,70337.6
Independent J Payne54712.1
Turnout 4,52654.7
Registered electors 8,281
Labour win (new boundaries)

Broxtowe

(10 seats, 8 electoral divisions)

Broxtowe District
PartyCandidatesVotes
StoodElectedGainedUnseatedNet % of total %No.Net %
  Conservative 10431.016,626Decrease2.svg-2.4
  Liberal Democrats 10426.013,910Increase2.svg+3.2
  Labour 10234.518,501Decrease2.svg-6.3
  Independent 403.61,953Increase2.svg+2.6
  Green 403.61,938Increase2.svg+1.6
  BNP 100.9509NEW
  Veritas 100.3149NEW
Broxtowe Turnout
Registered electors81,258
Votes cast54,247
Turnout66.8% (Increase2.svg+2.0)

Beauvale

Beauvale
PartyCandidateVotes%
Conservative David Taylor (inc)* 2,100 38.4
Labour D Ryan2,08338.1
Liberal Democrats P Fell77114.1
BNP S Graham5099.3
Turnout 5,46367.5
Registered electors 8,091
Conservative win (new seat)

* Incumbent councillor for Greasley and Nuthall division prior to boundary changes.

Beeston North

Beeston North
PartyCandidateVotes%
Liberal Democrats Steve Carr 1,942 37.7
Labour S Barber1,70333.0
Conservative Philip Hopkinson1,14422.2
Green S Rule2905.6
Independent M Tewson781.5
Turnout 5,15768.6
Registered electors 7,519
Liberal Democrats win (new boundaries)

Beeston South and Attenborough

Beeston South and Attenborough
PartyCandidateVotes%
Labour Pat Lally 2,363 39.6
Conservative Eric Kerry1,88431.6
Liberal Democrats C Wombwell1,21820.4
Green P Anderson3906.5
Independent A Buttery1061.8
Turnout 5,96166.1
Registered electors 9,012
Labour win (new seat)

Bramcote and Stapleford

Bramcote and Stapleford
PartyCandidateVotes%
Liberal Democrats Stan Heptinstall (inc)* 4,841 42.1
Liberal Democrats Brian Wombwell 4,541 39.5
Labour Geoff Ward3,22128.0
Labour John Bell (inc)✝3,01326.2
Conservative S Tonks2,75924.0
Conservative E Atherton2,60522.7
Green Mary Venning6095.3
Turnout 11,49867.6
Registered electors 17,010
Liberal Democrats win (new seat)

* Incumbent councillor for Bramcote and Stapleford East division prior to boundary changes. ✝ Incumbent councillor for Stapleford North & West division prior to boundary changes.

Chilwell and Toton

Chilwell and Toton
PartyCandidateVotes%
Conservative Tom Pettengell (inc)* 3,971 37.8
Conservative Richard Jackson 3,920 37.3
Labour M Garrett3,64634.7
Labour A Howlett3,16030.1
Liberal Democrats M Rich1,65315.7
Liberal Democrats J Williams1,63915.6
Green R Eddleston6496.2
Turnout 10,51268.6
Registered electors 15,325
Conservative win (new seat)

* Incumbent councillor for Toton and Attenborough division prior to boundary changes.

Eastwood

Eastwood
PartyCandidateVotes%
Labour Ellie Lodziak (inc) 2,225 47.5
Conservative T Spencer1,00221.4
Liberal Democrats E Birkitt79216.9
Independent C Robb66114.1
Turnout 4,68058.3
Registered electors 8,024
Labour win (new seat)

Kimberley and Trowell

Kimberley and Trowell
PartyCandidateVotes%
Liberal Democrats Ken Rigby 2,202 37.3
Labour M Clarke1,88531.9
Conservative L Ball1,82130.8
Turnout 5,90866.8
Registered electors 8,842
Liberal Democrats win (new boundaries)

Nuthall

Nuthall
PartyCandidateVotes%
Conservative Philip Owen 1,945 38.4
Labour J Pearce1,37527.1
Independent Sue Wildey1,10821.9
Liberal Democrats W Longdon4919.7
Veritas G Green1492.9
Turnout 5,06868.2
Registered electors 7,435
Conservative win (new seat)

Gedling

(10 seats, 6 electoral divisions)

Gedling District
PartyCandidatesVotes
StoodElectedGainedUnseatedNet % of total %No.Net %
  Labour 10740.122,235Decrease2.svg-2.8
  Conservative 10340.022,169Increase2.svg+0.4
  Liberal Democrats 8017.89,887Increase2.svg+4.4
  BNP 101.1584NEW
  UKIP 101.0531NEW
Gedling Turnout
Registered electors86,806
Votes cast53,326
Turnout61.4% (Decrease2.svg-1.6)

Arnold North

Arnold North
PartyCandidateVotes%
Labour Jennifer Cole 4,991 45.6
Labour John Stocks (inc)* 4,334 39.6
Conservative Veronica Pepper (inc)✝4,28939.2
Conservative Gerald Clarke4,27939.1
Liberal Democrats M Swift1,97418.0
Liberal Democrats A Sowter1,96317.9
Turnout 10,94059.1
Registered electors 18,511
Labour win (new seat)

* Incumbent councillor for Calverton division prior to boundary changes. ✝ Incumbent councillor for Arnold East division prior to boundary changes.

Arnold South

Arnold South
PartyCandidateVotes%
Conservative Rod Kempster (inc)* 5,049 43.1
Labour Peter Barnes 4,769 40.8
Conservative Mel Shepherd4,48038.3
Labour J Truscott4,12935.3
Liberal Democrats A Swift2,24919.2
Liberal Democrats R Dawson2,13118.2
UKIP P Foulkes5314.5
Turnout 11,70264.4
Registered electors 18,172
Conservative win (new seat)
Labour win (new seat)

* Incumbent councillor for Arnold Central division prior to boundary changes.

Calverton

Calverton
PartyCandidateVotes%
Conservative Mark Spencer 2,799 55.4
Labour James Woodward (inc)*2,25044.6
Turnout 5,04963.8
Registered electors 7,911
Conservative win (new boundaries)

* Incumbent councillor for Arnold West division prior to boundary changes.

Carlton East

Carlton East
PartyCandidateVotes%
Labour John Clarke (inc)* 4,000 38.9
Labour James O'Riordan 3,721 36.1
Liberal Democrats Richard Berry3,37832.8
Conservative P Blandamer3,33832.4
Conservative T Butcher3,22531.3
Liberal Democrats C Pratt3,07029.8
Turnout 10,29660.4
Registered electors 17,047
Labour win (new boundaries)

* Incumbent councillor for Carlton South division prior to boundary changes.

Carlton West

Carlton West
PartyCandidateVotes%
Labour Jim Creamer 4,382 43.1
Labour Darrell Pulk (inc) 4,200 41.3
Conservative E Collin3,37533.2
Conservative E Goodwin3,33032.7
Liberal Democrats A Dunkin2,28622.5
Liberal Democrats P Hughes2,16621.3
BNP B Wheeldon5845.7
Turnout 10,17758.4
Registered electors 17,428
Labour win (new boundaries)

Newstead

Newstead
PartyCandidateVotes%
Conservative Joe Lonergan (inc) 3,319 64.3
Labour Leoni Mathers1,84335.7
Turnout 5,16266.7
Registered electors 7,737
Conservative win (new boundaries)

Mansfield

(9 seats, 5 electoral divisions)

Mansfield District
PartyCandidatesVotes
StoodElectedGainedUnseatedNet % of total %No.Net %
  Labour 9939.318,560Decrease2.svg-13.7
  Independent 8022.010,398Increase2.svg+16.6
  Conservative 7016.77,868Decrease2.svg-10.0
  Liberal Democrats 5015.47,253Increase2.svg+3.3
  Green 406.63,126Increase2.svg+3.9
Mansfield Turnout
Registered electors77,569
Votes cast43,406
Turnout56.0% (Increase2.svg+1.2)

Mansfield East

Mansfield East
PartyCandidateVotes%
Labour G Kane 3,997 40.9
Labour Chris Winterton (inc)* 2,854 29.2
Independent D Etches2,46125.2
Conservative Brian Marshall2,13221.8
Liberal Democrats R Heywood1,97620.2
Conservative N Ward1,82818.7
Green P Frost1,01910.4
Turnout 9,76456.0
Registered electors 17,436
Labour win (new seat)

* Incumbent councillor for Titchfield and Eakring division prior to boundary changes.

Mansfield North

Mansfield North
PartyCandidateVotes%
Labour Joyce Bosnjak (inc)* 3,900 40.5
Labour Parry Tsimbiridis (inc)✝ 2,878 29.9
Liberal Democrats P Smith2,16122.5
Independent E Betts2,15822.4
Liberal Democrats G Greenhough2,06221.4
Conservative A Beattie1,87719.5
Green R Parkin7047.3
Turnout 9,62056.0
Registered electors 17,180
Labour win (new seat)

* Incumbent councillor for Ravensdale and Sherwood division prior to boundary changes. ✝ Incumbent councillor for Leeming and Forest Town division prior to boundary changes.

Mansfield South

Mansfield South
PartyCandidateVotes%
Labour Albert Haynes 3,358 34.8
Labour K Wakefield 2,420 25.1
Independent K Allsop2,19422.8
Independent Tom Appleby1,98920.6
Conservative K Rees1,87119.4
Conservative Philip Smith1,70617.7
Liberal Democrats R Hallam1,59816.6
Green J Jackson7317.6
Independent B Bagri6486.7
Turnout 9,64055.5
Registered electors 17,370
Labour win (new seat)

Mansfield West

Mansfield West
PartyCandidateVotes%
Labour John Carter (inc)* 4,084 44.6
Labour Paul Henshaw 3,768 41.1
Independent M Revill2,17723.8
Independent D Smith1,88320.5
Liberal Democrats D Rumley1,51816.6
Conservative E Hatton1,39915.3
Green M Comerford6727.3
Turnout 9,16455.1
Registered electors 16,632
Labour win (new seat)

Warsop

Warsop
PartyCandidateVotes%
Labour John Allin 3,221 61.7
Independent R Lilley1,40827.0
Conservative J Rees58911.3
Turnout 5,21858.3
Registered electors 8,951
Labour win (new boundaries)

Newark and Sherwood

(10 seats, 10 electoral divisions)

Newark and Sherwood District
PartyCandidatesVotes
StoodElectedGainedUnseatedNet % of total %No.Net %
  Conservative 8741.920,283Increase2.svg+2.9
  Labour 9330.014,544Decrease2.svg-7.8
  Liberal Democrats 7020.29,769Increase2.svg+3.1
  Independent 407.93,824Increase2.svg+1.8
Newark and Sherwood Turnout
Registered electors75,677
Votes cast48,420
Turnout64.0% (Increase2.svg+1.1)

Balderton

Balderton
PartyCandidateVotes%
Conservative Keith Walker (inc) 2,012 43.8
Labour J Weinbren1,67136.4
Liberal Democrats Neil Allen90619.7
Turnout 4,58959.5
Registered electors 7,715
Conservative win (new boundaries)

Blidworth

Blidworth
PartyCandidateVotes%
Labour Yvonne Woodhead (inc) 2,579 56.2
Independent Geoff Merry2,00743.8
Turnout 4,58656.1
Registered electors 8,177
Labour win (new boundaries)

Collingham

Collingham
PartyCandidateVotes%
Conservative Vincent Dobson (inc) 3,130 50.5
Labour L Goff1,83929.7
Liberal Democrats Marylyn Rayner1,23019.8
Turnout 6,19964.1
Registered electors 9,664
Conservative win (new boundaries)

Farndon and Muskham

Farndon and Muskham
PartyCandidateVotes%
Conservative Sue Saddington 2,509 54.2
Liberal Democrats D Logue1,30728.2
Labour V Hall81317.6
Turnout 4,62974.0
Registered electors 6,256
Conservative win (new seat)

Farnsfield and Lowdham

Farnsfield and Lowdham
PartyCandidateVotes%
Conservative Andy Stewart 3,618 57.0
Labour M Pain1,33821.1
Liberal Democrats G Ball1,13217.8
Independent T Cutler2574.1
Turnout 6,34572.5
Registered electors 8,747
Conservative win (new seat)

Newark East

Newark East
PartyCandidateVotes%
Conservative Peter Prebble (inc)* 1,865 41.5
Labour A Bradbury1,67037.1
Liberal Democrats I Harrison96421.4
Turnout 4,49960.1
Registered electors 7,483
Conservative win (new seat)

Newark West

Newark West
PartyCandidateVotes%
Conservative Keith Girling 1,868 41.9
Labour A Hannaford1,72538.7
Liberal Democrats A Hargreaves86619.4
Turnout 4,45954.3
Registered electors 8,209
Conservative win (new seat)

Ollerton and Boughton

Ollerton and Boughton
PartyCandidateVotes%
Labour Stella Smedley (inc) Unopposed
Labour win (new boundaries)

Rufford

Rufford
PartyCandidateVotes%
Labour Andrew Freeman (inc) 2,909 48.4
Conservative R Bradbury1,54225.7
Independent J Faben95415.9
Independent V Bobo60610.1
Turnout 6,01161.7
Registered electors 9,744
Labour win (new seat)

Southwell and Caunton

Southwell and Caunton
PartyCandidateVotes%
Conservative Bruce Laughton (inc)* 3,739 52.6
Liberal Democrats S Thompstone3,36447.4
Turnout 7,10373.4
Registered electors 9,682
Conservative win (new seat)

* Incumbent councillor for Caunton division prior to boundary changes.

Rushcliffe

(9 seats, 8 electoral divisions)

Rushcliffe District
PartyCandidatesVotes
StoodElectedGainedUnseatedNet % of total %No.Net %
  Conservative 9945.325,279Increase2.svg+0.9
  Liberal Democrats 9025.414,164Increase2.svg+1.4
  Labour 9025.314,149Decrease2.svg-6.3
  Green 403.82,098NEW
  Independent 100.3146NEW
Rushcliffe Turnout
Registered electors80,375
Votes cast56,042
Turnout69.7% (Increase2.svg+3.0)

Bingham

Bingham
PartyCandidateVotes%
Conservative Martin Suthers (inc) 2,709 43.4
Liberal Democrats George Davidson1,91530.6
Labour B Howes1,47823.7
Independent M Morar1462.3
Turnout 6,24868.7
Registered electors 9,095
Conservative win (new boundaries)

Cotgrave

Cotgrave
PartyCandidateVotes%
Conservative Richard Butler (inc) 2,333 45.3
Labour A Macinnes1,82735.5
Liberal Democrats S Hull98719.2
Turnout 5,14763.1
Registered electors 8,156
Conservative win (new boundaries)

Keyworth

Keyworth
PartyCandidateVotes%
Conservative John Cottee (inc) 3,009 47.7
Liberal Democrats S Boote2,55840.5
Labour R Crosby74211.8
Turnout 6,30974.6
Registered electors 8,453
Conservative win (new boundaries)

Radcliffe on Trent

Radcliffe on Trent
PartyCandidateVotes%
Conservative Kay Cutts (inc) 3,631 54.2
Liberal Democrats D Allen1,56923.4
Labour W Stephens1,49722.4
Turnout 6,69771.1
Registered electors 9,420
Conservative win (new boundaries)

Ruddington

Ruddington
PartyCandidateVotes%
Conservative Reg Adair 2,805 47.8
Liberal Democrats P McGowan1,63427.8
Labour G Aldridge1,11719.0
Green T Gallagher3155.4
Turnout 5,87172.3
Registered electors 8,122
Conservative win (new boundaries)

Soar Valley

Soar Valley
PartyCandidateVotes%
Conservative Lynn Sykes 2,932 47.9
Labour Paul Morrissey1,86530.4
Liberal Democrats C Evans1,33021.7
Turnout 6,12769.4
Registered electors 8,829
Conservative win (new seat)

West Bridgford Central and South

West Bridgford Central and South
PartyCandidateVotes%
Conservative Michael Cox (inc)* 4,873 37.7
Conservative Barrie Cooper 4,755 36.8
Labour Graham Jackson (inc)✝3,82229.6
Labour Liz Plant3,75229.0
Liberal Democrats L Porter2,67820.7
Liberal Democrats Steve Travis2,44018.9
Green S Anthony1,35110.4
Green J Beresford1,2139.4
Turnout 12,93068.7
Registered electors 18,822

* Incumbent councillor for West Bridgford South division prior to boundary changes. ✝ Incumbent councillor for West Bridgford East division prior to boundary changes.

West Bridgford West

West Bridgford West
PartyCandidateVotes%
Conservative Martin Brandon-Bravo (inc) 2,987 44.5
Labour R Crawley1,80126.8
Liberal Democrats J Banks1,49322.2
Green B Hewis4326.4
Turnout 6,71370.8
Registered electors 9,478
Conservative win (new boundaries)

Related Research Articles

<span class="mw-page-title-main">Nottinghamshire</span> County of England

Nottinghamshire is a ceremonial county in the East Midlands of England. The county borders South Yorkshire to the north-west, Lincolnshire to the east, Leicestershire to the south, and Derbyshire to the west. The largest settlement is the city of Nottingham (323,632), which is also the county town.

<span class="mw-page-title-main">Borough of Broxtowe</span> Non-metropolitan district and borough in England

Broxtowe is a local government district with borough status in Nottinghamshire, England. It lies immediately west of the city of Nottingham, and most of the built-up areas of the borough form part of the Nottingham Urban Area. The council is based in Beeston and the borough also includes the towns of Eastwood, Kimberley and Stapleford and surrounding villages and rural areas.

<span class="mw-page-title-main">Rushcliffe</span> Non-metropolitan district and borough in England

Rushcliffe is a local government district with borough status in south Nottinghamshire, England. Its council is based in West Bridgford. The borough also includes the towns of Bingham and Cotgrave as well as numerous villages and surrounding rural areas. Some of the built-up areas in the north-west of the borough, including West Bridgford, form part of the Nottingham Urban Area.

<span class="mw-page-title-main">Rushcliffe (UK Parliament constituency)</span> Parliamentary constituency in the United Kingdom, 1885 onwards

Rushcliffe is a constituency in Nottinghamshire represented in the House of Commons of the UK Parliament from 2024 by James Naish, a Labour MP.

<span class="mw-page-title-main">Newark (UK Parliament constituency)</span> Parliamentary constituency in the United Kingdom, 1885 onwards

Newark is a constituency in Nottinghamshire, England. It is represented by Robert Jenrick of the Conservative Party, who won the seat in a by-election on 5 June 2014, following the resignation of Patrick Mercer in April 2014.

<span class="mw-page-title-main">Sherwood Forest (UK Parliament constituency)</span> Parliamentary constituency in the United Kingdom, 1983 onwards

Sherwood Forest is a constituency represented in the House of Commons of the UK Parliament since 2024 by Michelle Welsh, of the Labour Party. The constituency's name is shared with Sherwood Forest, which is in the area.

<span class="mw-page-title-main">Bassetlaw (UK Parliament constituency)</span> Parliamentary constituency in the United Kingdom, 1885 onwards

Bassetlaw is a parliamentary constituency in Nottinghamshire, represented in the House of Commons of the UK Parliament since the 2024 general election by Jo White, a Labour Party candidate. Before the 2019 general election, the seat had been part of the so-called "red wall", being held by the Labour Party since 1935 before falling to the Conservative Party.

<span class="mw-page-title-main">Broxtowe (UK Parliament constituency)</span> Parliamentary constituency in the United Kingdom, 1983 onwards

Broxtowe is a parliamentary constituency in Nottinghamshire, England, represented in the House of Commons of the UK Parliament since 2024 by Juliet Campbell, from the Labour Party.

Broxtowe Borough Council elections are held every four years. Broxtowe Borough Council is the local authority for the non-metropolitan district of Borough of Broxtowe in Nottinghamshire, England. Since the full review of boundaries in 2015, 44 councillors are elected from 20 wards.

Nottinghamshire County Council elections are held every four years. Nottinghamshire County Council is the upper-tier authority for the non-metropolitan county of Nottinghamshire in England. Since the last boundary changes in 2017, 66 county councillors have been elected from 56 electoral divisions.

<span class="mw-page-title-main">Nottinghamshire County Council</span> The upper-tier local authority for the non-metropolitan county of Nottinghamshire in England

Nottinghamshire County Council is the upper-tier local authority for the non-metropolitan county of Nottinghamshire in England. It consists of 66 county councillors, elected from 56 electoral divisions every four years. The most recent election was held in 2021.

<span class="mw-page-title-main">2009 Nottinghamshire County Council election</span> Elections to Nottinghamshire County Council

Elections to Nottinghamshire County Council took place on 4 June 2009, having been delayed from 7 May, in order to coincide with elections to the European Parliament.

<span class="mw-page-title-main">2013 Nottinghamshire County Council election</span> 2013 UK local government election

The Nottinghamshire County Council Election took place on 2 May 2013 as part of the 2013 United Kingdom local elections.

<span class="mw-page-title-main">1981 Nottinghamshire County Council election</span> 1981 UK local government election

The 1981 Nottinghamshire County Council election was held on Thursday, 7 May. Following boundary changes to the county's electoral divisions, the whole council of eighty-eight members was up for election. The Labour Party regained control from the Conservatives, winning fifty-five seats. The Conservatives won thirty-two councillors and one Residents' association councillor was elected in the Hucknall East division.

<span class="mw-page-title-main">2017 Nottinghamshire County Council election</span> 2017 election of all 66 councillors to Nottinghamshire County Council

The 2017 Nottinghamshire County Council election took place on 4 May 2017 as part of the 2017 local elections in the United Kingdom. The whole council of 66 councillors was elected for a four-year term spanning 56 electoral divisions, a minority of which return two councillors. The voting system used is first-past-the-post.

<span class="mw-page-title-main">2017 Hampshire County Council election</span> 2017 UK local government election

The 2017 Hampshire County Council election took place on 4 May 2017 as part of the 2017 local elections in the United Kingdom. All councillors were elected from electoral divisions by first-past-the-post voting for a four-year term of office. The electoral divisions were somewhat changed from the previous election, with some being split, merged or with boundary changes. No elections were held in Portsmouth and Southampton, which are unitary authorities and hold their elections in other years. Similarly the districts within Hampshire did also not hold elections this year.

<span class="mw-page-title-main">2021 Nottinghamshire County Council election</span> 2021 election of all 66 councillors to Nottinghamshire County Council

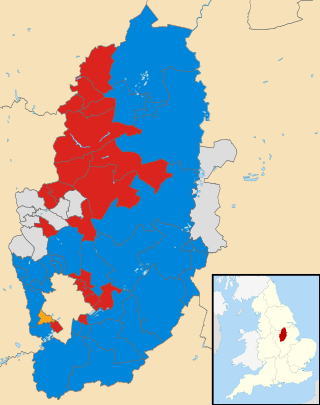
The 2021 Nottinghamshire County Council election took place on 6 May 2021 as part of the 2021 local elections in the United Kingdom. All 66 councillors were elected from 56 electoral divisions, which returned either one or two county councillors each by first-past-the-post voting for a four-year term of office.

References

  1. "Election Results". Nottinghamshire County Council. Retrieved 3 September 2016.
  2. 1 2 "Nottinghamshire County Council Election Results 1973-2009" (PDF). Elections Centre. Retrieved 3 September 2016.