This article needs additional citations for verification .(May 2020) |
| |||||||||||||||||
All 78 seats to Hampshire County Council 40 seats needed for a majority | |||||||||||||||||
---|---|---|---|---|---|---|---|---|---|---|---|---|---|---|---|---|---|
| |||||||||||||||||
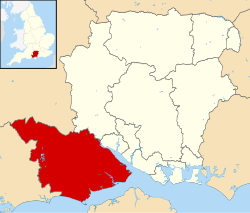
Map showing the results of the 2005 Hampshire County Council election. | |||||||||||||||||
|
An election to Hampshire County Council took place on 5 May 2005 as part of the 2005 United Kingdom local elections. [1] 78 councillors were elected from 75 electoral divisions, which returned either one or two county councillors each by first-past-the-post voting for a four-year term of office. The electoral divisions were changed from the previous election, but continued to be used for 2009. Elections in Portsmouth and Southampton did not coincide with this election, as they are unitary authorities, and therefore outside the area covered by the County Council.
The election saw the Conservatives remain in control, with 46 seats, giving a majority of six. The Liberal Democrats were the next biggest party, with 28 seats, followed by the Labour Party with four seats.
The table below only tallies the votes of the highest polling candidate for each party within each ward. This is known as the top candidate method and is often used for multi-member plurality elections. Candidates standing as "Liberal Democrat Local Resident" or "Labour Local Resident" banners are counted under the Liberal Democrats and Labour Parties respectively, and those standing as unaffiliated are counted as Independent.
Party | Seats | Gains | Losses | Net gain/loss | Seats % | Votes % | Votes | +/− | |
---|---|---|---|---|---|---|---|---|---|
Conservative | 46 | 58.97 | 43.90 | 275,009 | |||||
Liberal Democrats | 28 | 35.89 | 36.19 | 226,772 | |||||
Labour | 4 | 5.12 | 16.75 | 104,942 | |||||
Green | 0 | 0 | 1.52 | 9,563 | |||||
UKIP | 0 | 0 | 0.78 | 4,943 | |||||
Independent | 0 | 0 | 0.76 | 4,811 | |||||
English Democrat | 0 | 0 | 0.07 | 453 |
Party | Candidate | Votes | % | ±% | |
---|---|---|---|---|---|
Labour | Josephine Kelly | 2,855 | 37 | ||
Liberal Democrats | John Shaw | 2548 | 33 | ||
Conservative | Ronald Collins | 2233 | 29 | ||
Labour win (new seat) |
Party | Candidate | Votes | % | ±% | |
---|---|---|---|---|---|
Labour | Jane Frankum | 3,120 | 48 | ||
Liberal Democrats | Ronald Hussey | 1709 | 26 | ||
Conservative | Christine Heath | 1622 | 25 | ||
Labour win (new seat) |
Party | Candidate | Votes | % | ±% | |
---|---|---|---|---|---|
Conservative | Stephen Reid | 2,298 | 44 | ||
Labour | Stephen Wyeth | 2002 | 38 | ||
Liberal Democrats | Obi Nwasike | 917 | 18 | ||
Conservative win (new seat) |
Party | Candidate | Votes | % | ±% | |
---|---|---|---|---|---|
Liberal Democrats | Brian Gurden | 2,729 | 38 | ||
Conservative | Dan Putty | 2131 | 30 | ||
Labour | Andrew McCormick | 2006 | 28 | ||
UKIP | David Watson | 341 | 5 | ||
Liberal Democrats win (new seat) |
Party | Candidate | Votes | % | ±% | |
---|---|---|---|---|---|
Conservative | Philip Heath | 4,499 | 52 | ||
Labour | Paul Frankum | 1970 | 23 | ||
Liberal Democrats | Sheila Lock | 1770 | 21 | ||
Green | Darren Shirley | 345 | 4 | ||
Conservative win (new seat) |
Party | Candidate | Votes | % | ±% | |
---|---|---|---|---|---|
Conservative | Keith Chapman | 5,372 | 59 | ||
Liberal Democrats | Roger Ward | 2123 | 23 | ||
Labour | Terence Price | 1588 | 17 | ||
Conservative win (new seat) |
Party | Candidate | Votes | % | ±% | |
---|---|---|---|---|---|
Conservative | Anna McNair-Scott | 4,180 | 52 | ||
Liberal Democrats | John Burbidge-King | 2502 | 31 | ||
Labour | David Cavanagh | 1357 | 17 | ||
Conservative win (new seat) |
Party | Candidate | Votes | % | ±% | |
---|---|---|---|---|---|
Conservative | Elaine Still | 4,273 | 53 | ||
Liberal Democrats | Alan Read | 2502 | 31 | ||
Labour | Eileen Cavanagh | 1309 | 16 | ||
Conservative win (new seat) |
Party | Candidate | Votes | % | ±% | |
---|---|---|---|---|---|
Conservative | Marilyn Tucker | 2,786 | 41 | ||
Liberal Democrats | Josephine Slimin | 2633 | 39 | ||
Labour | Stephen Rothman | 1093 | 16 | ||
Green | Andrew White | 318 | 5 | ||
Conservative win (new seat) |
Party | Candidate | Votes | % | ±% | |
---|---|---|---|---|---|
Conservative | John Maxwell | 3,438 | 47 | ||
Liberal Democrats | John Wall | 3121 | 43 | ||
Labour | James Gibb | 688 | 9 | ||
Conservative win (new seat) |
Party | Candidate | Votes | % | ±% | |
---|---|---|---|---|---|
Liberal Democrats | Angela Roling | 4,029 | 46 | ||
Conservative | Christopher Rhodes | 2629 | 30 | ||
Labour | Gwendoline Borrill | 1707 | 19 | ||
UKIP | George McGuinness | 445 | 5 | ||
Liberal Democrats win (new seat) |
Party | Candidate | Votes | % | ±% | |
---|---|---|---|---|---|
Liberal Democrats | Derek Blampied | 4,188 | 45 | ||
Conservative | Jeremy Hall | 3468 | 37 | ||
Labour | Geoffrey Kosted | 1276 | 14 | ||
UKIP | Michale O'Donoghue | 477 | 5 | ||
Liberal Democrats win (new seat) |
Party | Candidate | Votes | % | ±% | |
---|---|---|---|---|---|
Conservative | Colin Davidovitz | 3,951 | 45 | ||
Liberal Democrats | Pamela Holden-Brown | 3592 | 41 | ||
UKIP | Paul Webber | 844 | 10 | ||
Labour | Kevin Butt | 329 | 4 | ||
Conservative win (new seat) |
Party | Candidate | Votes | % | ±% | |
---|---|---|---|---|---|
Liberal Democrats | Glynn Davies-Dear | 3,579 | 47 | ||
Labour | Susan Toher | 1853 | 24 | ||
Conservative | Thomas Harvey | 1759 | 23 | ||
UKIP | Stephen Challis | 389 | 5 | ||
Independent | Alan Sneddon | 80 | 1 | ||
Liberal Democrats win (new seat) |
Party | Candidate | Votes | % | ±% | |
---|---|---|---|---|---|
Liberal Democrats | Alan Broadhurst | 3,497 | 43 | ||
Labour | Peter Luffman | 2311 | 28 | ||
Conservative | Stephen Gosling | 1926 | 24 | ||
UKIP | Samuel Snook | 389 | 5 | ||
Liberal Democrats win (new seat) |
Party | Candidate | Votes | % | ±% | |
---|---|---|---|---|---|
Liberal Democrats | Keith House | 4,276 | 49 | ||
Conservative | John Milne | 3215 | 37 | ||
Labour | Edward White | 1315 | 15 | ||
Liberal Democrats win (new seat) |
Party | Candidate | Votes | % | ±% | |
---|---|---|---|---|---|
Liberal Democrats | Carol Boulton | 3,705 | 45 | ||
Conservative | Colin Murphy | 3042 | 37 | ||
Labour | Nancy Smith | 1257 | 15 | ||
UKIP | Peter Stewart | 278 | 3 | ||
Liberal Democrats win (new seat) |
Party | Candidate | Votes | % | ±% | |
---|---|---|---|---|---|
Conservative | Mark Kemp-Gee | 5,064 | 52 | ||
Liberal Democrats | Linda Harmer-Jones | 3671 | 38 | ||
Labour | Janice Treacher | 972 | 10 | ||
Conservative win (new seat) |
Party | Candidate | Votes | % | ±% | |
---|---|---|---|---|---|
Liberal Democrats | Anthony Ludlow | 4,294 | 51 | ||
Conservative | Caroline Dibden | 2832 | 33 | ||
Labour | Barbara Burfoot | 1337 | 16 | ||
Liberal Democrats win (new seat) |
Party | Candidate | Votes | % | ±% | |
---|---|---|---|---|---|
Liberal Democrats | Adam Carew | 2,824 | 47 | ||
Conservative | Guy Stacpoole | 2075 | 35 | ||
Labour | John Tough | 1107 | 18 | ||
Liberal Democrats win (new seat) |
Party | Candidate | Votes | % | ±% | |
---|---|---|---|---|---|
Conservative | Eunice Byrom | 3,680 | 45 | ||
Liberal Democrats | James (Mike) Ashton | 3647 | 44 | ||
Labour | Peter Treacher | 932 | 11 | ||
Conservative win (new seat) |
Party | Candidate | Votes | % | ±% | |
---|---|---|---|---|---|
Conservative | Simon James | 4,845 | 58 | ||
Liberal Democrats | Richard Clifford | 2380 | 28 | ||
Labour | Mark Walsh | 1138 | 14 | ||
Conservative win (new seat) |
Party | Candidate | Votes | % | ±% | |
---|---|---|---|---|---|
Liberal Democrats | Samantha Payne | 3,733 | 43 | ||
Conservative | David Fleming | 3670 | 43 | ||
Labour | William Organ | 1180 | 14 | ||
Liberal Democrats win (new seat) |
Party | Candidate | Votes | % | ±% | |
---|---|---|---|---|---|
Conservative | Michael Cartwright | 4,410 | 51 | ||
Liberal Democrats | Elizabeth Mullenger | 3036 | 38 | ||
Labour | Moira Johnson | 920 | 11 | ||
Conservative win (new seat) |
Party | Candidate | Votes | % | ±% | |
---|---|---|---|---|---|
Conservative | Timothy Knight | 4,208 | 51 | ||
Liberal Democrats | James Forrest | 2749 | 33 | ||
Labour | Ian Christie | 1268 | 15 | ||
Conservative win (new seat) |
Party | Candidate | Votes | % | ±% | |
---|---|---|---|---|---|
Liberal Democrats | Roger Price | 4,451 | 46 | ||
Conservative | Nicholas Walker | 3298 | 34 | ||
Labour | Richard Ryan | 2014 | 21 | ||
Liberal Democrats win (new seat) |
Party | Candidate | Votes | % | ±% | |
---|---|---|---|---|---|
Conservative | Seán Woodward | 4,200 | 61 | ||
Liberal Democrats | Mark Christie | 1396 | 20 | ||
Labour | Clive Coldwell | 1245 | 18 | ||
Conservative win (new seat) |
Party | Candidate | Votes | % | ±% | |
---|---|---|---|---|---|
Conservative | Geoffrey Hockley | 3,489 | 49 | ||
Liberal Democrats | Jonathan Englefield | 2219 | 31 | ||
Labour | Leslie Ricketts | 1219 | 17 | ||
Green | Julie Blenkharn | 214 | 3 | ||
Conservative win (new seat) |
Party | Candidate | Votes | % | ±% | |
---|---|---|---|---|---|
Conservative | John Bryant | 7,585 | 24 | ||
Conservative | Raymond Ellis | 6,722 | 21 | ||
Liberal Democrats | Eric Dunn | 4900 | 16 | ||
Liberal Democrats | Donald (Jim) Murray | 4685 | 15 | ||
Labour | Angela Carr | 3546 | 11 | ||
Labour | Stuart Rose | 2682 | 9 | ||
Green | David Harrison | 1289 | 4 | ||
Conservative win (new seat) | |||||
Conservative win (new seat) |
Party | Candidate | Votes | % | ±% | |
---|---|---|---|---|---|
Conservative | Keith Evans | 4,121 | 55 | ||
Liberal Democrats | David Savage | 1614 | 22 | ||
Labour | Nicholas Knight | 1313 | 18 | ||
Green | Lois Tarbet | 394 | 5 | ||
Conservative win (new seat) |
Party | Candidate | Votes | % | ±% | |
---|---|---|---|---|---|
Labour | Dennis Wright | 3,459 | 47 | ||
Conservative | Stephen Ward | 2360 | 32 | ||
Liberal Democrats | Wayne Richards | 1466 | 20 | ||
Labour win (new seat) |
Party | Candidate | Votes | % | ±% | |
---|---|---|---|---|---|
Liberal Democrats | Peter Chegwyn | 2,184 | 35 | ||
Conservative | Peter Langdon | 2014 | 32 | ||
Labour | Kenneth Searle | 1730 | 27 | ||
Green | Noelle Bradshaw | 367 | 6 | ||
Liberal Democrats win (new seat) |
Party | Candidate | Votes | % | ±% | |
---|---|---|---|---|---|
Conservative | Margaret Snaith | 3,458 | 52 | ||
Labour | Victor Burt | 1798 | 27 | ||
Liberal Democrats | Mark Mudie | 1456 | 22 | ||
Conservative win (new seat) |
Party | Candidate | Votes | % | ±% | |
---|---|---|---|---|---|
Conservative | Peter Edgar | 5575 | 21 | ||
Liberal Democrats | Keith Gill | 4769 | 18 | ||
Conservative | Michael Geddes | 4430 | 17 | ||
Liberal Democrats | David Smith | 3987 | 15 | ||
Labour | Diane Searle | 3311 | 13 | ||
Green | Terry Mitchell | 1001 | 4 | ||
Conservative win (new seat) | |||||
Liberal Democrats win (new seat) | |||||
Turnout |
Party | Candidate | Votes | % | ±% | |
---|---|---|---|---|---|
Conservative | Peter Hutcheson | 4,482 | 53 | ||
Liberal Democrats | David Neighbour | 2889 | 34 | ||
Labour | James White | 1116 | 13 | ||
Conservative win (new seat) |
Party | Candidate | Votes | % | ±% | |
---|---|---|---|---|---|
Conservative | Sharyn Wheale | 3,460 | 39 | ||
Independent | Denis Gotel | 2116 | 24 | ||
Liberal Democrats | Rodney Fisher | 2101 | 24 | ||
Labour | Laura Jones | 857 | 10 | ||
Green | Maria Keith | 838 | 4 | ||
Conservative win (new seat) |
Party | Candidate | Votes | % | ±% | |
---|---|---|---|---|---|
Liberal Democrats | David Simpson | 4,042 | 46 | ||
Conservative | Stephen Parker | 3408 | 39 | ||
Independent | Katherine Parish | 1297 | 15 | ||
Liberal Democrats win (new seat) |
Party | Candidate | Votes | % | ±% | |
---|---|---|---|---|---|
Conservative | Jonathan Glen | 4,837 | 58 | ||
Liberal Democrats | Vivien Street | 1797 | 22 | ||
Labour | John Davies | 1029 | 13 | ||
Green | Lars Mosesson | 577 | 7 | ||
Conservative win (new seat) |
Party | Candidate | Votes | % | ±% | |
---|---|---|---|---|---|
Liberal Democrats | Adrian Collett | 4,649 | 55 | ||
Conservative | Vivienne Gascoigne | 2686 | 32 | ||
Labour | David Jenkins | 869 | 10 | ||
UKIP | John Howe | 302 | 4 | ||
Liberal Democrats win (new seat) |
Party | Candidate | Votes | % | ±% | |
---|---|---|---|---|---|
Liberal Democrats | Ann Buckley | 4,607 | 19 | ||
Labour Co-op | Anne Edwards | 4,497 | 18 | ||
Labour Co-op | Virginia Steel | 3646 | 15 | ||
Liberal Democrats | Stephen Marshall | 3583 | 15 | ||
Conservative | Yvonne Weeks | 3441 | 14 | ||
Conservative | Jennifer Wride | 3380 | 14 | ||
UKIP | Andrew Little | 753 | 3 | ||
Green | Karen Griffiths | 730 | 3 | ||
Liberal Democrats win (new seat) | |||||
Labour win (new seat) |
Party | Candidate | Votes | % | ±% | |
---|---|---|---|---|---|
Conservative | John West | 2,742 | 39 | ||
Liberal Democrats | Ray Cobbett | 2329 | 33 | ||
Labour | Kenneth Monks | 1541 | 22 | ||
Green | Ann Gleed | 371 | 5 | ||
Conservative win (new seat) |
Party | Candidate | Votes | % | ±% | |
---|---|---|---|---|---|
Conservative | David Gillett | 5,191 | 51 | ||
Liberal Democrats | Flora (Faith) Posonby | 2571 | 25 | ||
Labour | William Gilchrist | 1770 | 17 | ||
Green | Tim Dawes | 711 | 7 | ||
Conservative win (new seat) |
Party | Candidate | Votes | % | ±% | |
---|---|---|---|---|---|
Conservative | Edward Gale | 4,726 | 53 | ||
Labour | Sheila Mealy | 2016 | 23 | ||
Liberal Democrats | Janis Shawashi | 1495 | 17 | ||
Green | Gillian Leek | 639 | 7 | ||
Conservative win (new seat) |
Party | Candidate | Votes | % | ±% | |
---|---|---|---|---|---|
Conservative | Robin McIntosh | 3,132 | 43 | ||
Labour | Nicola Potts | 2204 | 30 | ||
Liberal Democrats | Christine Pylee | 1417 | 20 | ||
Green | Wendy Smith | 478 | 7 | ||
Conservative win (new seat) |
Party | Candidate | Votes | % | ±% | |
---|---|---|---|---|---|
Conservative | Ian Beagley | 3,812 | 48 | ||
Liberal Democrats | John Jacobs | 2097 | 26 | ||
Labour | Carl Roberts | 1634 | 20 | ||
Green | Jacqueline Turner | 443 | 6 | ||
Conservative win (new seat) |
Party | Candidate | Votes | % | ±% | |
---|---|---|---|---|---|
Conservative | Thomas (Ken) Thornber | 5,039 | 67 | ||
Liberal Democrats | Christopher Harrison | 2511 | 33 | ||
Conservative win (new seat) |
Party | Candidate | Votes | % | ±% | |
---|---|---|---|---|---|
Liberal Democrats | Brian Dash | 6,061 | 62 | ||
Conservative | Frank Vickers | 3736 | 38 | ||
Liberal Democrats win (new seat) |
Party | Candidate | Votes | % | ±% | |
---|---|---|---|---|---|
Conservative | Katherine Heron | 3,922 | 50 | ||
Liberal Democrats | Robert Hale | 3242 | 41 | ||
Labour | Audrey Walker | 676 | 9 | ||
Conservative win (new seat) |
Party | Candidate | Votes | % | ±% | |
---|---|---|---|---|---|
Conservative | Adrian Evans | 4,204 | 56 | ||
Liberal Democrats | Martina Humber | 2330 | 31 | ||
Labour | Stephen Short | 917 | 12 | ||
Conservative win (new seat) |
Party | Candidate | Votes | % | ±% | |
---|---|---|---|---|---|
Conservative | Mel Kendal | 4,931 | 57 | ||
Liberal Democrats | Leonard Harris | 2701 | 31 | ||
Labour | Kenneth Kershaw | 1066 | 12 | ||
Conservative win (new seat) |
Party | Candidate | Votes | % | ±% | |
---|---|---|---|---|---|
Conservative | Alan Rice | 5,349 | 63 | ||
Liberal Democrats | Wynford Davies | 3170 | 37 | ||
Conservative win (new seat) |
Party | Candidate | Votes | % | ±% | |
---|---|---|---|---|---|
Conservative | Patricia Banks | 4,837 | 54 | ||
Liberal Democrats | Margaret Newlands | 2001 | 22 | ||
Labour | Peter Dance | 1364 | 15 | ||
UKIP | Martin Field | 725 | 8 | ||
Conservative win (new seat) |
Party | Candidate | Votes | % | ±% | |
---|---|---|---|---|---|
Conservative | Nigel Clarke | 3,725 | 52 | ||
Liberal Democrats | Miranda Whitehead | 2052 | 28 | ||
Labour | Peter Harper | 1452 | 20 | ||
Conservative win (new seat) |
Party | Candidate | Votes | % | ±% | |
---|---|---|---|---|---|
Liberal Democrats | Lee Dunsdon | 4,601 | 61 | ||
Conservative | Alexis McEvoy | 2903 | 39 | ||
Liberal Democrats win (new seat) |
Party | Candidate | Votes | % | ±% | |
---|---|---|---|---|---|
Liberal Democrats | Alan Weeks | 3,210 | 41 | ||
Conservative | Frank Bright | 3096 | 40 | ||
Labour | Peter Sopowski | 1522 | 19 | ||
Liberal Democrats win (new seat) |
Party | Candidate | Votes | % | ±% | |
---|---|---|---|---|---|
Liberal Democrats | David Harrison | 3,145 | 37 | ||
Conservative | Sharon (Ronnie) Belfitt | 3975 | 35 | ||
Labour | Alan Goodfellow | 1628 | 19 | ||
Independent | Edith Randall | 748 | 9 | ||
Liberal Democrats win (new seat) |
Party | Candidate | Votes | % | ±% | |
---|---|---|---|---|---|
Conservative | Eric Neal | 2,439 | 37 | ||
Labour | Michael Roberts | 2276 | 34 | ||
Liberal Democrats | Ian Colpus | 1944 | 29 | ||
Conservative win (new seat) |
Party | Candidate | Votes | % | ±% | |
---|---|---|---|---|---|
Conservative | Roger Kimber | 2,448 | 44 | ||
Liberal Democrats | Philip Thompson | 1445 | 26 | ||
Labour | Peter Rust | 1343 | 24 | ||
Green | Julia Fowler | 351 | 6 | ||
Conservative win (new seat) |
Party | Candidate | Votes | % | ±% | |
---|---|---|---|---|---|
Conservative | Roderick Baulk | 2,465 | 37 | ||
Liberal Democrats | Charles Fraser-Fleming | 2222 | 33 | ||
Labour | June Smith | 1423 | 21 | ||
Independent | Jon Weston | 570 | 9 | ||
Conservative win (new seat) |
Party | Candidate | Votes | % | ±% | |
---|---|---|---|---|---|
Conservative | Patricia Devereux | 4,067 | 51 | ||
Liberal Democrats | Linda Neal | 2667 | 33 | ||
Labour | Barry Jones | 1296 | 16 | ||
Conservative win (new seat) |
Party | Candidate | Votes | % | ±% | |
---|---|---|---|---|---|
Conservative | Carol Leversha | 3,390 | 42 | ||
Liberal Democrats | Craig Card | 2927 | 36 | ||
Labour | Clive Grattan | 1390 | 17 | ||
English Democrat | Gary Cowd | 453 | 6 | ||
Conservative win (new seat) |
Party | Candidate | Votes | % | ±% | |
---|---|---|---|---|---|
Liberal Democrats | Robin Hughes | 2,732 | 38 | ||
Conservative | Kenneth Whitehouse | 2708 | 38 | ||
Labour | Michael Mumford | 1669 | 23 | ||
Liberal Democrats win (new seat) |
Party | Candidate | Votes | % | ±% | |
---|---|---|---|---|---|
Conservative | David Kirk | 3,344 | 45 | ||
Liberal Democrats | Rodney Bailey | 1899 | 26 | ||
Labour | Paul Goddard | 1528 | 21 | ||
Green | James Todd | 638 | 9 | ||
Conservative win (new seat) |
Party | Candidate | Votes | % | ±% | |
---|---|---|---|---|---|
Conservative | Pat West | 4,492 | 55 | ||
Liberal Democrats | Peter Wilson | 2045 | 25 | ||
Labour | Alan Cotter | 1672 | 20 | ||
Conservative win (new seat) |
Party | Candidate | Votes | % | ±% | |
---|---|---|---|---|---|
Liberal Democrats | Alan Dowden | 5,056 | 56 | ||
Conservative | Robin Oliver | 3138 | 35 | ||
Labour | Beryl Addison | 772 | 9 | ||
Liberal Democrats win (new seat) |
Party | Candidate | Votes | % | ±% | |
---|---|---|---|---|---|
Conservative | Roy Perry | 4,431 | 53 | ||
Liberal Democrats | Dorothy Baverstock | 3014 | 36 | ||
Labour | Amanda Ford | 871 | 10 | ||
Conservative win (new seat) |
Party | Candidate | Votes | % | ±% | |
---|---|---|---|---|---|
Liberal Democrats | Mark Cooper | 4,052 | 49 | ||
Conservative | John Ray | 3582 | 43 | ||
Labour | David Moran | 684 | 10 | ||
Liberal Democrats win (new seat) |
Party | Candidate | Votes | % | ±% | |
---|---|---|---|---|---|
Conservative | Michael Woodhall | 6,077 | 59 | ||
Liberal Democrats | Alistair Anderson | 3118 | 30 | ||
Labour | Albert Edwards | 1037 | 10 | ||
Conservative win (new seat) |
Party | Candidate | Votes | % | ±% | |
---|---|---|---|---|---|
Liberal Democrats | Peter Mason | 4,579 | 51 | ||
Conservative | Peter Ellerton | 3568 | 40 | ||
Labour | Stephen Haines | 857 | 10 | ||
Liberal Democrats win (new seat) |
Party | Candidate | Votes | % | ±% | |
---|---|---|---|---|---|
Liberal Democrats | Jackie Porter | 4,055 | 45 | ||
Conservative | Barry Lipscomb | 3999 | 44 | ||
Labour | Elaine Fullaway | 665 | 7 | ||
Green | Elizabeth (Alison) Craig | 369 | 4 | ||
Liberal Democrats win (new seat) |
Party | Candidate | Votes | % | ±% | |
---|---|---|---|---|---|
Conservative | Felicity Hindson | 4,499 | 53 | ||
Liberal Democrats | Christopher Day | 3349 | 39 | ||
Labour | Timothy Curran | 657 | 8 | ||
Conservative win (new seat) |
Party | Candidate | Votes | % | ±% | |
---|---|---|---|---|---|
Liberal Democrats | Charlotte Bailey | 4,593 | 49 | ||
Conservative | Susan Evershed | 4173 | 44 | ||
Labour Co-op | Antony De Peyer | 614 | 7 | ||
Liberal Democrats win (new seat) |
Party | Candidate | Votes | % | ±% | |
---|---|---|---|---|---|
Liberal Democrats | Pamela Peskett | 4,244 | 47 | ||
Conservative | Felicia Drummond | 3110 | 35 | ||
Labour | Chris Pines | 1596 | 18 | ||
Liberal Democrats win (new seat) |
Party | Candidate | Votes | % | ±% | |
---|---|---|---|---|---|
Conservative | Frederick Allgood | 3,981 | 52 | ||
Liberal Democrats | Stephen Nicholls | 2795 | 37 | ||
Labour | Patrichia Hayward | 825 | 11 | ||
Conservative win (new seat) |
Party | Candidate | Votes | % | ±% | |
---|---|---|---|---|---|
Liberal Democrats | Phrynette Dickens | 4,426 | 49 | ||
Conservative | Ian Tait | 3116 | 34 | ||
Labour | Patrick Davies | 1496 | 17 | ||
Liberal Democrats win (new seat) |
Sketty is an electoral ward in the City and County of Swansea, Wales, UK. The electoral ward is coterminous with the community.
Guildford Borough Council in Surrey, England is elected every four years.
Elections to the Borough Council in Slough, England, were held on 3 May 2007. One third of the council was up for election. This was the 122nd Slough general local authority election since Slough became a local government unit in 1863.
Elections to Suffolk County Council were held on 4 June 2009 as part of the 2009 United Kingdom local elections on the same day as the elections to the European Parliament. 75 councillors were elected from 63 electoral divisions, which returned either one or two county councillors each by first-past-the-post voting for a four-year term of office. The electoral divisions were the same as those used at the previous election in 2005.
Elections to the Borough Council in Slough, England, were held on 1 May 2008. This was the 123rd Slough general local authority election since Slough became a local government unit in 1863.
An election to Cumbria County Council took place on 2 May 2009 as part of the 2009 United Kingdom local elections. All 84 councillors were elected from various electoral divisions, which returned one or two county councillors each by first-past-the-post voting for a four-year term of office. They coincided with an election for the European Parliament. All 84 seats in the Council were up for election, and a total of 301 candidates stood. The total number of people registered to vote was 392,931. Prior to the election local Conservatives were leading a coalition with the Liberal Democrats with the Labour party as the council's official opposition.
An election to Cambridgeshire County Council took place on 4 June 2009 as part of the 2009 United Kingdom local elections. The election was delayed from 7 May to coincide with elections to the European Parliament. 69 councillors were elected from 60 electoral divisions, which returned either one or two county councillors each by first-past-the-post voting. The Conservative Party retained their majority on the council, while the Green Party and UKIP gained their first seats.
An election to Hampshire County Council took place on 4 June 2009 as part of the 2009 United Kingdom local elections, having been delayed from 7 May, to coincide with elections to the European Parliament. 78 councillors were elected from 75 electoral divisions, which returned either one or two county councillors each by first-past-the-post voting for a four-year term of office. The electoral divisions were the same as those used at the previous election in 2005. Elections in Portsmouth and Southampton do not coincide with this set, being unitary authorities outside the area covered by the County Council.
An election for the Borough Council in Slough, England, was held on 6 May 2010. This was the 124th Slough general local authority election since Slough became a local government unit in 1863.
The West Sussex County Council election, 2013 took place on 2 May 2013, as part of the 2013 United Kingdom local elections. All 71 electoral divisions were up for election, which returned one county councillor each by first-past-the-post voting for a four-year term of office. At this election, the Conservative Party was seeking to retain overall control of the council, and the Liberal Democrats to maintain their position as the main opposition party.
An election to Hampshire County Council took place on 2 May 2013 as part of the 2013 United Kingdom local elections. 78 councillors were elected from 75 electoral divisions, which returned either one or two county councillors each by first-past-the-post voting for a four-year term of office. The electoral divisions were the same as those of the previous election in 2009. No elections were held in Portsmouth and Southampton, which are unitary authorities outside the area covered by the County Council. The election saw the Conservative Party retain overall control of the council, with a reduced majority of five councillors.
An election to Cambridgeshire County Council took place on 2 May 2013 as part of the 2013 United Kingdom local elections. 69 councillors were elected from 60 electoral divisions, which returned either one or two county councillors each by first-past-the-post voting for a four-year term of office. The electoral divisions were the same as those used at the previous election in 2009. No elections were held in Peterborough, which is a unitary authority outside the area covered by the County Council. The election saw the Conservative Party lose overall control of the council.
The Surrey County Council election, 2013 took place on 2 May 2013 as part of the 2013 United Kingdom local elections. 81 electoral divisions returned one county councillor each by first-past-the-post voting for a four-year term of office. Following a review, new electoral division boundaries were introduced for this election, increasing the number of councillors from 80 to 81.
Elections to Suffolk County Council took place on 2 May 2013 as part of the 2013 United Kingdom local elections. 75 councillors were elected from 63 electoral divisions, which returned either one or two county councillors each by first-past-the-post voting for a four-year term of office. The electoral divisions were the same as those used at the previous election in 2009.
The 2016 Exeter City Council election took place on 5 May 2016, to elect members of Exeter City Council in England. Following boundary changes, the entire council was up for election, and all 13 wards were contested, each electing three councillors. The election was held concurrently with other local elections held in England on the 5 May.
The 2017 Hampshire County Council election took place on 4 May 2017 as part of the 2017 local elections in the United Kingdom. All councillors were elected from electoral divisions by first-past-the-post voting for a four-year term of office. The electoral divisions were somewhat changed from the previous election, with some being split, merged or with boundary changes. No elections were held in Portsmouth and Southampton, which are unitary authorities and hold their elections in other years. Similarly the districts within Hampshire did also not hold elections this year.
The 2017 Surrey County Council election took place as part of the 2017 local elections in the UK. All 81 councillors were elected for single-member electoral divisions for a four-year term. The electoral system used was first-past-the-post voting.
The 2017 Cornwall Council election was held on 4 May 2017 as part of the 2017 local elections in the United Kingdom. 122 councillors were elected from the 121 electoral divisions of Cornwall Council, which returned either one or two councillors each by first-past-the-post voting for a four-year term of office. Although originally scheduled to take place on the same day, the election in the Bodmin St Petroc ward was countermanded following the death of Liberal Democrat candidate Steve Rogerson and was held on 8 June.
The 2021 Cambridgeshire County Council election took place on 6 May 2021 as part of the 2021 local elections in the United Kingdom. All 61 councillors were elected from 59 electoral divisions, which returned either one or two county councillors each by first-past-the-post voting for a four-year term of office. The election was held alongside a full election for Cambridge City Council, the Cambridgeshire Police and Crime Commissioner, Mayor of Cambridgeshire and Peterborough and one-third of Peterborough City Council.
An election to Oxfordshire County Council took place on 5 May 2005 as part of the 2005 United Kingdom local elections, coinciding with the 2005 United Kingdom general election. 74 councillors were elected from various electoral divisions, which returned either one, two or three county councillors each by first-past-the-post voting for a four-year term of office. This was the first election using the new electoral divisions following proposals from the Electoral Commission in 2004, meaning the council would consist of three seats more than previously.