2011 New Forest District Council election

Last updated

2011 New Forest District Council election
Flag of England.svg
  2007 5 May 2011 2015  

All 60 seats to New Forest District Council
31 seats needed for a majority
 First partySecond party
 
Party Conservative Liberal Democrats
Seats before4614
Seats won546
Seat changeIncrease2.svg8Decrease2.svg8
Popular vote36,50216,757

New Forest UK local election 2011 map.svg
Results by Ward

Council control before election

Conservative

Council control after election

Conservative

The 2011 New Forest District Council election took place on 5 May 2011 to elect members to the New Forest District Council, on the same day as other local elections. The election saw the Conservatives gain eight seats from the Liberal Democrats, increasing their majority. [1] [2]

Contents

Election Summary

After the 2007 elections, the Conservatives held 45 seats, the Liberal Democrats held 14, and one seat was Independent; Prior to this election, Independent Councillor Danny Cracknell died, [3] with the Conservatives winning a subsequent by-election, meaning that the Conservatives held 46 seats and Liberal Democrats held 14.

The Conservatives again increased their control of the council, winning 54 seats out of 60, with the Liberal Democrats holding the remaining six.

Note that comparisons to the previous election do not include Bramshaw, Copythorne North and Minstead, as a by-election was held several months later instead.

The table below only tallies the votes of the highest polling candidate for each party within each ward. This is known as the top candidate method and is often used for multi-member plurality elections.

New Forest local election result 2011
PartySeatsGainsLossesNet gain/lossSeats %Votes %Votes+/−
  Conservative 5480Increase2.svg890.0056.0936,502Decrease2.svg0.39
  Liberal Democrats 608Decrease2.svg810.0025.7516,757Decrease2.svg9.05
  Labour 0Steady2.svgSteady2.svgSteady2.svg0.0010.997,156Increase2.svg8.70
  Green 0Steady2.svgSteady2.svgSteady2.svg0.003.872,520Increase2.svg1.39
  UKIP 0Steady2.svgSteady2.svgSteady2.svg0.003.272,133Increase2.svg3.27

Ward Results

Ashurst, Copythorne South and Netley Marsh

Ashurst, Copythorne South and Netley Marsh (2)
PartyCandidateVotes%±%
Conservative Leslie Puttock 1,431 63.51 Decrease2.svg6.09
Conservative Derek Tipp 1,422
Liberal Democrats Stuart Ardern46620.68Decrease2.svg0.86
Labour Peter Sopowski35615.80Increase2.svg6.95
Liberal Democrats Timothy Mawby301
Majority96542.83Decrease2.svg5.23
Turnout 2,253
Conservative hold Swing

Barton

Barton (2)
PartyCandidateVotes%±%
Conservative Godfrey Beck 1,715 64.01 Decrease2.svg12.80
Conservative Alan O'Sullivan 1,666
Liberal Democrats Lisa Chatfield56020.90Decrease2.svg2.28
Labour Peter Beck40415.08Increase2.svg15.08
Majority1,15543.11Decrease2.svg10.52
Turnout 2,679
Conservative hold Swing

Bashley

Bashley
PartyCandidateVotes%±%
Conservative Alan Rice 849 71.64 Decrease2.svg6.24
Liberal Democrats Roger Dagnall17014.34Decrease2.svg7.77
Labour Caroline Hexter16614.00Increase2.svg14.00
Majority67957.29Increase2.svg1.53
Turnout 1,185
Conservative hold Swing

Becton

Becton (2)
PartyCandidateVotes%±%
Conservative Christine Ward 1,140 55.12 Decrease2.svg20.11
Conservative Paul Woods 1,085
Liberal Democrats Judith Baker37017.89Decrease2.svg6.87
UKIP Ivan Ledger34216.53Increase2.svg16.53
Liberal Democrats Brenda Vincent220
Labour Joan Iles21610.44Increase2.svg10.44
Majority77037.23Decrease2.svg13.23
Turnout 2,068
Conservative hold Swing

Boldre and Sway

Boldre and Sway (2)
PartyCandidateVotes%±%
Conservative Barry Rickman 1,665 71.64 Decrease2.svg1.63
Conservative Colin Wise 1,336
Liberal Democrats Susan Lewis65928.35Increase2.svg1.63
Liberal Democrats Linda Hollins418
Majority1,00643.28Decrease2.svg3.26
Turnout 2,324
Conservative hold Swing

Bramshaw, Copythrone North and Minstead

Bramshaw, Copythorne North and Minstead
PartyCandidateVotes%±%
Conservative Diane Andrews80277.78Decrease2.svg0.22
Liberal Democrats Jane Woodnutt22922.21Increase2.svg0.22
Majority57355.57Decrease2.svg0.43
Turnout 55926.2
Conservative hold Swing

Bransgore and Burley

Bransgore and Burley (2)
PartyCandidateVotes%±%
Conservative Ann Hickman 1,789 65.99 Increase2.svg15.67
Conservative John Penwarden 1,539
Liberal Democrats Richard Grant53619.77Increase2.svg3.57
Labour Peter Kelleher38614.23Increase2.svg14.23
Majority1,25346.21Increase2.svg29.37
Turnout 2,653
Conservative hold Swing

Brockenhurst and Forest South East

Brockenhurst and Forest South East (2)
PartyCandidateVotes%±%
Conservative Maureen Holding 1,693 72.13 Increase2.svg3.47
Conservative Frank Vickers 1,471
Liberal Democrats Allan Hendry65427.86Decrease2.svg7.67
Liberal Democrats Rachel Smith638
Majority1,03944.26Decrease2.svg4.20
Turnout 2,347
Conservative hold Swing

Buckland

Buckland
PartyCandidateVotes%±%
Conservative Anthony Swain 624 60.28 Increase2.svg5.97
Liberal Democrats Edward Jearrad28327.34Decrease2.svg18.34
Labour Stephen Short12812.36Increase2.svg12.36
Majority67932.94Increase2.svg24.32
Turnout 1,035
Conservative hold Swing

Butts Ash and Dibden Purlieu

Butts Ash and Dibden Purlieu (2)
PartyCandidateVotes%±%
Liberal Democrats Malcolm Wade 1,055 43.88 Decrease2.svg8.75
Conservative James Binns 1,020 42.42 Decrease2.svg4.94
Liberal Democrats Rebecca Clark972
Conservative Brian Uglow963
Labour Iris Smith329Increase2.svg13.6813.68
Turnout 2,404
Liberal Democrats hold Swing
Conservative gain from Liberal Democrats Swing

Dibden and Hythe East

Dibden and Hythe East (2)
PartyCandidateVotes%±%
Liberal Democrats Christopher Harrison 1,001 55.54 Increase2.svg6.34
Liberal Democrats Stanley Wade 963
Conservative Beverley Thorne80144.45Increase2.svg0.85
Conservative Teresa Joof768
Majority20011.09Increase2.svg5.49
Turnout 1,802
Liberal Democrats hold Swing

Downlands and Forest

Downlands and Forest
PartyCandidateVotes%±%
Conservative Edward Heron 901 67.13 Increase2.svg9.51
Green Janet Richards27020.11Decrease2.svg0.95
Liberal Democrats Paul Toynton17112.74Decrease2.svg8.56
Majority63147.01Increase2.svg10.7
Turnout 1,342
Conservative hold Swing

Fawley, Blackfield and Langley

Fawley, Blackfield and Langley
PartyCandidateVotes%±%
Conservative Alexis McEvoy 1,418 67.87 Increase2.svg10.15
Conservative Robert Wappet 1,215
Liberal Democrats Brenda Smith67132.12Decrease2.svg10.15
Liberal Democrats Alexander Wade591
Majority2039.71Decrease2.svg5.74
Turnout 2,089
Conservative hold Swing

Fernhill

Fernhill (2)
PartyCandidateVotes%±%
Conservative Jill Cleary 1,321 59.211 Decrease2.svg4.06
Conservative John Ward 1,076
Liberal Democrats Beverley Scott-Johns50922.81Decrease2.svg5.31
Labour Amy Coakes40117.97Increase2.svg9.37
Majority81236.39Increase2.svg1.24
Turnout 2,231
Conservative hold Swing

Fordingbridge

Fordingbridge (2)
PartyCandidateVotes%±%
Conservative Roxanne Bellows 1,124 41.94 Increase2.svg5.54
Conservative Ann Sevier 1,105
Liberal Democrats Miranda Whitehead89633.43Decrease2.svg14.78
Liberal Democrats Timothy Denne688
Green Christopher Dennis36513.61Increase2.svg2.7
Labour Brian Shemmings34411.00Increase2.svg6.54
Majority2288.50
Turnout 2,680
Conservative gain from Liberal Democrats Swing

Forest North West

Forest North West
PartyCandidateVotes%±%
Conservative Bill DowUnopposed
Conservative hold Swing

Furzedown and Hardley

Furzedown and Hardley
PartyCandidateVotes%±%
Conservative Michael Ross 444 45.72 Increase2.svg5.87
Liberal Democrats Graham Parkes30931.82Decrease2.svg28.32
Green Elaine Fordham21822.45Increase2.svg22.45
Majority13513.90
Turnout 971
Conservative gain from Liberal Democrats Swing

Holbury and North Blackfield

Holbury and North Blackfield (2)
PartyCandidateVotes%±%
Conservative Allan Glass 830 51.29 Increase2.svg19.16
Conservative Alan Alvery 759
Labour Karlton Smith40725.15Increase2.svg15.74
Liberal Democrats David Lord38123.54Decrease2.svg34.91
Labour Michael Perkins365
Liberal Democrats David Townsley344
Majority714.38
Turnout 1,618
Conservative gain from Liberal Democrats Swing

Hordle

Hordle (2)
PartyCandidateVotes%±%
Conservative Andrew Tinsley 1,239 47.78 Decrease2.svg22.37
Conservative Penelope Lovelace 1,214
UKIP Ian Linney65225.14Increase2.svg25.14
Liberal Democrats Jacqueline Szwaczka40615.65Decrease2.svg14.19
Labour Peter Coakes29611.41Increase2.svg11.41
Majority58722.63Decrease2.svg17.67
Turnout 2,593
Conservative hold Swing

Hythe West and Langdown

Hythe West and Langdown (2)
PartyCandidateVotes%±%
Liberal Democrats Maureen McLean 1,609 56.47 Decrease2.svg8.04
Liberal Democrats Maureen Robinson 1,128
Conservative Joan Fowler89231.30Decrease2.svg4.18
Conservative Brenda Spearing876
Labour Emmanuel Boateng34812.21Increase2.svg12.21
Majority71725.16Decrease2.svg3.86
Turnout 2,849
Liberal Democrats hold Swing

Lymington Town

Lymington Town (2)
PartyCandidateVotes%±%
Conservative Anna Rostand 1,479 56.47 Decrease2.svg13.4
Conservative Miriam Lewis 1,473
Liberal Democrats Freda Angelou48118.36Decrease2.svg0.99
Liberal Democrats Stephen Moss419
UKIP Michael Beggs38314.62Increase2.svg14.62
Labour Robert Joy27610.53Increase2.svg10.53
Majority99838.10Decrease2.svg12.41
Turnout 2,619
Conservative hold Swing

Lyndhurst

Lyndhurst
PartyCandidateVotes%±%
Conservative Patricia Wyeth 858 75.39 Increase2.svg0.42
Liberal Democrats Michael Reid15313.44Decrease2.svg2.47
Labour Kenneth Kershaw12711.15Increase2.svg2.05
Majority70561.95Increase2.svg2.89
Turnout 1,138
Conservative hold Swing

Marchwood

Marchwood (2)
PartyCandidateVotes%±%
Conservative Alison Hoare 1,020 51.75 Decrease2.svg0.53
Conservative Susan Bennison 742
Liberal Democrats Keith Petty45523.08Decrease2.svg13.19
Liberal Democrats Geraint Rowlands338
Green Beverley Golden26813.59Increase2.svg2.15
Labour Sean Hill22811.56Increase2.svg11.56
Majority56528.66Increase2.svg
Turnout 1,971
Conservative hold Swing

Milford

Milford (2)
PartyCandidateVotes%±%
Conservative Melville Kendal 1,802 78.55 Decrease2.svg0.52
Conservative Michael Pemberton 1,678
Labour Tracey Carruthers49221.44Increase2.svg21.44
Majority1,31057.10Decrease2.svg1.05
Turnout 2,294
Conservative hold Swing

Milton

Milton (2)
PartyCandidateVotes%±%
Conservative Stephen Clarke 1,144 51.20 Decrease2.svg7.02
Conservative Stephen Davies 1,138
UKIP Nigel Cox43919.65Increase2.svg19.65
Liberal Democrats Wynford Davies34415.39Decrease2.svg20.07
Liberal Democrats Paul Chatfield341
Labour Peter Dance30713.74Increase2.svg7.09
Majority70531.55Increase2.svg9.14
Turnout 2,234
Conservative hold Swing

Pennington

Pennington (2)
PartyCandidateVotes%±%
Conservative Penelope Jackman 922 45.58 Decrease2.svg1.89
Conservative Alexander Kilgour 877
Liberal Democrats Paul Hickman65530.10Decrease2.svg16.41
Liberal Democrats Martina Humber569
Labour Lena Samuels26512.17Increase2.svg6.17
Green Sally May26412.13Increase2.svg12.13
Majority33715.48Decrease2.svg6.93
Turnout 2,176
Conservative gain from Liberal Democrats Swing
Conservative hold Swing

Ringwood East and Sopley

Ringwood East and Sopley
PartyCandidateVotes%±%
Conservative Barbara Woodifield 756 70.52 Decrease2.svg5.22
Liberal Democrats Cara Frost-Jones18016.79Decrease2.svg7.46
Labour Audrey Walker13612.68Increase2.svg12.68
Majority57653.73Increase2.svg2.25
Turnout 1,072
Conservative hold Swing

Ringwood North

Ringwood North (2)
PartyCandidateVotes%±%
Conservative Lorna Ford 1,329 55.14 Increase2.svg4.53
Conservative Michael Thierry 1,174
Labour Peter Harper45018.67Increase2.svg8.93
Green Timothy Rowe39216.26Increase2.svg6.74
Liberal Democrats Brian Dash2399.91Decrease2.svg20.21
Liberal Democrats William Catt190
Majority87936.47Increase2.svg15.99
Turnout 2,410
Conservative hold Swing

Ringwood South

Ringwood South (2)
PartyCandidateVotes%±%
Conservative William Rippon-Swaine 1,069 49.60 Increase2.svg18.03
Conservative Jeremy Heron 980
Green Sally Rose62729.09Increase2.svg29.09
Labour Desmond Williams45921.29Increase2.svg12.45
Majority44220.51
Turnout 2,155
Conservative hold Swing

Totton Central

Totton Central (2)
PartyCandidateVotes%±%
Conservative Brian Lucas 947 59.59 Increase2.svg7.54
Conservative Ronald Scrivens 915
Liberal Democrats Stephen Starr64240.40Decrease2.svg7.54
Liberal Democrats Lotte Bakoji-Hume583
Majority30519.19Increase2.svg15.08
Turnout 1,589
Conservative hold Swing

Totton East

Totton East (2)
PartyCandidateVotes%±%
Conservative Dean Britton 879 41.42 Decrease2.svg6.72
Conservative Christopher Lagdon 783
Liberal Democrats Nicholas Dawson63129.73Decrease2.svg12.98
Liberal Democrats Jonathan Sawyer574
UKIP David Robert Menhennet31714.93Increase2.svg14.93
Labour Jennifer Ovenden29513.90Increase2.svg13.90
Majority24811.68Increase2.svg6.28
Turnout 2,122
Conservative hold Swing

Totton North

Totton North
PartyCandidateVotes%±%
Conservative George Dart 903 54.99 Decrease2.svg0.17
Conservative Neville Penman 902
Liberal Democrats Jacqueline Shaw73945.00Increase2.svg0.17
Liberal Democrats Lorella Weeks668
Majority1649.98Decrease2.svg0.35
Turnout 1642
Conservative hold Swing

Totton South

Totton South (2)
PartyCandidateVotes%±%
Liberal Democrats David Harrison 917 45.19 Decrease2.svg14.83
Conservative Michael Southgate 778 38.34 Decrease2.svg1.63
Conservative Melvyn Molyneux734
Liberal Democrats Alan Weeks703
Green Helen Field33416.46Increase2.svg16.46
Turnout 2,029
Liberal Democrats hold Swing
Conservative gain from Liberal Democrats Swing

Totton West

Totton West (2)
PartyCandidateVotes%±%
Conservative Diana Brooks 848 60.35 Increase2.svg6.82
Conservative David Russell 773
Liberal Democrats Leonard Harris55739.64Decrease2.svg6.82
Liberal Democrats Kate Lord521
Majority29120.71Increase2.svg13.64
Turnout 1,405
Conservative hold Swing

Related Research Articles

The 1998 Wyre Forest District Council election took place on 7 May 1998 to elect members of Wyre Forest District Council in Worcestershire, England. One-third of the council was up for election and the Labour Party stayed in overall control of the council.

<span class="mw-page-title-main">2008 Wyre Forest District Council election</span>

The 2008 Wyre Forest District Council election took place on 1 May 2008 to elect members of Wyre Forest District Council in Worcestershire, England. One third of the council was up for election and the Conservative Party gained overall control of the council from no overall control.

<span class="mw-page-title-main">1992 Scottish local elections</span>

Local elections were held in Scotland on 7 May 1992, to elect members to all 53 district councils. It was the last local election held under the Local Government (Scotland) Act 1973, which had established the two-tier system of regions and districts. Regional and district councils were abolished in 1996, and replaced with 29 new mainland unitary authorities under the terms of the Local Government etc. (Scotland) Act 1994.

<span class="mw-page-title-main">2003 Wealden District Council election</span>

The 2003 Wealden District Council election took place on 1 May 2003 to elect members of Wealden District Council in East Sussex, England. The whole council was up for election with boundary changes since the last election in 1999 reducing the number of seats by 3. The Conservative Party stayed in overall control of the council.

<span class="mw-page-title-main">2007 Wealden District Council election</span>

The 2007 Wealden District Council election took place on 3 May 2007 to elect members of Wealden District Council in East Sussex, England. The whole council was up for election and the Conservative Party stayed in overall control of the council.

<span class="mw-page-title-main">2011 Wealden District Council election</span>

The 2011 Wealden District Council election took place on 5 May 2011 to elect members of Wealden District Council in East Sussex, England. The whole council was up for election and the Conservative Party stayed in overall control of the council.

<span class="mw-page-title-main">2013 Suffolk County Council election</span>

Elections to Suffolk County Council took place on 2 May 2013 as part of the 2013 United Kingdom local elections. 75 councillors were elected from 63 electoral divisions, which returned either one or two county councillors each by first-past-the-post voting for a four-year term of office. The electoral divisions were the same as those used at the previous election in 2009.

<span class="mw-page-title-main">2011 Torridge District Council election</span>

The 2011 Torridge District Council election took place on 5 May 2011 to elect members of Torridge District Council in Devon, England. The whole council was up for election and the council stayed under no overall control.

<span class="mw-page-title-main">2003 Rother District Council election</span>

The 2003 Rother District Council election took place on 1 May 2003 to elect members of Rother District Council in East Sussex, England. The whole council was up for election after boundary changes reduced the number of seats by 7. The Conservative Party stayed in overall control of the council.

<span class="mw-page-title-main">2015 Hart District Council election</span>

The 2015 Hart District Council election took place on 7 May 2015 to elect members of the Hart District Council in England. It was held on the same day as other local elections. Prior to this elections, the Conservatives held a plurality with 14 seats but did not hold a majority, whilst the Liberal Democrats and Community Campaign (Hart) both had 8 seats. The remaining seat was held by an independent.

<span class="mw-page-title-main">2015 South Oxfordshire District Council election</span>

The 2015 South Oxfordshire District Council election was held on 7 May 2015 to elect members of South Oxfordshire District Council in England. This was on the same day as other local elections.

<span class="mw-page-title-main">2015 Rother District Council election</span>

The 2015 Rother District Council election took place on 7 May 2015 to elect members of Rother District Council in East Sussex, England. The whole council was up for election and the Conservative Party stayed in overall control of the council.

<span class="mw-page-title-main">2015 West Oxfordshire District Council election</span>

The 2015 West Oxfordshire District Council election took place on 22 May 2015 to elect members of West Oxfordshire District Council in Oxfordshire, England. One third of the council was up for election and the Conservative Party stayed in overall control of the council.

<span class="mw-page-title-main">2011 South Oxfordshire District Council election</span>

The 2011 South Oxfordshire District Council election was held on 5 May 2011 to elect members of South Oxfordshire District Council in England. This was on the same day as other local elections.

<span class="mw-page-title-main">2019 Bassetlaw District Council election</span> Local election in England

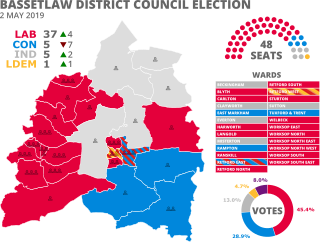
The 2019 Bassetlaw District Council election took place on 2 May 2019 to elect all 48 members of Bassetlaw District Council in England. This was on the same day as other local elections.

<span class="mw-page-title-main">2003 New Forest District Council election</span>

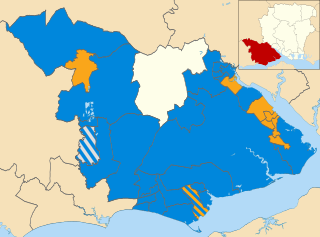
The 2003 New Forest District Council election took place on 1 May 2003 to elect members to the New Forest District Council, on the same day as other local elections. The 2003 election saw new ward boundaries used which increased the number of seats by 2 to 60. The election saw the Conservatives win 32 seats out of the 31 required for a majority, with the Liberal Democrats winning 27 seats and one independent win.

<span class="mw-page-title-main">2007 New Forest District Council election</span>

The 2007 New Forest District Council election took place on 3 May 2007 to elect members to the New Forest District Council, on the same day as other local elections. The election for Bramshaw, Copythorne North and Minstead was postponed due to the death of a candidate, and therefore a by-election was held on 14 June.

The 2022 Waltham Forest London Borough Council election was on 5 May 2022. All 60 members of Waltham Forest London Borough Council were elected. The elections took place alongside local elections in the other London boroughs and elections to local authorities across the United Kingdom. the Labour Party maintained its control of the council, winning 47 out of the 60 seats with the Conservative Party forming the council opposition with the remaining 13 seats.

<span class="mw-page-title-main">2022 Aberdeenshire Council election</span> Aberdeenshire Council election

Elections to Aberdeenshire Council took place on Thursday 5 May 2022 on the same day as the 31 other Scottish local government elections. As with other Scottish council elections, it was held using single transferable vote (STV) – a form of proportional representation – in which multiple candidates are elected in each ward and voters rank candidates in order of preference.

<span class="mw-page-title-main">2023 Bracknell Forest Borough Council election</span> 2023 election in England

The 2023 Bracknell Forest Borough Council election took place on 4 May 2023, to elect all 41 members in 15 wards for Bracknell Forest Borough Council in England. The election took place on the same day as other local elections in England as part of the 2023 United Kingdom local elections. Due to a boundary review there had been a change in ward boundaries, along with a reduction in size from 42 members elected in 2019. This is the first election since 1971 where a majority of seats are outside Bracknell. The election was held alongside concurrent town & parish council elections in Binfield, Bracknell, Crowthorne, Sandhurst, Warfield, and Winkfield.

References

  1. "Local Elections Archive Project - 2011 - New Forest". www.andrewteale.me.uk. Retrieved 1 October 2020.
  2. Rallings, Collin; Thrasher, Michael. "New Forest District Council Election Results 1973-2011" (PDF). Plymouth University.
  3. "Ringwood mourns death of community champion". Salisbury Journal. Retrieved 2 October 2020.