| |||||||||||||||||||
All 60 seats to New Forest District Council 31 seats needed for a majority | |||||||||||||||||||
---|---|---|---|---|---|---|---|---|---|---|---|---|---|---|---|---|---|---|---|
| |||||||||||||||||||
Results by Ward | |||||||||||||||||||
|
The 2015 New Forest District Council election took place on 7 May 2015 to elect members of New Forest District Council in England. [1] This was on the same day as other local elections.
The whole Council is re-elected every 4 years [2]
After the election, the composition of the council was: [3]
Party | Seats | Gains | Losses | Net gain/loss | Seats % | Votes % | Votes | +/− | |
---|---|---|---|---|---|---|---|---|---|
Conservative | 58 | 4 | 0 | 4 | 96.66 | 50.56 | 48,969 | 5.53 | |
UKIP | 0 | 0.00 | 15.42 | 14,941 | 12.15 | ||||
Labour | 0 | 0.00 | 14.24 | 13,797 | 5.54 | ||||
Liberal Democrats | 2 | 4 | 4 | 3.33 | 11.19 | 10,847 | 14.56 | ||
Green | 0 | 0.00 | 6.51 | 6,314 | 2.64 | ||||
Independent | 0 | 0.00 | 1.70 | 1,647 | 1.70 | ||||
TUSC | 0 | 0.00 | 0.3 | 334 | 0.3 | ||||
Party | Candidate | Votes | % | ±% | |
---|---|---|---|---|---|
Conservative | Leslie Puttock | 1,922 | 58.14 | 5.37 | |
Conservative | Derek Tipp | 1,689 | |||
UKIP | Peter Day | 840 | 24.51 | 24.51 | |
Labour | Kenneth Kershaw | 594 | 17.33 | 1.53 | |
Labour | Peter Sopowski | 506 | |||
Majority | 1,082 | 31.58 | 11.25 | ||
Turnout | 3,426 | 73.40 | |||
Conservative hold | Swing | ||||
Party | Candidate | Votes | % | ±% | |
---|---|---|---|---|---|
Conservative | Godfrey Beck | 1,959 | 55.92 | 8.09 | |
Conservative | Alan O'Sullivan | 1,946 | |||
UKIP | Ann Vasilesco | 986 | 28.14 | 28.14 | |
Labour | Peter Terry | 558 | 15.92 | 0.84 | |
Majority | 973 | 27.77 | 15.34 | ||
Turnout | 3,503 | 71.6 | |||
Conservative hold | Swing | ||||
Party | Candidate | Votes | % | ±% | |
---|---|---|---|---|---|
Conservative | Donald Tungate | 1,070 | 67.16 | 4.48 | |
UKIP | Gwen Bailey | 323 | 20.27 | 20.27 | |
Labour | Martin Phillips | 200 | 12.55 | 1.45 | |
Majority | 747 | 46.89 | 10.4 | ||
Turnout | 1,593 | 71.8 | |||
Conservative hold | Swing | ||||
Party | Candidate | Votes | % | ±% | |
---|---|---|---|---|---|
Conservative | Christine Ward | 1,350 | 50.52 | 4.6 | |
Conservative | Geoffrey Blunden | 1,290 | |||
UKIP | Paul Bailey | 761 | 28.48 | 11.95 | |
Liberal Democrats | Wynford Davies | 561 | 20.99 | 3.10 | |
Majority | 589 | 22.04 | 15.19 | ||
Turnout | 2,672 | 65.9 | |||
Conservative hold | Swing | ||||
Party | Candidate | Votes | % | ±% | |
---|---|---|---|---|---|
Conservative | Barry Rickman | 2,352 | 70.73 | 0.91 | |
Conservative | Colin Wise | 1,629 | |||
Green | Thomas Greenwood | 973 | 29.26 | 29.26 | |
Majority | 1,379 | 41.47 | 1.81 | ||
Turnout | 3,325 | 72.60 | |||
Conservative hold | Swing | ||||
Party | Candidate | Votes | % | ±% | |
---|---|---|---|---|---|
Conservative | Diane Andrews | 1,222 | 77.29 | 0.49 | |
Green | Anthony Gray | 359 | 22.70 | 22.70 | |
Majority | 863 | 54.58 | 0.99 | ||
Turnout | 1581 | ||||
Conservative hold | Swing | ||||
Party | Candidate | Votes | % | ±% | |
---|---|---|---|---|---|
Conservative | Richard Frampton | 2,386 | 66.46 | 0.47 | |
Conservative | Mark Steele | 1,805 | |||
Green | Colin Thurston | 740 | 20.61 | 20.61 | |
Labour | Brian Curwain | 464 | 12.92 | 1.31 | |
Majority | 1,646 | 45.84 | 0.37 | ||
Turnout | 3,590 | ||||
Conservative hold | Swing | ||||
Party | Candidate | Votes | % | ±% | |
---|---|---|---|---|---|
Conservative | Michael Harris | 1,964 | 49.78 | 22.35 | |
Conservative | Maureen Holding | 1,934 | |||
Green | Henry Mellor | 801 | 20.30 | 20.30 | |
UKIP | Rachel John Beaumont | 682 | 17.28 | 17.28 | |
Labour | Bramley Murton | 498 | 12.62 | 12.62 | |
Majority | 1,163 | 29.48 | 14.78 | ||
Turnout | 3,945 | ||||
Conservative hold | Swing | ||||
Party | Candidate | Votes | % | ±% | |
---|---|---|---|---|---|
Conservative | John Olliff-Cooper | 812 | 51.03 | 9.25 | |
Independent | Edward Jearrad | 304 | 19.10 | 19.10 | |
Labour | Bernard Tennant | 244 | 15.33 | 2.97 | |
Liberal Democrats | Brenda Vincent | 231 | 14.51 | 18.34 | |
Majority | 508 | 31.92 | 1.02 | ||
Turnout | 1,591 | ||||
Conservative hold | Swing | ||||
Party | Candidate | Votes | % | ±% | |
---|---|---|---|---|---|
Conservative | James Binns | 1,426 | 40.85 | 3.03 | |
Conservative | Peter Armstrong | 1,398 | |||
Liberal Democrats | Malcom Wade | 1,175 | 33.66 | 10.22 | |
Liberal Democrats | Lorraine Monaghan | 945 | |||
UKIP | Peter Rogers | 515 | 14.75 | 14.75 | |
UKIP | Christopher Tribe | 412 | |||
Labour | David Dale | 374 | 10.71 | 2.97 | |
Majority | 251 | 7.19 | |||
Turnout | 3,490 | ||||
Conservative hold | Swing | ||||
Conservative gain from Liberal Democrats | Swing | ||||
Party | Candidate | Votes | % | ±% | |
---|---|---|---|---|---|
Conservative | Daniel Poole | 1,274 | 38.01 | 6.44 | |
Conservative | William Andrews | 1,151 | |||
Liberal Democrats | Christopher Harrison | 1,058 | 31.57 | 23.97 | |
Liberal Democrats | Stanley Wade | 942 | |||
UKIP | Philip Wilson | 658 | 19.63 | 19.63 | |
Green | Edward Caplen | 361 | 10.77 | 10.77 | |
Majority | 216 | 6.44 | |||
Turnout | 3,351 | ||||
Conservative gain from Liberal Democrats | Swing | ||||
Party | Candidate | Votes | % | ±% | |
---|---|---|---|---|---|
Conservative | Edward Heron | 1,436 | 78.46 | 11.33 | |
Labour | Paul Toynton | 394 | 21.53 | 21.53 | |
Majority | 1,042 | 56.93 | 10.2 | ||
Turnout | 1,830 | ||||
Conservative hold | Swing | ||||
Party | Candidate | Votes | % | ±% | |
---|---|---|---|---|---|
Conservative | Alexis McEvoy | 1,551 | 42.60 | 25.27 | |
Conservative | Robert Wappet | 1,402 | |||
UKIP | Gillian Gulliver | 1,118 | 30.71 | 30.71 | |
Liberal Democrats | Ronan West | 519 | 14.25 | 17.87 | |
Labour | Paul Williams | 452 | 12.41 | 12.41 | |
Liberal Democrats | Linda McDermott | 334 | |||
Majority | 433 | 11.89 | 2.18 | ||
Turnout | 3,640 | ||||
Conservative hold | Swing | ||||
Party | Candidate | Votes | % | ±% | |
---|---|---|---|---|---|
Conservative | Jill Cleary | 1,533 | 49.45 | 9.76 | |
Conservative | John Ward | 1,384 | |||
UKIP | Marlene Wilkins | 933 | 30.09 | 30.09 | |
Labour | Stephen Short | 634 | 20.45 | 2.48 | |
Majority | 149 | 4.80 | 31.59 | ||
Turnout | 3,100 | ||||
Conservative hold | Swing | ||||
Party | Candidate | Votes | % | ±% | |
---|---|---|---|---|---|
Conservative | Roxanne Bellows | 1,997 | 53.21 | 11.27 | |
Conservative | Ann Sevier | 1,917 | |||
Labour | David Cakebread | 826 | 22.00 | 11.00 | |
Liberal Democrats | Sidney Rasey | 636 | 16.94 | 16.94 | |
UKIP | Wendy Rasey | 541 | |||
TUSC | Helen Ward | 294 | 7.83 | 7.83 | |
Majority | 1,171 | 31.20 | 22.7 | ||
Turnout | 3,753 | ||||
Conservative hold | Swing | ||||
Party | Candidate | Votes | % | ±% | |
---|---|---|---|---|---|
Conservative | Bill Dow | Unopposed | |||
Conservative hold | Swing | ||||
Party | Candidate | Votes | % | ±% | |
---|---|---|---|---|---|
Conservative | Kathleen Crisell | 617 | 37.05 | 8.67 | |
Liberal Democrats | Mark Clark | 569 | 34.17 | 2.35 | |
UKIP | Paul Thomas | 479 | 28.76 | 28.76 | |
Majority | 48 | 2.88 | 11.02 | ||
Turnout | 1,665 | ||||
Conservative hold | Swing | ||||
Party | Candidate | Votes | % | ±% | |
---|---|---|---|---|---|
Conservative | Allan Glass | 1,204 | 37.88 | 13.41 | |
Conservative | Alan Alvery | 1,152 | |||
UKIP | Philip Pearce-Smith | 856 | 26.93 | 26.93 | |
Labour | Tina Williams | 577 | 18.15 | 7.00 | |
Liberal Democrats | Sally-Jane Read | 541 | 17.02 | 6.52 | |
Liberal Democrats | Brenda Smith | 315 | |||
Majority | 348 | 10.95 | 6.57 | ||
Turnout | 3,178 | ||||
Conservative hold | Swing | ||||
Party | Candidate | Votes | % | ±% | |
---|---|---|---|---|---|
Conservative | Penelope Lovelace | 1,810 | 52.43 | 4.65 | |
Conservative | Frances Carpenter | 1,543 | |||
UKIP | Ian Linney | 1,080 | 31.28 | 6.14 | |
Liberal Democrats | Jacqueline Szwaczka | 562 | 16.28 | 0.63 | |
Majority | 587 | 21.14 | 1.49 | ||
Turnout | 3,452 | ||||
Conservative hold | Swing | ||||
Party | Candidate | Votes | % | ±% | |
---|---|---|---|---|---|
Conservative | Beverley Thorne | 1,459 | 44.07 | 12.77 | |
Liberal Democrats | Alexander Wade | 1,348 | 40.72 | 15.75 | |
Liberal Democrats | Rebecca Clark | 1,225 | |||
Conservative | Thomas Webb | 1,184 | |||
Labour | Patricia Gillam | 503 | 15.19 | 12.21 | |
Turnout | 3,310 | ||||
Conservative gain from Liberal Democrats | Swing | ||||
Liberal Democrats hold | Swing | ||||
Party | Candidate | Votes | % | ±% | |
---|---|---|---|---|---|
Conservative | Anna Rostand | 1,785 | 49.58 | 6.89 | |
Conservative | Alan Penson | 1,439 | |||
Independent | Jacqueline England | 1,343 | 37.30 | 37.30 | |
Independent | Michael Woodford | 934 | |||
Labour | Gary le Port | 472 | 13.11 | 2.58 | |
Majority | 442 | 12.27 | 25.83 | ||
Turnout | 3,600 | ||||
Conservative hold | Swing | ||||
Party | Candidate | Votes | % | ±% | |
---|---|---|---|---|---|
Conservative | Patricia Wyeth | 1,079 | 60.68 | 14.71 | |
Green | Gerard Burden | 373 | 20.97 | 20.97 | |
UKIP | Philip Fawkes | 326 | 18.33 | 18.33 | |
Majority | 706 | 39.70 | 22.25 | ||
Turnout | 1,778 | ||||
Conservative hold | Swing | ||||
Party | Candidate | Votes | % | ±% | |
---|---|---|---|---|---|
Conservative | Alison Hoare | 1,488 | 50.78 | 0.97 | |
Conservative | Susan Bennison | 1,232 | |||
Liberal Democrats | Linda Bovey | 771 | 26.31 | 3.23 | |
UKIP | William Evans | 673 | 22.96 | 22.96 | |
Liberal Democrats | Martin Bovey | 628 | |||
UKIP | John Swales | 491 | |||
Majority | 717 | 24.47 | 4.19 | ||
Turnout | 2,930 | ||||
Conservative hold | Swing | ||||
Party | Candidate | Votes | % | ±% | |
---|---|---|---|---|---|
Conservative | Sophie Beton | 2,282 | 79.67 | 1.12 | |
Conservative | Melville Kendal | 2,232 | |||
Labour | Amy Coakes | 582 | 20.32 | 1.12 | |
Majority | 1,700 | 59.35 | 2.25 | ||
Turnout | 2,864 | ||||
Conservative hold | Swing | ||||
Party | Candidate | Votes | % | ±% | |
---|---|---|---|---|---|
Conservative | Stephen Clarke | 1,727 | 53.76 | 2.56 | |
Conservative | Stephen Clarke | 1,635 | |||
Liberal Democrats | Judith Baker | 770 | 23.97 | 8.58 | |
Labour | Caroline Hexter | 715 | 22.26 | 8.52 | |
Majority | 957 | 29.79 | 1.76 | ||
Turnout | 3,102 | ||||
Conservative hold | Swing | ||||
Party | Candidate | Votes | % | ±% | |
---|---|---|---|---|---|
Conservative | Michael White | 1,505 | 52.09 | 6.51 | |
Conservative | Penelope Jackman | 1,413 | |||
Liberal Democrats | Jack Davies | 832 | 28.79 | 1.31 | |
Liberal Democrats | Nicholas McGeorge | 586 | |||
Labour | Margaret Humphreys | 552 | 19.10 | 6.93 | |
Majority | 673 | 23.29 | 7.81 | ||
Turnout | 2,889 | ||||
Conservative hold | Swing | ||||
Party | Candidate | Votes | % | ±% | |
---|---|---|---|---|---|
Conservative | Emma Lane | Unopposed | |||
Conservative hold | Swing | ||||
Party | Candidate | Votes | % | ±% | |
---|---|---|---|---|---|
Conservative | Lorna Ford | 1,801 | 37.25 | 17.89 | |
Conservative | Michael Thierry | 1,706 | |||
Labour | Peter Kelleher | 1,445 | 29.89 | 11.22 | |
UKIP | Rosalind Mills | 868 | 17.95 | 17.95 | |
Green | Timothy Rowe | 720 | 14.89 | 1.37 | |
Majority | 356 | 7.36 | 29.11 | ||
Turnout | 4,834 | ||||
Conservative hold | Swing | ||||
Party | Candidate | Votes | % | ±% | |
---|---|---|---|---|---|
Conservative | William Rippon-Swaine | 1,680 | 48.56 | 1.04 | |
Conservative | Jeremy Heron | 1,639 | |||
Green | Julian Konczak | 988 | 28.56 | 0.53 | |
Labour | Desmond Williams | 791 | 22.86 | 1.57 | |
Majority | 692 | 20.00 | 0.51 | ||
Turnout | 3,459 | ||||
Conservative hold | Swing | ||||
Party | Candidate | Votes | % | ±% | |
---|---|---|---|---|---|
Conservative | Louise Cerasoli | 1,461 | 46.46 | 13.13 | |
Conservative | Brian Lucas | 1,126 | |||
Labour | Alan Goodfellow | 621 | 19.75 | 19.75 | |
UKIP | Frances Orchard | 598 | 19.02 | 19.02 | |
UKIP | Ronald Scrivens | 581 | |||
Green | Callum O'Driscoll | 464 | 14.75 | 14.75 | |
Majority | 840 | 26.71 | 7.52 | ||
Turnout | 3,144 | ||||
Conservative hold | Swing | ||||
Party | Candidate | Votes | % | ±% | |
---|---|---|---|---|---|
Conservative | Ian Coombes | 1,155 | 35.88 | 5.54 | |
Conservative | Arthur Davis | 1,018 | |||
UKIP | William Rogers | 720 | 22.36 | 7.43 | |
UKIP | Robert Menhennet | 691 | |||
Liberal Democrats | Alexander Brunsdon | 632 | 19.63 | 10.10 | |
Liberal Democrats | Jacqueline Shaw | 533 | |||
Labour | David Moran | 399 | 12.39 | 1.51 | |
Green | Helen Field | 273 | 8.48 | 8.48 | |
Green | Joanna Tidbury | 229 | |||
TUSC | Jean Walker | 40 | 1.24 | 1.24 | |
Majority | 435 | 13.51 | 1.83 | ||
Turnout | 3,219 | ||||
Conservative hold | Swing | ||||
Party | Candidate | Votes | % | ±% | |
---|---|---|---|---|---|
Conservative | Dean Britton | 1,291 | 44.65 | 10.34 | |
Conservative | Neville Penman | 1,099 | |||
UKIP | Ian Molyneux | 638 | 22.06 | 22.06 | |
UKIP | Melvyn Molyneux | 590 | |||
Liberal Democrats | Julie Martin | 492 | 17.01 | 27.99 | |
Labour | Martin Grist | 470 | 16.25 | 16.25 | |
Liberal Democrats | Diane Pratt | 440 | |||
Majority | 653 | 22.58 | 12.60 | ||
Turnout | 2,891 | ||||
Conservative hold | Swing | ||||
Party | Candidate | Votes | % | ±% | |
---|---|---|---|---|---|
Liberal Democrats | David Harrison | 1,348 | 39.31 | 5.88 | |
Conservative | Leonard Harris | 979 | 28.55 | 9.79 | |
Conservative | Michael Southgate | 829 | |||
Liberal Democrats | Caroline Rackham | 603 | |||
UKIP | Graham Barrett | 536 | 15.63 | 15.63 | |
UKIP | Donna-Marie Legg | 485 | |||
Labour | Elizabeth Chell | 304 | 8.86 | 8.86 | |
Green | Alan Weeks | 262 | 7.64 | 8.82 | |
Green | Lorella Weeks | 178 | |||
Turnout | 3,429 | ||||
Liberal Democrats hold | Swing | ||||
Conservative hold | Swing | ||||
Party | Candidate | Votes | % | ±% | |
---|---|---|---|---|---|
Conservative | Diana Brooks | 1,322 | 50.78 | 9.57 | |
Conservative | David Russell | 1,031 | |||
UKIP | Christopher Lagdon | 715 | 27.46 | 27.46 | |
Labour | Peter Dance | 566 | 21.74 | 21.74 | |
Majority | 607 | 23.31 | 2.60 | ||
Turnout | 2,603 | ||||
Conservative hold | Swing | ||||
Independent Community & Health Concern, abbr.ICHC, is a political party based in Kidderminster, United Kingdom. The party was founded in 2000, having grown out of the campaign to restore the casualty unit at Kidderminster Hospital. Since 2015 it has successfully contested local elections within the Wyre Forest local government area, which includes Kidderminster.
The district of Epping Forest is in the county of Essex in England. It was created on 1 April 1974, following the merger of Epping Urban District, Chigwell Urban District, Waltham Holy Cross Urban District, and part of Epping and Ongar Rural District.
Forest Heath District Council in Suffolk, England was elected every four years. between the last boundary changes in 2003 and the final elections in 2015, 27 councillors were elected from 14 wards. The council was abolished in 2019, with the area becoming part of West Suffolk.
Pendle Borough Council elections are generally held three years out of every four, with a third of the council elected each time. Pendle Borough Council is the local authority for the non-metropolitan district of Pendle in Lancashire, England. Since the last boundary changes in 2020, 33 councillors have been elected from 12 wards.
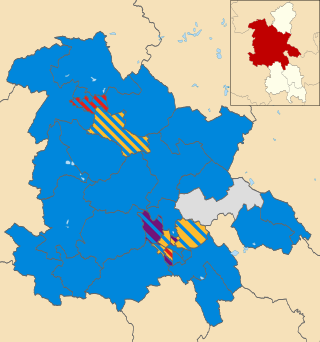
Aylesbury Vale District Council was the council for the non-metropolitan district of Aylesbury Vale in Buckinghamshire, England, which existed as a local government area from 1974 to 2020. The council was elected every four years from 1973 until 2020. At the time of its abolition, the council had 59 councillors, elected from 33 wards.
Bracknell Forest Borough Council is the local authority for Bracknell Forest, a unitary authority in Berkshire, England. Until 1 April 1998 it was a non-metropolitan district.
South Oxfordshire District Council, a non-metropolitan district council in Oxfordshire, England is elected every four years.
East Hampshire District Council elections are held every four years to elect councillors to East Hampshire District Council in Hampshire, England. Since the last boundary changes in 2019 the council has comprised 43 councillors representing 31 wards, with each ward electing one, two or three councillors.
Forest of Dean District Council is the local authority for the Forest of Dean in Gloucestershire, England. The council is elected every four years. Since the last boundary changes in 2019, 38 councillors are elected from 21 wards.
New Forest District Council elections are held every four years to elect members of New Forest District Council in Hampshire, England. Since the last boundary changes in 2023 the council has comprised 48 councillors representing 26 wards, with each ward electing one, two or three councillors.
Huntingdonshire District Council in Cambridgeshire, England holds elections for all its councillors together every fourth year. Prior to changing to all-out elections in 2018, one third of the council was elected each year, followed by one year without an election. Since the last boundary changes in 2018, 52 councillors have been elected from 26 wards.
South Cambridgeshire District Council was created as part of the 1972 local government reforms. The first elections to the new authority were held in the year 1973. From 1978 until 2016, one third of the council were elected each year, followed by one year without a poll. Since 2018, all members of the council are elected at once in a so-called 'all-out' election, after a decision made in 2015.
Waltham Forest London Borough Council in London is elected every four years. Since the last boundary changes in 2022, 60 councillors have been elected from 22 wards, with 2 or 3 councillors per ward.
One third of West Oxfordshire District Council in Oxfordshire, England is elected each year, followed by one year without election. Since the last boundary changes in 2002, there are a total 49 councillors elected from 27 wards, each councillor serving a four-year term.
Wyre Forest District Council elections are held every four years. Wyre Forest District Council is the local authority for the non-metropolitan district of Wyre Forest in Worcestershire, England. Prior to 2019 elections were held three years out of every four, with a third of the council elected each time. Since the last boundary changes in 2015, 33 councillors have been elected from 12 wards.
The 2015 Forest Heath District Council election took place on 7 May 2015 to elect members of the Forest Heath District Council in England. It was held on the same day as other local elections.
The electoral system of Turkey varies for general, presidential and local elections that take place in Turkey every five years. Turkey has been a multi-party democracy since 1950, with the first democratic election held on 14 May 1950 leading to the end of the single-party rule established in 1923. The current electoral system for electing Members of Parliament to the Grand National Assembly has a 7% election threshold.
Nottingham City Council elections are held every four years. Nottingham City Council is the local authority for the unitary authority of Nottingham in Nottinghamshire, England. Until 1 April 1998 it was a non-metropolitan district. Since the last boundary changes in 2019, 55 councillors are elected from 20 wards.
The For Britain Movement was a minor far-right political party in the United Kingdom, founded by the anti-Islam and "counter-jihad" activist Anne Marie Waters after she was defeated in the 2017 UK Independence Party leadership election.
The 2019 United Kingdom local elections took place on Thursday 2 May 2019, with 248 English local councils, six directly elected mayors in England, and all 11 local councils in Northern Ireland being contested.