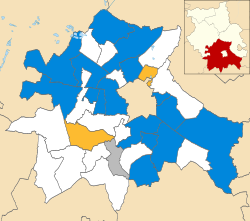
North West Cambridgeshire is a county constituency represented in the House of Commons of the Parliament of the United Kingdom since 2024 by Sam Carling of the Labour Party. It elects one Member of Parliament (MP) by the first past the post system of election.
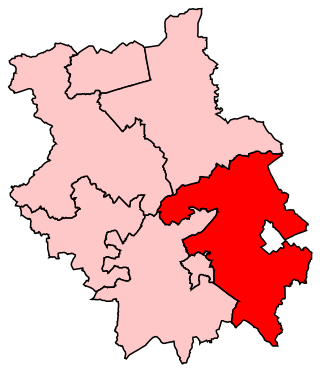
South East Cambridgeshire was a constituency represented in the House of Commons of the UK Parliament from 2015 to 2024 by Lucy Frazer, a member of the Conservative Party who has served as Secretary of State for Culture, Media and Sport from 2023 to 2024. The constituency was established for the 1983 general election and was based on the cathedral city of Ely.

An election to Cambridgeshire County Council took place on 4 June 2009 as part of the 2009 United Kingdom local elections. The election was delayed from 7 May to coincide with elections to the European Parliament. 69 councillors were elected from 60 electoral divisions, which returned either one or two county councillors each by first-past-the-post voting. The Conservative Party retained their majority on the council, while the Green Party and UKIP gained their first seats.

Elections to South Cambridgeshire District Council took place on Thursday 5 May 2011, as part of the 2011 United Kingdom local elections. Nineteen seats, making up one third of South Cambridgeshire District Council, were up for election. Seats up for election in 2011 were last contested at the 2007 election. The Conservative Party retained their majority on the council.

The 2011 Fenland District Council election took place on 5 May 2011 to elect members of Fenland District Council in Cambridgeshire, England. The whole council was up for election and the Conservative Party stayed in overall control of the council.

Elections to South Cambridgeshire District Council took place on Thursday 3 May 2012, as part of the 2012 United Kingdom local elections. Nineteen seats, making up one third of South Cambridgeshire District Council, were up for election. Seats up for election in 2012 were last contested at the 2008 election. The Conservative Party retained their majority on the council.
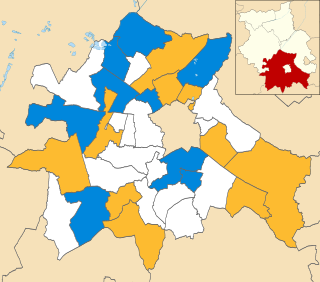
Elections to South Cambridgeshire District Council took place on Thursday 6 May 2010, as part of the 2010 United Kingdom local elections. The elections also took place at the same time as the 2010 United Kingdom general election. Nineteen seats, constituting one third of the South Cambridgeshire District Council, were up for election. Seats up for election in 2010 were last contested at the 2006 election. The Conservative Party retained their majority on the council, despite losing seats.

Elections to South Cambridgeshire District Council took place on Thursday 1 May 2008, as part of the 2008 United Kingdom local elections. Twenty seats, making up just over one third of South Cambridgeshire District Council, were up for election. Both seats in Gamlingay were contested at this election after one of the councillors retired earlier in the year. Seats up for election in 2008 were last contested at the 2004 election, and were next contested at the 2012 election. The Conservative Party retained their majority on the council.

Elections to South Cambridgeshire District Council took place on Thursday 3 May 2007, as part of the 2007 United Kingdom local elections. Nineteen seats, making up one third of South Cambridgeshire District Council, were up for election. Seats up for election in 2007 were last contested at the 2004 election, when all seats were up for election due to new ward boundaries, and were next contested at the 2011 election. The Conservative Party gained an overall majority on the council for the first time.

Elections to South Cambridgeshire District Council took place on Thursday 4 May 2006, as part of the 2006 United Kingdom local elections. Twenty seats, making up just over one third of South Cambridgeshire District Council, were up for election, with a by-election being held in one ward. Seats up for election in 2006 were last contested at the 2004 election, when all seats were up for election due to new ward boundaries, and were next contested at the 2010 election. The Conservative Party remained the largest party with an increased number of seats, but the council remained under no overall control.

Elections to South Cambridgeshire District Council took place on Thursday 10 June 2004, as part of the 2004 United Kingdom local elections and at the same time as the European Parliament election, 2004. Due to new ward boundaries, all 57 seats on the council were up for election, increasing the number of councillors by two. Seats up for election in 2004 were subsequently contested by thirds at the 2006, 2007 and 2008 elections.
East Cambridgeshire District Council is a non-metropolitan district council in the county of Cambridgeshire in the United Kingdom. Elections are held every four years.

An election to Cambridgeshire County Council took place on 2 May 2013 as part of the 2013 United Kingdom local elections. 69 councillors were elected from 60 electoral divisions, which returned either one or two county councillors each by first-past-the-post voting for a four-year term of office. The electoral divisions were the same as those used at the previous election in 2009. No elections were held in Peterborough, which is a unitary authority outside the area covered by the County Council. The election saw the Conservative Party lose overall control of the council.

Elections to South Cambridgeshire District Council took place on Thursday 22 May 2014, as part of the 2014 United Kingdom local elections. The election was held at the same time as elections to the European Parliament. Nineteen seats, making up one third of South Cambridgeshire District Council, were up for election. Seats up for election in 2014 were last contested at the 2010 election.
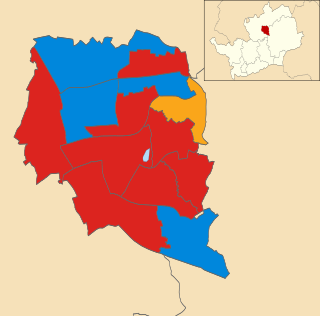
The by-thirds 2015 Stevenage Borough Council election was held on 7 May 2015 to elect one third (thirteen) of the members (councillors) of the council, one for each ward, as part of the 2015 United Kingdom local elections held simultaneously with the 2015 General Election. The up for election were last contested in 2011. The Labour Party retained control of the council, which it had held continuously since 1973.
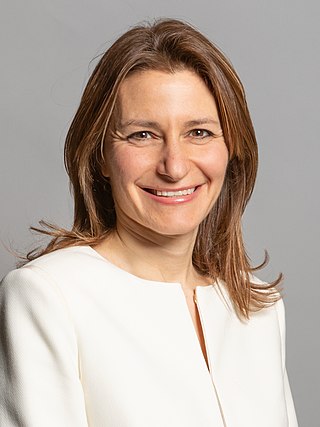
Lucy Claire Frazer is a British politician and barrister who served as Secretary of State for Culture, Media and Sport from February 2023 to July 2024. A member of the Conservative Party, she served as the Member of Parliament (MP) for South East Cambridgeshire from 2015 to 2024.

Elections to South Cambridgeshire District Council took place on Thursday 5 May 2016 as part of the 2016 United Kingdom local elections. Nineteen seats, making up one third of South Cambridgeshire District Council, were up for election. Seats up for election in 2016 were last contested at the 2012 election.

Elections to South Cambridgeshire District Council were held on Thursday 3 May 2018 as part of the 2018 United Kingdom local elections. Forty five seats, making up the whole of South Cambridgeshire District Council, were up for election in twenty six wards. The council previously had 57 members, last elected by thirds in 2016, 2015 and 2014. Following a boundary review, there has been a reduction of twelve seats to 45 and the electoral pattern has changed from election by thirds to all out elections, meaning that all seats were up for election on this occasion.

The 2021 Cambridgeshire County Council election took place on 6 May 2021 as part of the 2021 local elections in the United Kingdom. All 61 councillors were elected from 59 electoral divisions, which returned either one or two county councillors each by first-past-the-post voting for a four-year term of office. The election was held alongside a full election for Cambridge City Council, the Cambridgeshire Police and Crime Commissioner, Mayor of Cambridgeshire and Peterborough and one-third of Peterborough City Council.

Elections to South Cambridgeshire District Council were held on Thursday 5 May 2022 as part of the 2022 United Kingdom local elections. All forty five seats were up for election in twenty six wards. The Liberal Democrats were defending the council, having won control in 2018.
