| |||||||||||||||||||||||||||||||||||||
15 out of 42 seats to Cambridge City Council 22 seats needed for a majority | |||||||||||||||||||||||||||||||||||||
---|---|---|---|---|---|---|---|---|---|---|---|---|---|---|---|---|---|---|---|---|---|---|---|---|---|---|---|---|---|---|---|---|---|---|---|---|---|
Turnout | 41.2% (3.3%) | ||||||||||||||||||||||||||||||||||||
| |||||||||||||||||||||||||||||||||||||
Winner of each seat at the 1992 Cambridge City Council election | |||||||||||||||||||||||||||||||||||||
|
The 1992 Cambridge City Council election took place on 7 May 1992 to elect members of Cambridge City Council in Cambridge, Cambridgeshire, England. [1] This was on the same day as other local elections across England.
1992 Cambridge City Council election | ||||||||||
---|---|---|---|---|---|---|---|---|---|---|
Party | This election | Full council | This election | |||||||
Seats | Net | Seats % | Other | Total | Total % | Votes | Votes % | +/− | ||
Labour | 6 | 4 | 40.0 | 13 | 19 | 45.2 | 12,530 | 36.3 | –1.2 | |
Conservative | 4 | 1 | 26.7 | 8 | 12 | 28.6 | 11,915 | 34.5 | +3.4 | |
Liberal Democrats | 5 | 5 | 33.3 | 6 | 11 | 26.2 | 9,326 | 27.0 | –0.6 | |
Green | 0 | 0.0 | 0 | 0 | 0.0 | 670 | 1.9 | –1.9 | ||
Independent | 0 | 0.0 | 0 | 0 | 0.0 | 123 | 0.4 | N/A | ||
Party | Candidate | Votes | % | ±% | |
---|---|---|---|---|---|
Labour | Richard Smith* | 801 | 57.6 | –3.8 | |
Conservative | Joan Hill-Molyneux | 482 | 34.7 | +10.3 | |
Liberal Democrats | Paul Harden | 108 | 7.8 | –2.1 | |
Majority | 319 | 22.9 | –14.0 | ||
Turnout | 1,391 | 29.3 | –7.1 | ||
Registered electors | 4,747 | ||||
Labour hold | Swing | 7.1 | |||
Party | Candidate | Votes | % | ±% | |
---|---|---|---|---|---|
Conservative | Vivian Ellis | 931 | 45.4 | +15.0 | |
Labour | Elizabeth Gard* | 855 | 41.7 | –6.3 | |
Liberal Democrats | Alison Pegrum | 265 | 12.9 | –8.7 | |
Majority | 76 | 3.7 | N/A | ||
Turnout | 2,051 | 39.7 | –1.5 | ||
Registered electors | 5,169 | ||||
Conservative gain from Labour | Swing | 10.7 | |||
Party | Candidate | Votes | % | ±% | |
---|---|---|---|---|---|
Liberal Democrats | John Hipkin | 1,333 | 47.0 | –3.3 | |
Conservative | Simon Mitton | 1,021 | 36.0 | +6.1 | |
Labour | Simon Gosnell | 485 | 17.1 | –2.7 | |
Majority | 312 | 11.0 | –9.4 | ||
Turnout | 2,839 | 45.9 | –5.0 | ||
Registered electors | 6,190 | ||||
Liberal Democrats gain from Conservative | Swing | 4.7 | |||
Party | Candidate | Votes | % | ±% | |
---|---|---|---|---|---|
Conservative | Tim Seaton | 1,193 | 47.4 | +6.8 | |
Labour | Anthony Schofield | 973 | 38.7 | –1.3 | |
Liberal Democrats | Suzanne Henney | 220 | 8.7 | –3.1 | |
Green | Elizabeth Cooper | 66 | 2.6 | N/A | |
Independent | Peter Chaplin | 65 | 2.6 | N/A | |
Majority | 220 | 8.7 | N/A | ||
Turnout | 2,517 | 47.3 | –1.7 | ||
Registered electors | 5,326 | ||||
Conservative gain from Labour | Swing | 4.1 | |||
Party | Candidate | Votes | % | ±% | |
---|---|---|---|---|---|
Labour | Jeremy Benstead | 1,153 | 46.1 | –2.1 | |
Conservative | Richard Jones | 1,109 | 44.3 | +7.3 | |
Liberal Democrats | Andrew Paton | 241 | 9.6 | –1.0 | |
Majority | 44 | 1.8 | –9.5 | ||
Turnout | 2,503 | 44.3 | –3.5 | ||
Registered electors | 5,646 | ||||
Labour hold | Swing | 4.7 | |||
Party | Candidate | Votes | % | ±% | |
---|---|---|---|---|---|
Liberal Democrats | Joseph Nunes | 987 | 35.5 | +1.8 | |
Conservative | Alan Carter | 945 | 34.0 | +1.9 | |
Labour | Michael Rooney | 848 | 30.5 | –0.8 | |
Majority | 42 | 1.5 | –0.1 | ||
Turnout | 2,780 | 43.1 | –8.0 | ||
Registered electors | 6,443 | ||||
Liberal Democrats gain from Conservative | Swing | 0.1 | |||
Party | Candidate | Votes | % | ||
---|---|---|---|---|---|
Labour | Peter Cowell* | 871 | 58.4 | ||
Labour | Kevin Price | 657 | 44.0 | ||
Conservative | Geoffrey Howe | 426 | 28.6 | ||
Conservative | Richard Baty | 390 | 26.1 | ||
Liberal Democrats | Stephen Howarth | 199 | 13.3 | ||
Liberal Democrats | Stephen Warde | 144 | 9.7 | ||
Turnout | 1,345 | 26.8 | |||
Registered electors | 5,017 | ||||
Labour hold | |||||
Labour hold | |||||
Party | Candidate | Votes | % | ±% | |
---|---|---|---|---|---|
Liberal Democrats | Colin Rosenstiel | 1,313 | 49.2 | –0.3 | |
Labour | Richard Leggatt* | 850 | 31.8 | +1.5 | |
Conservative | Richard Harwood | 398 | 14.9 | +1.9 | |
Green | Timothy Cooper | 109 | 4.1 | –3.1 | |
Majority | 463 | 17.3 | –1.8 | ||
Turnout | 2,670 | 44.0 | –1.2 | ||
Registered electors | 6,073 | ||||
Liberal Democrats gain from Labour | Swing | 0.9 | |||
Party | Candidate | Votes | % | ±% | |
---|---|---|---|---|---|
Liberal Democrats | Joyce Baird | 1,075 | 35.3 | +7.1 | |
Labour | Eleanor Fairclough* | 977 | 32.1 | –1.1 | |
Conservative | Kenneth Wheatcroft | 760 | 24.9 | –4.6 | |
Green | Margaret Wright | 178 | 5.8 | –3.3 | |
Independent | Neil Costello | 58 | 1.9 | N/A | |
Majority | 98 | 3.2 | N/A | ||
Turnout | 3,048 | 41.6 | ±0.0 | ||
Registered electors | 7,326 | ||||
Liberal Democrats gain from Labour | Swing | 4.1 | |||
Party | Candidate | Votes | % | ±% | |
---|---|---|---|---|---|
Labour | Benjamin Bradnack | 1,220 | 52.5 | –4.0 | |
Conservative | Dianne Walton | 484 | 20.8 | +1.5 | |
Liberal Democrats | Britt Meyland-Smith | 456 | 19.6 | +5.3 | |
Green | Daryl Tayar | 166 | 7.1 | –2.7 | |
Majority | 736 | 31.6 | –5.6 | ||
Turnout | 2,326 | 38.1 | –0.7 | ||
Registered electors | 6,112 | ||||
Labour hold | Swing | 2.8 | |||
Party | Candidate | Votes | % | ±% | |
---|---|---|---|---|---|
Conservative | Graham Edwards* | 1,326 | 44.2 | –2.5 | |
Liberal Democrats | Richard Darlington | 1,082 | 36.0 | +6.7 | |
Labour | Pamela Henderson | 595 | 19.8 | –4.2 | |
Majority | 244 | 8.1 | –9.3 | ||
Turnout | 3,003 | 52.6 | +0.5 | ||
Registered electors | 5,704 | ||||
Conservative hold | Swing | 4.6 | |||
Party | Candidate | Votes | % | ±% | |
---|---|---|---|---|---|
Labour | Peter Wright* | 1,002 | 55.8 | +3.5 | |
Conservative | Rachel Atherton | 380 | 21.2 | +3.4 | |
Liberal Democrats | Rupert Ford | 262 | 14.6 | –4.9 | |
Green | Ian Miller | 151 | 8.4 | –1.9 | |
Majority | 622 | 34.7 | +1.7 | ||
Turnout | 1,795 | 33.4 | –5.8 | ||
Registered electors | 5,381 | ||||
Labour hold | Swing | 0.1 | |||
Party | Candidate | Votes | % | ±% | |
---|---|---|---|---|---|
Conservative | Sonja Froggett* | 1,283 | 56.2 | +7.3 | |
Liberal Democrats | Phillipa Slatter | 633 | 27.8 | +0.8 | |
Labour | Christopher Wilson | 365 | 16.0 | –2.6 | |
Majority | 650 | 28.5 | +6.6 | ||
Turnout | 2,281 | 37.7 | –3.3 | ||
Registered electors | 6,058 | ||||
Conservative hold | Swing | 3.3 | |||
Party | Candidate | Votes | % | ±% | |
---|---|---|---|---|---|
Liberal Democrats | Gaynor Griffiths | 1,008 | 37.7 | –5.6 | |
Labour | Christine Mann | 878 | 32.8 | +4.1 | |
Conservative | Sandra Manley | 787 | 29.4 | +1.4 | |
Majority | 130 | 4.9 | –8.4 | ||
Turnout | 2,673 | 49.5 | –2.7 | ||
Registered electors | 5,405 | ||||
Liberal Democrats gain from Conservative | Swing | 4.9 | |||
South Cambridgeshire was a constituency represented in the House of Commons of the UK Parliament since 2019 by Anthony Browne, a Conservative.
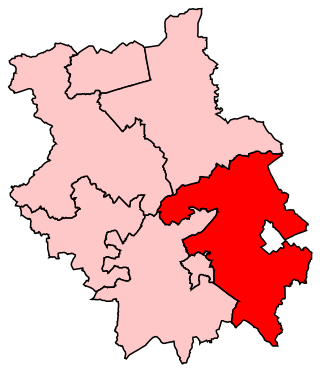
South East Cambridgeshire was a constituency represented in the House of Commons of the UK Parliament from 2015 to 2024 by Lucy Frazer, a member of the Conservative Party who has served as the Culture Secretary since 2023. The constituency was established for the 1983 general election and was based on the cathedral city of Ely.
Wibsey is a ward within the City of Bradford Metropolitan District Council, West Yorkshire, England. The population had increased to 14,671 at the 2011 Census. Wibsey is named after Wibsey village which makes up the main part of the ward. As well as the area of Wibsey, the ward includes the area of Bankfoot to the east and much of the area of Odsal. It is located on a ridge which runs from the city centre, up to Queensbury, which has been credited as the highest market town in England.
One third of Cambridge City Council is elected each year, followed by one year without election.
Chelmsford is a constituency in Essex represented in the House of Commons of the UK Parliament since 2017 by Vicky Ford of the Conservative Party.
Cambridge City Council is the local authority for Cambridge, a non-metropolitan district with city status in Cambridgeshire, England. The council has been under Labour majority control since 2014. It meets at Cambridge Guildhall. The council is a member of the Cambridgeshire and Peterborough Combined Authority.
Elections for Cambridge City Council were held on Thursday 5 May 2011. As the council is elected by thirds, one seat in each of the wards was up for election, with the exception of Cherry Hinton ward where two seats were up for election due to the early retirement of Councillor Stuart Newbold. The vote took place alongside the 2011 United Kingdom Alternative Vote referendum and a Cambridgeshire County Council by-election for Arbury ward.
Elections for Cambridge City Council were held on Thursday 3 May 2012. One third of the council was up for election and the Liberal Democrats lost overall control of the council, to No Overall Control.
The 2014 Cambridge City Council election took place on 22 May 2014 to elect members of Cambridge City Council in England. This was on the same day as other local elections and the European Union elections.
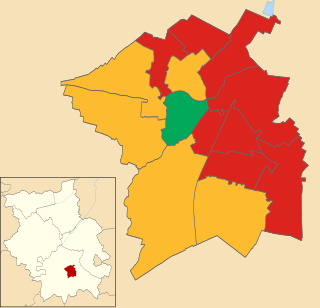
The 2015 Cambridge City Council election took place on 7 May 2015 to elect members of Cambridge City Council in England as part of the English local elections of that year coinciding with the 2015 General Election.
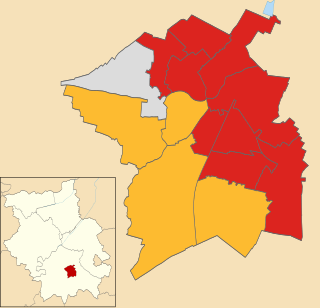
The 2016 Cambridge City Council election took place on 5 May 2016 to elect members of Cambridge City Council in England. This was on the same day as other nationwide local elections. The Labour Party grouping gained two seats from the Liberal Democrats, increasing their majority on the council from 6 to 10 seats.
Elections to Cambridge City Council were held on 6 May 2010 as part of the wider local elections across England.
The 2018 Cambridge City Council election took place on 3 May 2018 to elect members of Cambridge City Council in England. This was on the same day as other nationwide local elections.
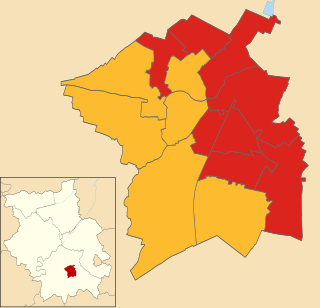
The 2019 Cambridge City Council election took place on 2 May 2019 to elect members of Cambridge City Council in England. It took place on the same day as other nationwide local elections.
The 1992 Derby City Council election took place on 7 May 1992 to elect members of Derby City Council in England. Local elections were held in the United Kingdom in 1992. This was on the same day as other local elections. 14 of the council's 44 seats were up for election. No seats changed hands and the council remained under no overall control, with the Conservatives and Labour holding exactly half the seats each.
The 2021 Cambridge City Council election took place on 6 May 2021 to elect members of Cambridge City Council in England. This was on the same day as other nationwide local elections.
The 2002 Cambridge City Council election took place on 2 May 2002 to elect members of Cambridge City Council in England. This was on the same day as other nationwide local elections.
The 2003 Cambridge City Council election took place on 1 May 2003 to elect members of Cambridge City Council in England. This was on the same day as other nationwide local elections.
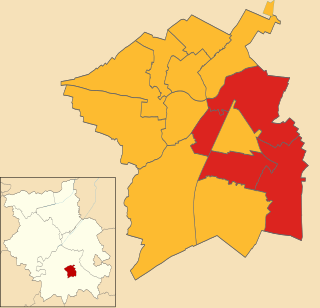
The 2007 Cambridge City Council election took place on 3 May 2007 to elect members of Cambridge City Council in England. This was on the same day as other nationwide local elections.
The 2008 Cambridge City Council election took place on 1 May 2008 to elect members of Cambridge City Council in England. This was on the same day as other nationwide local elections.