2021 Cambridge City Council election

Last updated

The 2021 Cambridge City Council election took place on 6 May 2021 to elect members of Cambridge City Council in England. [1] This was on the same day as other nationwide local elections.

Contents

2021 Cambridge City Council election
Flag of the United Kingdom.svg
  2019 6 May 2021 2022  

All 42 council seats up for election
22 seats needed for a majority
 First partySecond partyThird party
  No image wide.svg No image wide.svg No image wide.svg
Party Labour Liberal Democrats Green
Last election26150
Seats after27122
Seat changeIncrease2.svg 1Decrease2.svg 3Increase2.svg2

 Fourth party
  No image wide.svg
Party Independents
Last election1
Seats after1
Seat changeSteady2.svg

Cambridge UK ward map 2021.svg
Map showing the results of the 2021 Cambridge City Council election

Results summary

2021 Cambridge City Council election
PartySeatsGainsLossesNet gain/lossSeats %Votes %Votes+/−
  Labour 2754Increase2.svg164.340.744,755+3.5
  Liberal Democrats 1225Decrease2.svg328.625.828,380-9.2
  Green 220Increase2.svg24.819.721,654+4.4
  Independent 111Steady2.svg2.42.22,410±0.0
  Conservative 000Steady2.svg0.011.612,718+2.8
 Rebooting Democracy000Steady2.svg0.00.163New
  Workers Party 000Steady2.svg0.00.156New
  UKIP 000Steady2.svg0.0<0.155-1.2

Ward results

Percentages are calculated by dividing the total number of votes by the number of seats available, then dividing the total each candidate received by that number, and multiplied by one-hundred.

Abbey

Abbey
PartyCandidateVotes%
Green Naomi Bennett 1,178 44.9
Green Hannah Copley 1,144 43.6
Labour Haf Davies 1,090 41.5
Green Matt Howard1,03339.4
Labour Richard Johnson1,02939.2
Labour Nicky Massey1,01438.6
Conservative Timothy Haire29911.4
Liberal Democrats Elizabeth Parkin27010.3
Conservative Geoffrey Owen2369.0
Conservative Paul Roper2348.9
Liberal Democrats Sophie West1997.6
Liberal Democrats Zoe Zhang1495.7
Turnout 2,86538.8
Green gain from Labour
Labour hold
Top-candidate result%+/-
Green 41.5+18.9
Labour 38.4-11.6
Conservative 10.5+2.0
Liberal Democrat 9.5-6.1

Arbury

Arbury
PartyCandidateVotes%
Labour Carina O'Reilly 1,241 53.0
Labour Mike Todd-Jones 1,106 47.3
Labour Patrick Sheil 1,006 43.0
Liberal Democrats Tim Ward54923.5
Green Tracy Bend46920.0
Green Katrina Barnes46419.8
Liberal Democrats Hannah Whitehouse43918.8
Liberal Democrats Rory Clark38716.5
Green Stephen Lawrence34214.6
Conservative Robert Boorman33914.5
Conservative Rhona Boorman32413.8
Conservative Ian Gregory29312.5
Rebooting DemocracyKeith Garrett632.7
Turnout 2,55539.2
Labour hold
Labour hold
Labour hold
Top-candidate result%+/-
Labour 47.8-1.1
Liberal Democrat 21.1-3.6
Green 18.1+2.4
Conservative 13.0+2.3

Castle

Castle
PartyCandidateVotes%
Labour Sarah Baigent 938 41.7
Liberal Democrats Cheney-Anne Payne 854 37.9
Labour Simon Smith 810 36.0
Liberal Democrats Caroline Stoddart76834.1
Liberal Democrats Michael Franklin72332.1
Labour Michael Black67530.0
Green Simon Baron48221.4
Green Amber-Page Moss47421.1
Green James Murray-White32314.3
Conservative Paul Fray24110.7
Conservative Mike Haplin24110.7
Conservative Philip Salway22510.0
Turnout 2,34748.3
Labour gain from Independent
Liberal Democrats hold
Labour gain from Liberal Democrats
Top-candidate result%+/-
Labour 37.3+7.9
Liberal Democrat 34.0-15.9
Green 19.2+5.2
Conservative 9.6+2.9

Cherry Hinton

Cherry Hinton
PartyCandidateVotes%
Labour Mark Ashton 1,354 58.5
Labour Robert Dryden 1,235 53.3
Labour Russ McPherson 1,235 53.3
Conservative Eric Barrett-Payton54123.4
Conservative David Smith45319.6
Liberal Democrats James Hill38716.7
Green Richard Potter35715.4
Green Eli Langfere33314.4
Green Caitlin Patterson31513.6
Conservative Delowar Hossain28012.1
Liberal Democrats Archie McCann24110.4
Liberal Democrats Freddie Poser2159.3
Turnout 2,56539.9
Labour hold
Labour hold
Labour hold
Top-candidate result%+/-
Labour 51.3+1.9
Conservative 20.5+7.9
Liberal Democrat 14.7-6.9
Green 13.5-2.9

Coleridge

Coleridge
PartyCandidateVotes%
Labour Lewis Herbert 1,289 54.0
Labour Rosy Moore 1,205 50.4
Labour Anna Smith 1,067 44.7
Green Bridget Bradshaw66127.7
Green Sara Lightowlers49820.8
Liberal Democrats Tim Brunton38416.1
Conservative Robert Nelson38316.0
Conservative Gail Kenney37615.7
Green Iain Webb36415.2
Liberal Democrats Peter McLaughlin33113.9
Conservative Linda Yeatman32113.4
Liberal Democrats Freddie Frisk28712.0
Turnout 2,61540.2
Labour hold
Labour hold
Labour hold
Top-candidate result%+/-
Labour 47.4+1.4
Green 24.3+6.8
Liberal Democrat 14.1-4.6
Conservative 14.1+3.0

East Chesterton

East Chesterton
PartyCandidateVotes%
Labour Gerri Bird 1,463 53.5
Labour Carla McQueen 1,023 37.4
Liberal Democrats Michael Bond 983 36.0
Labour Baiju Thittala87331.7
Liberal Democrats Bob Illingworth77328.3
Liberal Democrats John Leighton69625.5
Green Elizabeth May62322.8
Green Gareth Bailey45716.7
Green Peter Pope43015.7
Conservative Anette Iraninejad31211.4
Conservative Frank Ribeiro27210.0
Conservative Abubakar Said2398.7
UKIP Peter Burkinshaw552.0
Turnout 2,99245.4
Labour hold
Labour hold
Liberal Democrats gain from Labour
Top-candidate result%+/-
Labour 42.6-1.5
Liberal Democrat 28.6-4.6
Green 18.1+7.2
Conservative 9.1+2.5

King's Hedges

King's Hedges
PartyCandidateVotes%
Labour Jenny Wood 1,013 50.2
Labour Alex Collis 966 47.9
Labour Martin Smart 750 37.2
Liberal Democrats Andy McKay42721.2
Conservative John Ionides40119.9
Green Julia Tozer36918.3
Green Mark Slade36718.2
Conservative Jenny Ward35217.5
Liberal Democrats Laurence Van Someren34717.2
Green Adrian Matthews34016.9
Liberal Democrats Joshan Parmar33516.6
Conservative Rosemary Ward32916.3
Workers Party Lionel Vida562.8
Turnout 2,22132.9
Labour hold
Labour hold
Labour hold
Top-candidate result%+/-
Labour 45.8+3.9
Liberal Democrat 19.3-3.1
Conservative 18.1+8.7
Green 16.7-0.6

Market

Market
PartyCandidateVotes%
Liberal Democrats Tim Bick 983 41.3
Labour Alice Gilderdale 960 40.3
Liberal Democrats Katie Porrer 868 36.4
Liberal Democrats Anthony Martinelli85635.9
Labour Graeme Hodgson75131.5
Labour James Youd68828.9
Green Nicola Eliott62826.4
Green Emma Garnett43618.3
Green Isabelle Thomas34214.4
Conservative Tania Oram2219.3
Conservative Phoebe Pickering2189.2
Conservative James Appiah1948.1
Turnout 2,48737.3
Liberal Democrats hold
Labour gain from Liberal Democrats
Liberal Democrats hold
Top-candidate result%+/-
Liberal Democrat 35.2-13.4
Labour 34.4+7.7
Green 22.5+4.1
Conservative 7.9+1.6

Newnham

Newnham
PartyCandidateVotes%
Liberal Democrats Lucy Nethsingha 939 40.3
Labour Niamh Sweeney 910 39.1
Liberal Democrats Markus Gehring 844 36.2
Labour Cameron Holloway81735.1
Liberal Democrats Josh Matthews77633.3
Labour Hollie Wright72631.2
Green Beverley Carpenter60926.1
Green Shanna Hart47520.4
Green Brett Hughes36515.7
Conservative Wendy Fray1968.4
Conservative James Vitali1817.8
Conservative Mo Pantall1486.4
Turnout 2,43937.6
Liberal Democrats hold
Labour gain from Liberal Democrats
Liberal Democrats hold
Top-candidate result%+/-
Liberal Democrat 35.4-14.7
Labour 34.3+6.7
Green 22.9+9.1
Conservative 7.4-1.1

Petersfield

Petersfield
PartyCandidateVotes%
Labour Mike Davey 1,590 50.0
Labour Katie Thornburrow 1,532 48.2
Labour Richard Robertson 1,362 42.8
Liberal Democrats Emmanuel Carraud91528.8
Liberal Democrats Judy Brunton80725.4
Green Jenny Richens75523.7
Liberal Democrats Cosmo Lupton71122.4
Green Edwin Wilkinson54017.0
Green Krzystof Strug47214.8
Conservative Shapour Meftah34610.9
Conservative David Thomas2818.8
Conservative Robert Yeatman2267.1
Turnout 3,32547.7
Labour hold
Labour hold
Labour hold
Top-candidate result%+/-
Labour 44.1-1.4
Liberal Democrat 25.4-3.8
Green 20.9+0.6
Conservative 9.6+4.6

Queen Edith's

Queen Edith's
PartyCandidateVotes%
Independent Sam Davies 1,874 62.4
Liberal Democrats Jenny Page-Croft 1,074 35.7
Liberal Democrats Daniel Lee 816 27.2
Liberal Democrats Richard Eccles70923.6
Labour Indy Vadhia64721.5
Labour Dan Zahedi64721.5
Labour Connor Morrissey55418.4
Independent Al Dixon53617.8
Conservative Christine Butler51217.0
Green Jacqueline Whitmore47315.7
Green Peter Price37712.5
Green Simon Whitmore31810.6
Conservative Shoaib Shahid2799.3
Conservative Suhaib Shahid1996.6
Turnout 3,35849.4
Independent gain from Liberal Democrats
Liberal Democrats hold
Top-candidate result%+/-
Independent 40.9+12.0
Liberal Democrat 23.4-13.4
Labour 14.1-1.9
Conservative 11.2+4.1
Green 10.3-1.0

Romsey

Romsey
PartyCandidateVotes%
Labour Dave Baigent 1,575 55.7
Labour Mairead Healey 1,423 50.3
Labour Dinah Pounds 1,378 48.7
Green Sarah Nicmanis64322.7
Green Suzie Webb63222.3
Green Elisabeth Whitebread61521.7
Liberal Democrats Laura Ryan52618.6
Liberal Democrats Friso De Graaf40614.3
Liberal Democrats John Walmsley37513.3
Conservative Mohammed Azamuddin33711.9
Conservative Daniel Collis33211.7
Conservative Richard Haddon2488.8
Turnout 3,02744.8
Labour hold
Labour hold
Labour hold
Top-candidate result%+/-
Labour 51.1+2.7
Green 20.9-2.1
Liberal Democrat 17.1-5.3
Conservative 10.9+4.7

Trumpington

Trumpington
PartyCandidateVotes%
Liberal Democrats Alan Cox 1,298 44.0
Liberal Democrats Ingrid Flaubert 1,246 42.2
Liberal Democrats Olaf Hauk 1,085 36.8
Labour Amanda Hawkes94632.1
Labour Nasir Uddin72924.7
Labour Arran Parry-Davis72024.4
Green Ceri Galloway60420.5
Conservative Laurence Fischer57419.5
Conservative Steven George54818.6
Conservative Mike Spencer42114.3
Green Sue Wells35912.2
Green Hero Tardrew31910.8
Turnout 3,24643.4
Liberal Democrats hold
Liberal Democrats gain from Labour
Liberal Democrats hold
Top-candidate result%+/-
Liberal Democrat 37.9-5.0
Labour 27.6-0.2
Green 17.7+0.6
Conservative 16.8+4.5

West Chesterton

West Chesterton
PartyCandidateVotes%
Labour Mike Sargeant 1,668 49.8
Labour Jocelynne Scutt 1,514 45.2
Liberal Democrats Jamie Dalzell 1,305 38.9
Labour Richard Swift1,23636.9
Liberal Democrats Shahida Rahman1,05731.5
Liberal Democrats David Grace1,04031.0
Green Roger Giddings63418.9
Green Har Kaur56616.9
Green Shayne Mitchell46914.0
Conservative Michael Harford3339.9
Conservative Sam Hunt2337.0
Turnout 3,57554.0
Labour hold
Labour gain from Liberal Democrats
Liberal Democrats hold
Top-candidate result%+/-
Labour 42.3+9.6
Liberal Democrat 33.1-17.4
Green 16.1+5.2
Conservative 8.5+2.5

Related Research Articles

<span class="mw-page-title-main">Departments of France</span> Administrative subdivision in France

In the administrative divisions of France, the department is one of the three levels of government under the national level, between the administrative regions and the communes. Ninety-six departments are in metropolitan France, with an additional five constituting overseas departments, which are also classified as overseas regions. Departments are further subdivided into 333 arrondissements and 2,054 cantons. These last two levels of government have no political autonomy, instead serving as the administrative basis for the local organisation of police, fire departments as well as, in certain cases, elections.

<span class="mw-page-title-main">Local government</span> Lowest in the administration pyramid

Local government is a generic term for the lowest tiers of governance or public administration within a particular sovereign state.

<span class="mw-page-title-main">South Cambridgeshire</span> Non-metropolitan district in England

South Cambridgeshire is a local government district of Cambridgeshire, England, with a population of 162,119 at the 2021 census. It was formed on 1 April 1974 by the merger of Chesterton Rural District and South Cambridgeshire Rural District. It completely surrounds the city of Cambridge, which is administered separately from the district by Cambridge City Council.

<span class="mw-page-title-main">Belfast City Council</span> Local authority in Northern Ireland

Belfast City Council is the local authority with responsibility for part of Belfast, the largest city of Northern Ireland. The council serves an estimated population of 348,005 (2022), the largest of any district council in Northern Ireland, while being the smallest by area. Belfast City Council is the primary council of the Belfast Metropolitan Area, a grouping of six former district councils with commuter towns and overspill from Belfast, containing a total population of 579,276.

<span class="mw-page-title-main">Municipalities of South Africa</span> Local government structure in South Africa

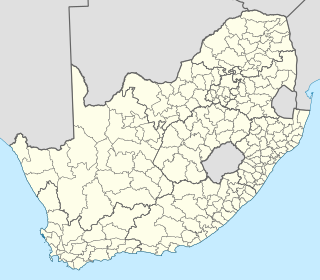
Local government in South Africa consists of municipalities of various types. The largest metropolitan areas are governed by metropolitan municipalities, while the rest of the country is divided into counties called district municipalities, each of which consists of several boroughs called local municipalities. Since the boundary reform at the time of the municipal election of 3 August 2016 there are eight metropolitan municipalities, 44 district municipalities and 205 local municipalities.

<span class="mw-page-title-main">Local government in the Republic of Ireland</span> Tier of administration in Ireland

The functions of local government in the Republic of Ireland are mostly exercised by thirty-one local authorities, termed County, City, or City and County Councils. The principal decision-making body in each of the thirty-one local authorities is composed of the members of the council, elected by universal franchise in local elections every five years from multi-seat local electoral areas using the single transferable vote. Many of the authorities' statutory functions are, however, the responsibility of ministerially appointed career officials termed Chief executives. The competencies of the city and county councils include planning, transport infrastructure, sanitary services, public safety and the provision of public libraries. Each local authority sends representatives to one of three Regional Assemblies.

<span class="mw-page-title-main">City of Johannesburg Metropolitan Municipality</span> Metropolitan municipality in Gauteng, South Africa

The City of Johannesburg Metropolitan Municipality is a metropolitan municipality that manages the local governance of Johannesburg, the largest city in South Africa. It is divided into several branches and departments in order to expedite services for the city. Zulu is the most spoken home language at 23.4% followed by English at 20.1%.

<span class="mw-page-title-main">City of Cape Town</span> Metropolitan municipality in South Africa

The City of Cape Town is a metropolitan municipality that forms the local government of Cape Town and surrounding areas. As of the 2016 community survey, it had a population of 4,005,016.

The wards and electoral divisions in the United Kingdom are electoral districts at sub-national level, represented by one or more councillors. The ward is the primary unit of English electoral geography for civil parishes and borough and district councils, the electoral ward is the unit used by Welsh principal councils, while the electoral division is the unit used by English county councils and some unitary authorities. Each ward/division has an average electorate of about 5,500 people, but ward population counts can vary substantially. As of 2021 there are 8,694 electoral wards/divisions in the UK. An average area of wards or electoral divisions in the United Kingdom is 28.109 km2 (10.853 sq mi).

The Sangguniang Panlungsod (SP) is the local legislative body of a city government in the Philippines. The name of the legislative body comes from the Filipino words "sanggunian" ("council") – ultimately from the rootword "sangguni" – both of Tagalog origins, with the latter word also of Kapampangan and Old Tagalog origins, and "lungsod" ("city") of both Tagalog – but ultimately Cebuano – origins; "city council" is therefore often used as an equivalent term in English or Philippine English. Members of the city council are referred to as "kagawad"; while in mostly but not only predominantly Cebuano-speaking cities, they are called "konsehal" (masc.) and "konsehala" (fem.), or "sehal".

<span class="mw-page-title-main">Highland Council</span> Scottish unitary authority council in Highland, Scotland, UK

The Highland Council, the political body covering the Highland local authority created in 1995, comprises 21 wards, each electing three or four councillors by the single transferable vote system, which creates a form of proportional representation. The total number of councillors is 74, and the main meeting place and main offices are at the Highland Council Headquarters in Glenurquhart Road, Inverness.

St Albans City and District Council elections are held three years out of every four to elect members of St Albans City and District Council in Hertfordshire, England. Since the last boundary changes in 2022 the council has comprised 56 councillors, with the district being divided into 20 wards. Elections to Hertfordshire County Council are held in the fourth year of the cycle when there are no district council elections.

<span class="mw-page-title-main">Mogale City Local Municipality</span> Local municipality in Gauteng, South Africa

Mogale City Local Municipality is a local municipality within the West Rand District Municipality, in the Gauteng province of South Africa.

<span class="mw-page-title-main">2011 Cambridge City Council election</span> 2011 UK local government election

Elections for Cambridge City Council were held on Thursday 5 May 2011. As the council is elected by thirds, one seat in each of the wards was up for election, with the exception of Cherry Hinton ward where two seats were up for election due to the early retirement of Councillor Stuart Newbold. The vote took place alongside the 2011 United Kingdom Alternative Vote referendum and a Cambridgeshire County Council by-election for Arbury ward.

<span class="mw-page-title-main">Wards of Glasgow</span> Electoral Districts in Glasgow, Scotland

The City of Glasgow is divided into a number of wards. These electoral districts, as they are also known, are used to elect councillors to Glasgow City Council. The council, composed of the elected members from each ward, provides local government services to the City of Glasgow.

<span class="mw-page-title-main">2021 Cambridgeshire and Peterborough mayoral election</span>

The 2021 Cambridgeshire and Peterborough mayoral election was held on 6 May 2021 to elect the mayor of Cambridgeshire and Peterborough.

<span class="mw-page-title-main">2020 Ukrainian local elections</span> Ukrainian municipal elections

The 2020 Ukrainian local elections took place on Sunday 25 October 2020. In the election, deputies of district councils and rural townships were elected and elections for city mayors were held. In practice this will mean that most voters had to fill out four ballots. On 15, 22 and 29 November and 6 December 2020 a second round of mayoral elections was held in cities with more than 75,000 voters where no candidate gained more than 50% of the votes.

<span class="mw-page-title-main">2021 Southampton City Council election</span> 2021 UK local government election

The 2021 Southampton City Council election took place in on 6 May 2021, on the same day as other local elections, to elect members of Southampton City Council. The election was originally due to take place in May 2020, to elect to the seats of councillors last elected in 2016, but was postponed due to the COVID-19 pandemic.

<span class="mw-page-title-main">2021 Hull City Council election</span> 2021 UK local government election

The 2021 Hull City Council election took place on 6 May 2021 to elect members of Hull City Council in England. This was on the same day as other nationwide local elections. In March 2020 the government announced that the elections scheduled for 7 May 2020 would be delayed for a year due to the COVID-19 pandemic. They were now held at the same time as the elections previously scheduled for 2021. Following a review of Ward boundaries by the Local Government Boundary Commission for England (LGBCE) the whole council was elected in 2018, the 2nd placed winning candidate at that election is up for re-election in 2021. The Labour Party was defending overall control of the council.

<span class="mw-page-title-main">2022 Cardiff Council election</span> Local election in Wales

The 2022 Cardiff Council election took place on 5 May 2022 to elect 79 members to Cardiff Council. On the same day, elections were held to the other 21 local authorities and to community councils in Wales as part of the 2022 Welsh local elections.

References

  1. "Local Elections - Thursday, 6 May 2021". Cambridge City Council. 6 May 2021. Retrieved 9 May 2021.