| |||||||||||||||||||||||||||||||||||||
14 out of 42 seats to Cambridge City Council 22 seats needed for a majority | |||||||||||||||||||||||||||||||||||||
---|---|---|---|---|---|---|---|---|---|---|---|---|---|---|---|---|---|---|---|---|---|---|---|---|---|---|---|---|---|---|---|---|---|---|---|---|---|
Turnout | 44.5% (5.8%) | ||||||||||||||||||||||||||||||||||||
| |||||||||||||||||||||||||||||||||||||
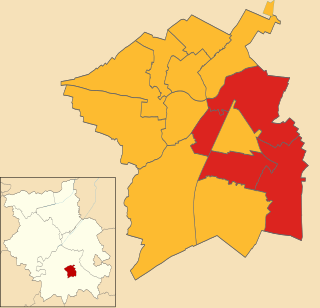
Winner of each seat at the 1991 Cambridge City Council election | |||||||||||||||||||||||||||||||||||||
|
The 1991 Cambridge City Council election took place on 2 May 1991 to elect members of Cambridge City Council in Cambridge, Cambridgeshire, England. [1] This was on the same day as other local elections across England.
1991 Cambridge City Council election | ||||||||||
---|---|---|---|---|---|---|---|---|---|---|
Party | This election | Full council | This election | |||||||
Seats | Net | Seats % | Other | Total | Total % | Votes | Votes % | +/− | ||
Labour | 7 | 1 | 50.0 | 16 | 23 | 54.8 | 13,480 | 37.5 | –8.1 | |
Conservative | 3 | 1 | 21.4 | 10 | 13 | 31.0 | 11,202 | 31.1 | +3.8 | |
Liberal Democrats | 4 | 28.6 | 2 | 6 | 14.3 | 9,933 | 27.6 | +8.5 | ||
Green | 0 | 0.0 | 0 | 0 | 0.0 | 1,349 | 3.8 | –4.2 | ||
Party | Candidate | Votes | % | ±% | |
---|---|---|---|---|---|
Labour | John Durrant* | 1,050 | 61.4 | –5.6 | |
Conservative | Robert Marven | 418 | 24.4 | +3.6 | |
Liberal Democrats | Brian Whitt | 169 | 9.9 | +4.4 | |
Green | Phillipa Bryan | 74 | 4.3 | –2.4 | |
Majority | 632 | 36.9 | –9.2 | ||
Turnout | 1,711 | 36.4 | –6.3 | ||
Registered electors | 4,705 | ||||
Labour hold | Swing | 4.6 | |||
Party | Candidate | Votes | % | ±% | |
---|---|---|---|---|---|
Labour | Sandra Wilson | 1,034 | 48.0 | –6.4 | |
Conservative | Vivian Ellis | 655 | 30.4 | +2.6 | |
Liberal Democrats | Evelyn Corder | 466 | 21.6 | +9.7 | |
Majority | 379 | 17.6 | –9.0 | ||
Turnout | 2,155 | 41.2 | –6.4 | ||
Registered electors | 5,230 | ||||
Labour hold | Swing | 4.5 | |||
Party | Candidate | Votes | % | ±% | |
---|---|---|---|---|---|
Liberal Democrats | David Howarth* | 1,565 | 50.3 | +16.7 | |
Conservative | Richard Baty | 930 | 29.9 | +0.9 | |
Labour | Kevin Price | 616 | 19.8 | –10.1 | |
Majority | 635 | 20.4 | +16.7 | ||
Turnout | 3,111 | 50.9 | –4.6 | ||
Registered electors | 6,111 | ||||
Liberal Democrats hold | Swing | 7.9 | |||
Party | Candidate | Votes | % | ±% | |
---|---|---|---|---|---|
Conservative | Stephen Hillier | 1,182 | 44.4 | +12.7 | |
Labour | Anthony Schofield | 1,150 | 43.2 | –10.7 | |
Liberal Democrats | Kevin Wilkins | 332 | 12.5 | +5.9 | |
Majority | 32 | 1.2 | N/A | ||
Turnout | 2,664 | 49.0 | –2.6 | ||
Registered electors | 5,433 | ||||
Conservative hold | Swing | 11.7 | |||
Party | Candidate | Votes | % | ±% | |
---|---|---|---|---|---|
Labour | Paul Diamond | 1,320 | 48.2 | –6.6 | |
Conservative | Audrey Hall | 1,011 | 37.0 | +5.5 | |
Liberal Democrats | Stephen Howarth | 290 | 10.6 | +3.0 | |
Green | Yvonne Douglas | 115 | 4.2 | –1.9 | |
Majority | 309 | 11.3 | N/A | ||
Turnout | 2,736 | 47.8 | –4.2 | ||
Registered electors | 5,729 | ||||
Labour hold | Swing | 6.1 | |||
Party | Candidate | Votes | % | ±% | |
---|---|---|---|---|---|
Liberal Democrats | Roman Znajek | 1,083 | 33.7 | +11.4 | |
Conservative | Patrick Harding | 1,033 | 32.1 | +3.4 | |
Labour | Andrew Milbourn | 1,008 | 31.3 | –12.3 | |
Green | Peter Pope | 94 | 2.9 | –2.5 | |
Majority | 50 | 1.6 | N/A | ||
Turnout | 3,218 | 51.1 | –3.5 | ||
Registered electors | 6,299 | ||||
Liberal Democrats gain from Conservative | Swing | 4.0 | |||
Party | Candidate | Votes | % | ±% | |
---|---|---|---|---|---|
Labour | Kevin Southernwood | 999 | 57.3 | –4.2 | |
Conservative | Geoffrey Howe | 465 | 26.7 | +8.8 | |
Liberal Democrats | Stephen Warde | 279 | 16.0 | +2.3 | |
Majority | 534 | 30.6 | –13.0 | ||
Turnout | 1,743 | 34.4 | –6.1 | ||
Registered electors | 5,073 | ||||
Labour hold | Swing | 6.5 | |||
Party | Candidate | Votes | % | ±% | |
---|---|---|---|---|---|
Liberal Democrats | Andrew Lake | 1,344 | 49.5 | +8.4 | |
Labour | Kevin Blencowe | 821 | 30.3 | –7.6 | |
Conservative | Martin Graham | 353 | 13.0 | +1.5 | |
Green | Timothy Cooper | 196 | 7.2 | –2.3 | |
Majority | 523 | 19.3 | +16.1 | ||
Turnout | 2,714 | 45.2 | –8.2 | ||
Registered electors | 6,005 | ||||
Liberal Democrats hold | Swing | 8.0 | |||
Party | Candidate | Votes | % | ±% | |
---|---|---|---|---|---|
Labour | Daphne Roper | 1,010 | 33.2 | –13.3 | |
Conservative | Kenneth Wheatcroft | 896 | 29.5 | +5.1 | |
Liberal Democrats | Pamela Strachan | 857 | 28.2 | +10.5 | |
Green | Margaret Wright | 278 | 9.1 | –2.2 | |
Majority | 114 | 3.7 | –18.4 | ||
Turnout | 3,041 | 41.6 | –6.0 | ||
Registered electors | 7,306 | ||||
Labour gain from Liberal Democrats | Swing | 9.2 | |||
Party | Candidate | Votes | % | ±% | |
---|---|---|---|---|---|
Labour | Beth Scott | 1,358 | 56.5 | –8.7 | |
Conservative | Peter Welton | 464 | 19.3 | +2.0 | |
Liberal Democrats | Andrew Paton | 344 | 14.3 | =5.0 | |
Green | Guy Grimley | 236 | 9.8 | –2.7 | |
Majority | 894 | 37.2 | –6.4 | ||
Turnout | 2,402 | 38.8 | –7.8 | ||
Registered electors | 6,194 | ||||
Labour hold | Swing | 3.2 | |||
Party | Candidate | Votes | % | ±% | |
---|---|---|---|---|---|
Conservative | George Reid* | 1,381 | 46.7 | +2.6 | |
Liberal Democrats | Tricia Charlesworth | 867 | 29.3 | +2.4 | |
Labour | Janice Auton | 711 | 24.0 | –3.0 | |
Majority | 514 | 17.4 | +4.4 | ||
Turnout | 2,959 | 52.1 | –5.5 | ||
Registered electors | 5,683 | ||||
Conservative hold | Swing | 0.1 | |||
Party | Candidate | Votes | % | ±% | |
---|---|---|---|---|---|
Labour | Simon Sedgwick-Jell* | 1,111 | 52.3 | –8.2 | |
Liberal Democrats | Thomas Timmons | 413 | 19.5 | +5.5 | |
Conservative | Jason Webb | 376 | 17.8 | +3.2 | |
Green | Ian Miller | 217 | 10.3 | –0.5 | |
Majority | 698 | 33.0 | –13.1 | ||
Turnout | 2,117 | 39.2 | –6.0 | ||
Registered electors | 5,395 | ||||
Labour hold | Swing | 6.9 | |||
Party | Candidate | Votes | % | ±% | |
---|---|---|---|---|---|
Conservative | Justin Coleman | 1,235 | 48.9 | +8.2 | |
Liberal Democrats | Phillipa Slatter | 682 | 27.0 | +2.0 | |
Labour | Andrew Powell | 469 | 18.6 | –6.6 | |
Green | David Rees | 139 | 5.5 | –3.5 | |
Majority | 553 | 21.9 | +6.4 | ||
Turnout | 2,525 | 41.0 | –5.2 | ||
Registered electors | 6,155 | ||||
Conservative hold | Swing | 3.1 | |||
Party | Candidate | Votes | % | ±% | |
---|---|---|---|---|---|
Liberal Democrats | Evelyn Knowles* | 1,242 | 43.3 | +11.7 | |
Labour | Paul McHugh | 823 | 28.7 | –2.6 | |
Conservative | Michael Farrington | 803 | 28.0 | –1.6 | |
Majority | 419 | 13.3 | +12.9 | ||
Turnout | 2,868 | 52.2 | –4.3 | ||
Registered electors | 5,496 | ||||
Liberal Democrats hold | Swing | 7.2 | |||
South Cambridgeshire was a constituency represented in the House of Commons of the UK Parliament since 2019 by Anthony Browne, a Conservative.
One third of Cambridge City Council is elected each year, followed by one year without election.
Cambridge City Council is the local authority for Cambridge, a non-metropolitan district with city status in Cambridgeshire, England. The council has been under Labour majority control since 2014. It meets at Cambridge Guildhall. The council is a member of the Cambridgeshire and Peterborough Combined Authority.
George Bazeley Scurfield was an English author, poet, and politician. He was born on 19 March 1920 in Leicestershire, England, and died on 15 December 1991 in Norwich, England. He married Cecilia Hopkinson in 1947 at Cambridge, England. They had five children, including their son the actor, Matthew Scurfield, and daughters; Sarah, Lucy, Poly and Sophy.
Elections for Cambridge City Council were held on Thursday 5 May 2011. As the council is elected by thirds, one seat in each of the wards was up for election, with the exception of Cherry Hinton ward where two seats were up for election due to the early retirement of Councillor Stuart Newbold. The vote took place alongside the 2011 United Kingdom Alternative Vote referendum and a Cambridgeshire County Council by-election for Arbury ward.
Elections for Cambridge City Council were held on Thursday 3 May 2012. One third of the council was up for election and the Liberal Democrats lost overall control of the council, to No Overall Control.
The 2014 Cambridge City Council election took place on 22 May 2014 to elect members of Cambridge City Council in England. This was on the same day as other local elections and the European Union elections.
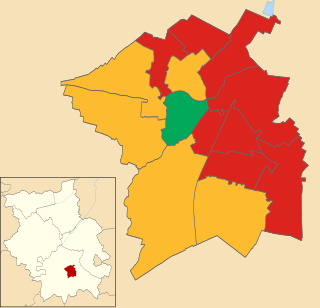
The 2015 Cambridge City Council election took place on 7 May 2015 to elect members of Cambridge City Council in England as part of the English local elections of that year coinciding with the 2015 General Election.
Rochester-upon-Medway was a non-metropolitan district in Kent, England. It was abolished on 1 April 1998 and replaced by Medway.
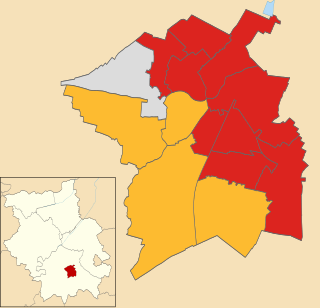
The 2016 Cambridge City Council election took place on 5 May 2016 to elect members of Cambridge City Council in England. This was on the same day as other nationwide local elections. The Labour Party grouping gained two seats from the Liberal Democrats, increasing their majority on the council from 6 to 10 seats.
Elections to Cambridge City Council were held on 6 May 2010 as part of the wider local elections across England.
The 2018 Cambridge City Council election took place on 3 May 2018 to elect members of Cambridge City Council in England. This was on the same day as other nationwide local elections.
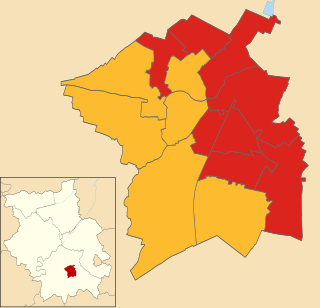
The 2019 Cambridge City Council election took place on 2 May 2019 to elect members of Cambridge City Council in England. It took place on the same day as other nationwide local elections.
The 1991 Derby City Council election took place on 2 May 1991 to elect members of Derby City Council in England. Local elections were held in the United Kingdom in 1991. This was on the same day as other local elections. 15 of the council's 44 seats were up for election. The council, which had previously been under Conservative council, fell under no overall control with the Conservatives and Labour holding exactly half the seats each.
The 2021 Cambridge City Council election took place on 6 May 2021 to elect members of Cambridge City Council in England. This was on the same day as other nationwide local elections.
The 2002 Cambridge City Council election took place on 2 May 2002 to elect members of Cambridge City Council in England. This was on the same day as other nationwide local elections.
The 2003 Cambridge City Council election took place on 1 May 2003 to elect members of Cambridge City Council in England. This was on the same day as other nationwide local elections.
The 2007 Cambridge City Council election took place on 3 May 2007 to elect members of Cambridge City Council in England. This was on the same day as other nationwide local elections.
The 2008 Cambridge City Council election took place on 1 May 2008 to elect members of Cambridge City Council in England. This was on the same day as other nationwide local elections.
The 1991 St Albans City and District Council election took place on 2 May 1991 to elect members of St Albans City and District Council in England. This was on the same day as other local elections.